
Figure 4.
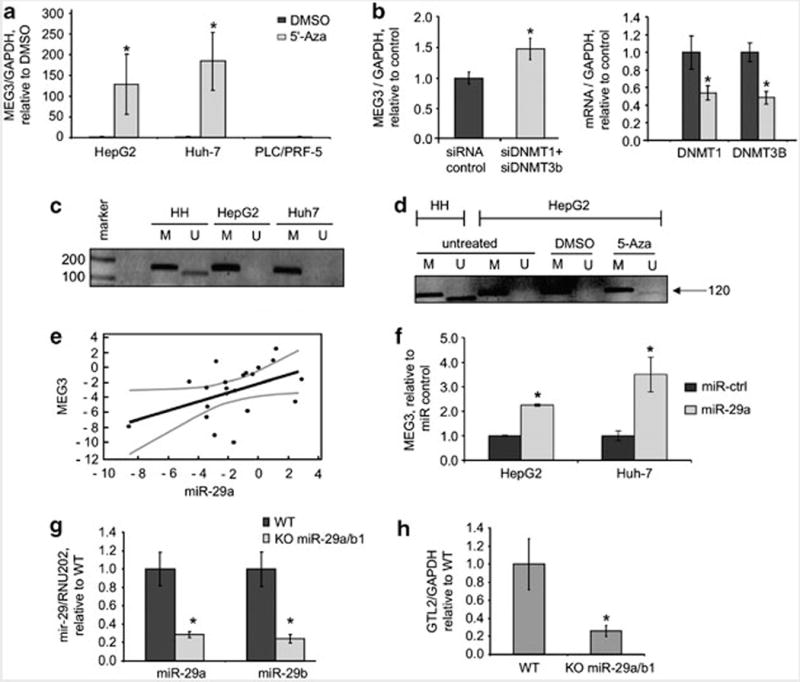
MEG3 expression is methylation dependent. (a) Cells were incubated with 5-Aza-dc (Calbiochem, Darmstadt, Germany) 10 μM for 5 days and MEG3 expression was assessed by real time PCR. Bars represent mean and standard error of three independent experiments, relative to control (dimethyl sulfoxide (DMSO)). *P<0.05 relative to controls. (b) HepG2 cells were transfected with siRNA to DNMT1 + DNMT3b or siRNA control (100nM, Dharmacon, Chicago, IL, USA) for 48 h. MEG3 and DNMT1 expression was assessed by real time PCR. DNMT1 and DNMT3b expression was reduced by ~50%. Bars represent mean and standard error of three independent experiments, relative to control. *P<0.05. (c) DNA was extracted by using phenol–chloroform and treated with bisulfite using the EzDNA Methylation kit (Zymoresearch, Orange, CA, USA). Bisulfite-treated DNA was then used for methylation specific PCR (MSP) reaction as previously described (Benetatos et al. 2010). PCR products were identified by ethidium bromide staining after 2% agarose gel electrophoresis. For each sample a primer set for the methylated (M) and unmethylated (U) copies of MEG3 gene was used. A 160 bp product represents the methylated state and a 120 bp PCR product stands for unmethylated state. (marker 100 bp: Promega, Madison, WI, USA). (d) HepG2 cells were treated with 5-Aza-dc 10 μM for 24 h and MSP was performed as described above. Treatment with 5-Aza-dc increased expression of the unmethylated form of MEG3. (e) miR-29a and MEG3 expression was assessed in non-malignant human hepatocytes (HH), HCC cells (HepG2, Huh-7, PLC/PRF/5, Hep-3B), human HCC tissues and adjacent non-tumoral tissues. Mir-29a expression was assessed by Taqman real time PCR assay and normalized to that of RNU6B (Applied Biosystem, Foster City, CA, USA). MEG3 expression was assessed by PCR using SYBRGreen and normalized to that of GAPDH. In the graph miR-29a and MEG3 are expressed relative to HH for the cell lines or to adjacent tissues for human HCC (log scale). Regression analysis was performed using the MedCalc Software (Mariakerke, Belgium). The fitted regression line (black) and 95% confidence intervals (gray) are shown. r = 0.45, 95% confidence intervals 0.03–0.79, P: 0.038. (f) HepG2 and Huh7 cells were transfected with pre-miR-29a or control (100 nM, Applied Biosystem). After 48 h, cells were collected, RNA extracted and real time PCR performed. Bars represent mean and standard error of three independent experiments, relative to controls. *P<0.05 relative to controls. (g) GTL2 is the MEG3 homologous gene in mouse genome. Liver-specific miR-29a/b1 KO mouse (C57BL/6) was developed by serial breeding of miR-29a/b1loxP/loxP and albumin-Cre (Alb-Cre) mice. All experiments were reviewed and approved by the Institutional Animal Care and Use Committee at the Ohio State University. RNA was collected from liver tissues from wild type (WT) or miR-29a/b1 KO mice. miR-29a and miR-29b were assessed by Taqman assay and normalized to that of RNU202. Bars represent mean and standard error of expression in four mice, relative to control (WT). *P<0.05 relative to controls. (h) GTL2 expression was assessed by SYBRGreen and normalized to that of mouse GAPDH. Bars represent mean and standard error of expression in four mice, relative to control (WT). *P<0.05 relative to controls.