

Abstract
Background
VEGF signaling pathway inhibitor (anti-VEGF) therapy is associated with hypertension, but little is known about predisposing clinical characteristics. This study describes the real-world association between baseline clinical characteristics, blood pressure (BP) response, and survival in patients prescribed anti-VEGF therapies.
Methods
Clinical data from Partners HealthCare in Massachusetts was obtained from adults treated with anti-VEGF therapies (2002–2013). Treatment-induced hypertensive response was defined as worsening of pre-existing hypertension or new diagnosis of hypertension (if no prior hypertension history).
Results
Data from 1120 patients with renal cell carcinoma (32.2%), hepatocellular carcinoma (11.6%), gastrointestinal stromal tumors (12.5%) and other sarcomas (15.3%) were analyzed. Most patients received sunitinib (52%), sorafenib (25.9%) or pazopanib (18%). A treatment-induced hypertensive response was identified in 49.7% of treated patients. Pre-existing hypertension, present in 65.4%, was an independent risk factor for BP elevation (odds ratio (OR) 1.56, 95% confidence interval (CI) 1.27–1.92); other risk factors included age ≥60 years (OR 1.26, 95%CI 1.06–1.52), and body mass index (BMI) ≥25 kg/m2 (OR 1.26, 95%CI 1.04–1.53). Race, gender, anti-VEGF therapy prescribed, and baseline antihypertensive class were not significant risk factors. The absolute observed mean increase in BP was 21 mmHg (systolic) / 15 mmHg (diastolic), both in patients with and without pre-existing hypertension. The development of hypertension predicted improved survival (hazard ratio 0.76, 95%CI 0.65–0.89).
Conclusions
Pre-existing hypertension, age, and BMI identify patients at risk for significant anti-VEGF therapy-induced BP elevation. Hypertension appears to be a clinical biomarker of efficacy to anti-VEGF therapies in a broad range of malignancies.
Keywords: Hypertension, antihypertensive agents, angiogenesis inhibitors, risk factors, survival, sunitinib, sorafenib, pazopanib
Introduction
Vascular endothelial growth factor (VEGF) signaling pathway inhibitors (anti-VEGF therapies) play an increasingly important role in the management of solid tumors,1 with approved indications including advanced renal cell carcinoma (RCC), hepatocellular cancer (HCC), gastrointestinal stromal tumors (GIST), differentiated thyroid cancer, medullary thyroid cancer, and pancreatic neuroendocrine tumors.1
Hypertension is a common side effect of anti-VEGF therapies. The reported incidence of all-grade hypertension ranges from 25% with sorafenib,2 sunitinib,3 and vandetanib,4 to 40% with pazopanib5 and axitinib.6 In addition, multiple case reports describe acute hypertensive complications of therapy with anti-VEGF therapies such as malignant hypertension7 and posterior reversible encephalopathy syndrome.8 The mechanism of development of hypertension in patients taking anti-VEGF therapies remains obscure9 but likely represents on-target effects. This is evidenced by the higher incidence of hypertension seen with more potent anti-VEGF therapies such as pazopanib and axitinib and by the finding of a correlation between the occurrence of hypertension and tumor response and survival in secondary analyses of large clinical studies.10, 11 Furthermore, studies have shown that separate genetic polymorphisms in the genes encoding VEGF-A and its main receptor, VEGFR-2, predispose to either tumor response or the development of hypertension.12 Activation of the VEGF signaling pathway leads to increased production of nitric oxide (NO) and other vasodilators; some, but not all, studies have shown that blocking this pathway with anti-VEGF therapies reduces serum levels of NO metabolites.9 Another proposed mechanism include increased activation of the endothelin-1 system, a potent vasoconstrictor.9
Despite the frequent use of anti-VEGF therapies, and thus the frequent occurrence of treatment-related hypertension, little has been published on clinical risk factors for the development of hypertension. The goal of the current analysis was to evaluate pre-existing hypertension and, in an exploratory manner, other clinical characteristics, as risk factors for the development of hypertension in patients receiving anti-VEGF therapies. The second goal was to evaluate the effect of a treatment-induced hypertensive response on overall survival (OS) and to explore the effect of baseline antihypertensive treatment on OS in a cohort of patients treated outside of a clinical trial setting.
Materials and methods
Cases were identified using the electronic medical record (EMR) used by Partners HealthCare, an integrated health care delivery network in eastern Massachusetts. Case selection criteria were: initiation of any one of six Food and Drug Administration (FDA)-approved anti-VEGF therapies (sunitinib, sorafenib, pazopanib, axitinib, regorafenib or vandetanib), no previous anti-VEGF therapies treatment, age >18 years, receiving care from a clinician at Partners HealthCare, and at least one follow-up visit during anti-VEGF therapies therapy. Cases were excluded if the anti-VEGF therapy was stopped less than seven days after initiation, if the subject had any prior exposure to anti-VEGF therapies.
Eligible cases were identified using a search in the EMR, from which all relevant data was extracted, including the patient’s demographic information, diagnoses, medications and vital signs. The patient’s charts were manually reviewed to confirm the cancer diagnosis and the initiation date of the anti-VEGF therapies, and to obtain missing data.
The study was approved by the Institutional Review Board of Partners HealthCare.
Definition of outcomes
Our primary aims were to test pre-existing hypertension as a risk factor for the development of a treatment-induced hypertensive response, and whether a treatment-induced hypertensive response predicts survival. We defined pre-existing hypertension based on the presence of at least one of the following criteria at any point prior to the date of initiation of the anti-VEGF therapy: (1) hypertension listed as a new diagnosis in the EMR, (2) at least one antihypertensive medication prescription, (3) systolic blood pressure (BP) ≥160 mmHg or diastolic BP ≥100 mmHg (to align with version 4.0 of the CTCAE and Joint National Committee on Prevention, Detection, Evaluation, and Treatment of High Blood Pressure (JNC) 7).13, 14 The primary outcome was evidence of a treatment-induced hypertensive response (follow-up was until the first anti-VEGF therapy was stopped or changed to another anti-VEGF therapy). In those without pre-existing hypertension, a treatment-induced hypertensive response was defined as the occurrence of any of the above three criteria during the time period that the patient was taking anti-VEGF therapy. In patients with pre-existing hypertension, the treatment-induced hypertensive response was defined as having one or both of the following criteria while taking anti-VEGF therapy: (1) dose increase of a prior antihypertensive medication or/and addition of a new antihypertensive medication (2) systolic BP ≥160 mmHg or diastolic BP ≥100 mmHg (grade 3 or higher in CTCAE v4.0).14 Classes of antihypertensive medications included in the study included beta blockers, calcium channel blockers, angiotensin-converting enzyme inhibitors (ACEis), angiotensin receptor blockers (ARBs), mineralocorticoid antagonists, and diuretics; the loop diuretic furosemide was excluded as it is frequently prescribed for management of edema. BP response to anti-VEGF therapy was calculated as the difference in the maximal BP recorded and the baseline BP.
Statistical analysis
Continuous variables were graphically reviewed for normality and transformed if needed. Summary statistics obtained include mean and standard deviation for continuous normally distributed values; median, 25th / 75th percentile for non-normal continuous variables; and number and percent of population at risk for categorical variables. Age was dichotomized (age above or below 60 years), as was BMI (above or below 25 kg/m2).
To evaluate clinical risk factors for the development of hypertension, logistic regression was used with the candidate risk factor as a predictor, both in univariate analysis and then in multivariable analysis. Potential confounders that were included were age, gender and race, as well as any variable that had a p-value less than 0.15 on univariate analysis. Odds ratios and 95% confidence intervals (CI) are presented. Sensitivity analyses included comparing those who developed the adverse BP response to those who did not using t-tests for continuous variables and Pearson’s χ2 test or Fisher’s exact test for categorical variables, modeling time to development of hypertension using a Cox proportional hazard model, and modeling the change in BP in a linear regression model.
OS was estimated using the Kaplan-Meier method, and a log-rank test was used to compare patient groups. The influence of baseline characteristics on survival was evaluated using a Cox proportional hazards model. The onset or worsening of hypertension was considered a time-dependent covariate. Each factor was studied in a univariate model, and then included in a multivariable model where age, sex and race were included by default, as well as factors with a p-value below 0.15 in univariate analysis.
As there were two primary outcomes, a Bonferroni-corrected two-sided p-value <0.025 was considered statistically significant. For the exploratory outcomes, a two-sided p-value <0.05 was used, with no adjustment for multiple comparisons. SAS version 9.3 (SAS, Cary, NC) was used for all analyses.
Results
Study population characteristics
The initial EMR query yielded 1775 potential patients. After manual review, 655 cases were excluded (Figure 1), leaving 1120 participants for analysis. Baseline characteristics are shown in Table 1. The majority of patients were male (62%) and Caucasian (89.5%). The cancer diagnoses were combined into five groups: RCC (32.2%), HCC (11.6%), gastrointestinal stromal tumors (GIST; 12.5%), non-GIST sarcomas (15.3%), and other cancers (28.4%); all had unresectable or metastatic disease. Table 2 describes the hypertension characteristics among patients; 65% had baseline hypertension. Patients with RCC and HCC were more likely to have baseline hypertension than patients with GIST, sarcomas or other cancers (p=0.0003).
Figure 1.

Flow diagram of patients taking part of study.
Table 1.
Description of population
| Variable | Mean±SD, median [Q1, Q3] or n (%) | Range |
|---|---|---|
| Total | 1120 | |
| Age (years) | 60.5±13.4 | 19.0–92.4 |
| Age ≥ 60 years | 609 (54.4) | |
| Male gender | 694 (62.0) | |
| Race | ||
| White | 1002 (89.5) | |
| Black | 34 (3.0) | |
| Other or unknown | 84 (7.5) | |
| Time on anti-VEGF therapy (months) | 4.3 [1.8, 10.5] | 0.3–114.6 |
| Follow-up time (months) | 10.7 [4.5, 25.2] | 0.3–127.0 |
| Baseline vitals | ||
| Systolic BP (mmHg) | 126.9±17.4 | 80–190 |
| Diastolic BP (mmHg) | 74.6±10.7 | 38–124 |
| Pulse (beats/min) | 80.7±16.7 | 40–140 |
| BMI (kg/m2) | 28.0±6.3 | 14.5–62.3 |
| BMI ≥25 kg/m2 | 726 (64.8) | |
| Type of cancer | ||
| Renal cell carcinoma | 361 (32.2) | |
| Sarcomas (other than GIST) | 171 (15.3) | |
| GIST | 140 (12.5) | |
| Hepatocellular carcinoma | 130 (11.6) | |
| Other | 318 (28.4) | |
| Neuroendocrine tumors | 90 (8.0) | |
| Thyroid cancer | 74 (6.6) | |
| AML | 47 (4.2) | |
| Colorectal cancer | 22 (2.0) | |
| Primary CNS tumors | 16 (1.4) | |
| Other tumors | 69 (6.1) | |
| Anti-VEGF therapy prescribed | ||
| Sunitinib | 582 (52.0) | |
| Sorafenib | 290 (25.9) | |
| Pazopanib | 202 (18.0) | |
| Other | 46 (4.1) |
AML: Acute myeloid leukemia. BMI: Body mass index. BP: Blood pressure. CNS: Central nervous system. GIST: Gastrointestinal stromal tumor. Q1: First quartile. Q3: Third quartile. SD: Standard deviation. VSP: Vascular endothelial growth factor signaling pathway.
Table 2.
Description of baseline hypertension
| Variable | n (%)* |
|---|---|
| Pre-existing hypertension | 732 (65.4) |
| Hypertension criteria met | |
| Taking antihypertensive agent | 219 (29.9) |
| History of BP ≥160/100 mmHg | 70 (9.6) |
| Listed as diagnosis in medical record | 11 (1.5) |
| Multiple criteria | 432 (59.0) |
| Number of baseline antihypertensive agents | |
| 0 | 163 (22.3) |
| 1 | 258 (35.3) |
| 2 | 167 (22.8) |
| 3 | 89 (12.2) |
| 4 or more | 55 (7.5) |
| Distribution of baseline antihypertensive agents | |
| ACEis or ARBs | 304 (41.5) |
| Beta blockers | 333 (45.5) |
| Calcium channel blockers | 173 (23.6) |
| Diuretics | 134 (18.3) |
| Mineralocorticoid receptor antagonists | 31 (4.2) |
| Other | 38 (5.2) |
| Prevalence of baseline hypertension by cancer** | |
| Renal cell carcinoma | 259 (71.8) |
| GIST | 78 (55.7) |
| Sarcomas (other than GIST) | 105 (61.4) |
| Hepatocellular carcinoma | 97 (74.6) |
| Other | 194 (61.0) |
ACEi: Angiotensin-converting enzyme inhibitor. ARB: Angiotensin receptor blocker. BP: Blood pressure. GIST: Gastrointestinal stromal tumor.
Percentages refer to percentage of the hypertensive population (n=732) except for pre-existing hypertension (percentage of total population, n=1120) and risk of baseline hypertension by cancer (percentage of patients with each cancer, n=variable).
p=0.0003
Predictors of hypertension
As shown in Figure 2, there was a rapid and significant increase in mean BP following initiation of anti-VEGF therapy. Table 3 describes the observed changes in BP after anti-VEGF therapy initiation. The mean of the maximal increase in BP was 21 and 15 mmHg for systolic and diastolic BP respectively, with no significant difference based on pre-existing hypertension status. However, more patients with pre-existing hypertension achieved the primary outcome of an adverse hypertensive response (55%, vs. 40% of patients with no pre-existing hypertension). The median time to first documented development of the adverse hypertensive response was 29 days. Although BP medication intensification of only one medication was most common (n=161, 14.4%), a substantial proportion of patients required a dose increase in two or more (n=77, 6.9%) medications or the addition of two or more (n=167, 15.0%) new antihypertensive medications. ACEis / ARBs (n=133, 30.4%) and calcium channel blockers (n=104, 23.7%) were the most commonly used agents. Of note, 54 patients had a BP ≥160/100 mmHg prior to anti-VEGF therapy initiation; 12 of these had a persistent BP above 160/100 mmHg after anti-VEGF therapy initiation and thus were counted as individuals with worsening hypertension. In all but two of these patients, there was an increase in BP with anti-VEGF therapy initiation.
Figure 2.
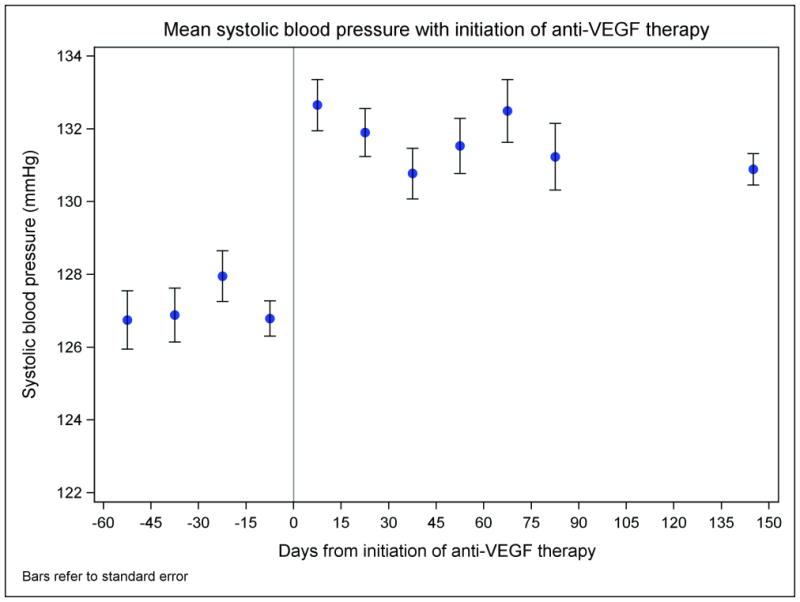
Mean blood pressure before and after initiation of anti-VEGF therapy. The mean blood pressures are calculated in 15-day intervals and represented in the middle of each interval (the last time interval extends from 90 days to 200 days after initiation of anti-VEGF therapy due to fewer blood pressure readings at that point). Bars refer to standard errors.
Table 3.
Description of the treatment-induced blood pressure response
| Mean±SD, median [Q1, Q3] or n (%) | Range | |
|---|---|---|
| Change in systolic BP (mmHg) | 20.9±19.4 | −78–104 |
| Change in diastolic BP (mmHg) | 14.5±11.6 | −54–78 |
| Time until maximal systolic BP measured (days) | 44 [19–108] | 1–2185 |
| Time until maximal diastolic BP measured (days) | 43 [29–105] | 1–2133 |
| Treatment-induced hypertensive response | 557 (49.7) | |
| Time to development of adverse BP response (days) | 29 [14, 68] | 1–1872 |
| Treatment-induced hypertensive response in patients with no pre- existing hypertension (n=388) | 154 (39.8) | |
| Criteria met: | n (% of patients without pre-existing hypertension who developed a treatment-induced hypertensive response) | |
| Added as diagnosis in medical record | 5 (3.2) | |
| Antihypertensive agent started | 50 (32.5) | |
| BP reading ≥160/100 mmHg | 26 (16.8) | |
| Multiple criteria | 73 (47.1) | |
| Treatment-induced hypertensive response in patients with pre-existing hypertension (n=732) | 403 (55.1) | |
| Criteria met: | n (% of patients with pre-existing hypertension who developed a treatment-induced hypertensive response) | |
| Antihypertensive agent added or dose intensified | 130 (32.3) | |
| BP reading ≥160/100 mmHg | 84 (20.8) | |
| Both criteria | 189 (46.9) | |
| Number of medications added | n (% of all patients) | |
| 1 | 211 (18.8) | |
| 2 | 103 (9.2) | |
| 3 | 35 (3.1) | |
| 4 or more | 29 (2.6) | |
| Number of dose increases | n (% of all patients) | |
| 1 | 161 (14.4) | |
| 2 | 39 (3.5) | |
| 3 | 26 (2.3) | |
| 4 or more | 12 (1.1) | |
| Number of dose reductions | n (% of all patients) | |
| 1 | 70 (6.3) | |
| 2 or more | 24 (2.1) | |
| Class of first medication started / intensified | n (% of all medication intensifications) | |
| ACEis or ARBs | 133 (30.4) | |
| Beta blockers | 78 (17.8) | |
| Calcium channel blockers | 104 (23.7) | |
| Diuretics | 29 (6.6) | |
| Mineralocorticoid receptor antagonists | 14 (3.2) | |
| Others | 9 (2.1) | |
| Multiple | 71 (16.2) | |
ACEi: Angiotensin-converting enzyme inhibitor. ARB: Angiotensin receptor blocker. BP: Blood pressure. GIST: Gastrointestinal stromal tumor. Q1: First quartile. Q3: Third quartile. SD: Standard deviation. VSP: Vascular endothelial growth factor signaling pathway.
Table 4 shows the results of both unadjusted and adjusted analyses of potential predictors of the development of the treatment-induced hypertensive response. The primary adjusted analysis found that pre-existing hypertension (OR 1.56, 95%CI 1.27–1.92) was a risk factor. In exploratory analyses, age above 60 years (OR 1.26, 95%CI 1.06–1.52) and BMI above 25 kg/m2 (OR 1.26, 95%CI 1.04–1.53) were additional independent risk factors. These identify a population at high risk for the development of treatment-associated HTN; Table 5 shows the risk by number of risk factors ranging from 31% if no risk factors to 62% in the presence of all three risk factors. Sensitivity analyses (not shown) were performed using BP above 140/90 mmHg to define baseline hypertension, using the change in blood pressure while on therapy as the outcome, and using the time to development of a hypertensive response. These analyses yielded similar results to those presented herein.
Table 4.
Predictors of the development of the treatment-induced hypertensive response
| Unadjusted analysis | Multivariable analysis* | |||||
|---|---|---|---|---|---|---|
| Variable | OR | 95% CI | p-value | OR | 95% CI | p-value |
| Primary analysis | ||||||
| Pre-existing hypertension | 1.84 | 1.43–2.36 | <0.0001 | 1.56 | 1.27–1.92 | <0.0001 |
| Secondary analyses | ||||||
| Age ≥60 years (high vs. low) | 1.53 | 1.21–1.94 | 0.0004 | 1.26 | 1.06–1.52 | 0.0110 |
| Male gender (vs. female) | 1.02 | 0.20–1.30 | 0.8788 | 0.85 | 0.71–1.02 | 0.0810 |
| Race (vs. white race) | 0.7765 | 0.3095 | ||||
| White | 1.00 | 1.00 | ||||
| Black | 0.79 | 0.40–1.58 | 0.5081 | 1.32 | 0.79–2.22 | 0.2953 |
| Other or unknown | 1.05 | 0.68–1.64 | 0.8203 | 1.21 | 0.88–1.68 | 0.2421 |
| BMI ≥25 kg/m2 (high vs. low) | 1.83 | 1.43–2.35 | <0.0001 | 1.26 | 1.04–1.53 | 0.0187 |
| Type of cancer (vs. renal cell carcinoma) | 0.0016 | 0.1389 | ||||
| Renal cell carcinoma | 1.00 | 1.00 | ||||
| Sarcomas (other than GIST) | 0.75 | 0.57–0.98 | 0.0373 | 0.89 | 0.66–1.18 | 0.4149 |
| GIST | 0.72 | 0.55–0.93 | 0.0122 | 0.79 | 0.60–1.04 | 0.0912 |
| Hepatocellular carcinoma | 0.94 | 0.71–1.24 | 0.6425 | 0.91 | 0.68–1.20 | 0.4836 |
| Other | 0.66 | 0.53–0.82 | 0.0002 | 0.75 | 0.60–0.94 | 0.0136 |
| Anti-VEGF therapy prescribed (vs. sunitinib) | 0.2216 | 0.5083 | ||||
| Sunitinib | 1.00 | 1.00 | ||||
| Sorafenib | 0.80 | 0.60–1.06 | 0.1140 | 1.08 | 0.82–1.41 | 0.5854 |
| Pazopanib | 1.04 | 0.75–1.43 | 0.8199 | 1.20 | 0.93–1.55 | 0.1645 |
| Others | 0.66 | 0.36–1.22 | 0.1835 | 1.21 | 0.74–1.97 | 0.4567 |
| Taking any antihypertensive agent at baseline | 1.51 | 1.19–1.91 | 0.0007 | 0.82 | 0.65–1.04 | 0.0991 |
| ACEis or ARBs | 1.65 | 1.27–2.16 | 0.0002 | 0.99 | 0.81–1.21 | 0.9078 |
| Beta blockers | 1.30 | 1.00–1.68 | 0.0487 | 0.90 | 0.74–1.10 | 0.2967 |
| Calcium channel blockers | 1.38 | 1.00–1.92 | 0.0515 | 1.00 | 1.80–1.26 | 0.7588 |
| Diuretics | 1.75 | 1.21–2.54 | 0.0030 | 0.99 | 0.77–1.27 | 0.9317 |
| Mineralocorticoid receptor antagonists | 0.63 | 0.30–1.31 | 0.2133 | 0.56 | 0.31–1.02 | 0.0549 |
| Other | 1.76 | 0.90–3.44 | 0.0984 | 1.12 | 0.74–1.71 | 0.5906 |
ACEi: Angiotensin-converting enzyme inhibitor. ARB: Angiotensin receptor blocker. BMI: Body mass index. BP: Blood pressure. CI: Confidence interval. GIST: Gastrointestinal stromal tumor. OR: Odds ratio. VSP: Vascular endothelial growth factor signaling pathway.
Model includes age (continuous), gender, race, BMI (continuous), type of cancer, and pre-existing hypertension.
Table 5.
Risk of development of hypertension during treatment with anti-VEGF therapies
| Risk factor | Risk of hypertension |
|---|---|
| No risk factors | 31% |
| One risk factors | 41% |
| Two risk factors | 51% |
| All three risk factors | 62% |
Risk factors are age above 60 years, body mass index above 25 kg/m2, and a history of pre-existing hypertension. VSP: Vascular endothelial growth factor signaling pathway.
Predictors of overall survival
Median OS in the overall population was 17.4 months. There was a survival advantage in patients who developed hypertension while on anti-VEGF therapy; the unadjusted OS was 25.6 months in those who developed hypertension vs. 11.2 months in those who did not develop hypertension (Table 6; adjusted HR 0.76, 95%CI 0.65–0.89). The persisted when analyzing only those individuals with cancers other than RCC (n=732, HR=0.76, 95%CI 0.63–0.92, p=0.0066). Exploratory analyses revealed a higher hazard of death in patients older than 60 years (unadjusted median OS was 15.2 months vs. 21.5 months in younger patients; adjusted HR 1.27, 95%CI 1.08–1.49, p=0.0035) and in patients with cancers other than RCC and GIST (unadjusted median OS 23.3 months for RCC, 34.6 months for GIST, 11.8 months for sarcomas other than GIST, 8.2 months for HCC, and 15.4 months for other cancers). A lower hazard of death was observed in patients with BMI>25 kg/m2 (unadjusted median OS 22.5 months vs. 11.4 months in patients with lower BMI, adjusted HR 0.66, 95%CI 0.56–0.77). We did not detect a survival advantage in patients treated with agents that affect the renin-angiotensin-aldosterone system (n=304) vs. other antihypertensive agents, whether in the overall population or in patients with RCC (n=109). The lack of association persisted in sensitivity analysis using BP of 140/90 mmHg as a cut-off for hypertension.10
Table 6.
Predictors of survival
| Unadjusted analysis | Multivariable analysis* | |||||
|---|---|---|---|---|---|---|
| Variable | HR | 95% CI | p-value | HR | 95% CI | p-value |
| Primary analysis | ||||||
| Primary BP outcome (adverse BP response) | 0.76 | 0.65–0.88 | 0.0004 | 0.76 | 0.65–0.89 | 0.0007 |
| Exploratory analyses | ||||||
| Age ≥60 years (high vs. low) | 1.21 | 1.04–1.41 | 0.0161 | 1.27 | 1.08–1.49 | 0.0035 |
| Male gender (vs. female) | 1.02 | 0.87–1.19 | 0.8427 | 0.96 | 0.81–1.14 | 0.6322 |
| Race (vs. white race) | 0.3092 | 0.1254 | ||||
| White | 1.00 | 1.00 | ||||
| Black | 1.34 | 0.89–2.02 | 0.1599 | 1.37 | 0.91–2.07 | 0.1524 |
| Other or unknown | 0.92 | 0.69–1.24 | 0.5913 | 0.82 | 0.60–1.11 | 0.1941 |
| BMI ≥25 kg/m2 (high vs. low) | 0.71 | 0.60–0.82 | <0.0001 | 0.66 | 0.56–0.77 | <0.0001 |
| Type of cancer (vs. renal cell carcinoma) | <0.0001 | <0.0001 | ||||
| Renal cell carcinoma | 1.00 | 1.00 | ||||
| Sarcomas (other than GIST) | 1.84 | 1.45–2.35 | <0.0001 | 1.42 | 1.14–1.76 | <0.0001 |
| GIST | 0.76 | 0.59–0.98 | 0.0368 | 0.79 | 0.60–1.03 | 0.0800 |
| Hepatocellular carcinoma | 2.15 | 1.68–2.75 | <0.0001 | 1.95 | 1.48–2.57 | <0.0001 |
| Other | 1.44 | 1.18–1.76 | 0.0003 | 1.42 | 1.14–1.76 | 0.0020 |
| Anti-VEGF therapy prescribed (vs. sunitinib) | <0.0001 | 0.8407 | ||||
| Sunitinib | 1.00 | 1.00 | ||||
| Sorafenib | 1.54 | 1.30–1.84 | <0.0001 | 1.11 | 0.89–1.38 | 0.3677 |
| Pazopanib | 1.26 | 0.99–1.60 | 0.0510 | 1.01 | 0.78–1.32 | 0.9585 |
| Others | 1.29 | 0.80–2.07 | 0.2965 | 1.02 | 0.62–1.66 | 0.9537 |
| Pre-existing hypertension | 1.12 | 0.95–1.31 | 0.1714 | 1.13 | 0.95–1.35 | 0.1780 |
| Taking any antihypertensive agent at baseline | 1.07 | 0.92–1.24 | 0.4031 | 1.03 | 0.87–1.22 | 0.7401 |
| ACEis or ARBs | 0.92 | 0.77–1.10 | 0.3678 | 0.89 | 0.73–1.07 | 0.2018 |
| Betablockers | 1.08 | 0.91–1.27 | 0.3935 | 1.01 | 0.85–1.20 | 0.9190 |
| Calcium channel blockers | 1.07 | 0.86–1.32 | 0.5498 | 1.05 | 0.84–1.30 | 0.6923 |
| Diuretics | 0.82 | 0.65–1.04 | 0.1044 | 0.85 | 0.67–1.09 | 0.2050 |
| Mineralocorticoid receptor antagonists | 0.97 | 0.60–1.57 | 0.8979 | 0.71 | 0.43–1.17 | 0.1807 |
| Other | 0.88 | 0.56–1.37 | 0.5674 | 0.89 | 0.57–1.41 | 0.6277 |
ACEi: Angiotensin-converting enzyme inhibitor. ARB: Angiotensin receptor blocker. BMI: Body mass index. BP: Blood pressure. CI: Confidence interval. OR: Odds ratio. GIST: Gastrointestinal stromal tumor. VSP: Vascular endothelial growth factor signaling pathway.
Model includes age (continuous), gender, race, BMI (continuous), type of cancer, and type of anti-VEGF therapy.
Discussion
We describe herein the burden of hypertension in patients receiving anti-VEGF therapies for their cancer in a large real-world dataset that includes many types of malignancies; our data should thus be generally applicable to other clinical settings. We found that close to 50% of patients experienced worsening of BP. We also describe risk factors for the development of a treatment-induced hypertensive response: pre-existing hypertension, age ≥60 years, and BMI ≥25 kg/m2. Finally, we show the association between increasing blood pressure and improved survival.
The rate of treatment-induced hypertensive response was higher than that observed in other studies.2–6, 15 There are several potential reasons for this. First, the definition of hypertension has evolved. Earlier studies frequently reported hypertension based on the CTCAE v3.0, which defined grade 3 hypertension as blood pressure requiring more than one drug or more intensive therapy than previously. This is different from the newer CTCAE v4.0 and JNC7 definitions, which define grade 3 hypertension (or stage 2 hypertension) as systolic BP ≥160 mmHg or diastolic BP ≥100 mmHg, generally requiring medical intervention.13, 14 Second, prior reports have been largely based on data from randomized controlled trials, where patients are required to have controlled BP prior to initiation of therapy and may differ from the population in whom the medications are used after approval. 16 Finally, awareness of a treatment-induced hypertensive response to anti-VEGF therapy has increased over time. Hence, clinicians may be more vigilant in monitoring patients and be more likely to intensify therapy and follow the patients closely when BP elevation develops.
In the present analysis, the mean increase in BP from baseline to the maximal BP reading was 21 and 15 mmHg for systolic and diastolic BP respectively. We, like others, found that this increase occurs rapidly;17, 18 as shown in Figure 2, the difference could be seen within the first 15-day period after anti-VEGF therapy initiation. The blood pressure increased equally in those with and without pre-existing hypertension; as the former group has a higher baseline blood pressure, it is not surprising that pre-existing hypertension emerged as a risk factor for the development of a hypertensive response while on therapy. In view of the large mean increase in BP, one reasonable approach to avoid clinically significant hypertension and the acute complications thereof is to adequately control hypertension to <140/90 mmHg before starting a anti-VEGF therapy.
Our study also identified age and BMI as risk factors; the increase in BP with age was not observed in prior reports,19 but our study confirms a previous report that demonstrated an association between adverse BP response and increasing BMI.19 It is unlikely that differences in drug exposure account for the difference in risk, as age and weight have only minimal influence on drug exposure and anti-VEGF therapy dosages are not weight-based.20 Although the findings persist after correcting for potential confounders, it is possible that our findings represent residual confounding. While the reason for the increased risk observed in these groups remains unclear, the findings remain clinically relevant: clinicians should be aware of the higher risk of treatment-induced hypertension in patients with pre-existing hypertension as well as in patients with increasing age and increasing BMI, regardless of baseline hypertension status.
We did not find RCC to be a risk factor for the treatment-induced hypertensive response, although these patients did have a higher baseline prevalence of BP. The same findings have been reported in some,2, 5 but not all,6, 15 studies. The higher rates of baseline hypertension observed in patients with RCC may be due to hypertension being a risk factor for RCC21 as well as reflecting local tumor effects and renal dysfunction after nephrectomy.22
The OS in our study is consistent with the OS reported in prior studies.23–25 The predictors of improved survival that we identified (treatment-induced hypertension, lower age, higher BMI, and RCC/GIST) have been described in some, but not all, prior studies. The association between the development of hypertension and survival in metastatic RCC has been described previously.10, 11 In terms of advanced age, it was reported to be associated with reduced survival for RCC,26 but not for GIST in a smaller study.27 Higher BMI has been described as a protective factor in prior studies in RCC, even after adjusting for stage, tumor size, and grade.28 A potential explanation is differential expression of the fatty acid synthase gene, shown to be important in tumor physiology.29 Also, lower BMI may be a marker of weight loss or cachexia from tumor progression. We did not find a survival advantage with baseline use of ACEis or ARBs, as has been found in prior studies.30, 31 This may be related to a smaller sample size in our study than in prior studies and hence inadequate power. This is especially true if the beneficial effect of these antihypertensive agents is restricted to RCC only, as this study only included 361 such patients.
This study, to our knowledge, is the largest study evaluating risk factors for the development of hypertension in a variety of cancer patients receiving anti-VEGF therapies. It is also the largest study looking at survival and hypertension using “real-world” data, applicable to other clinical settings. Limitations include the retrospective nature and the electronic capture of data, which may be associated with inaccuracies. An EMR diagnosis of hypertension may be erroneous, and antihypertensive medications are prescribed for purposes other than blood pressure control. However, this would have biased our study towards the null. We also lacked complete data on prognostic markers, such as performance score, tumor stage and grade, cancer progression, and prior therapies, and thus could not correct for these.
Nevertheless, the results of our study should encourage clinicians to pay particular attention to BP in the first month after starting anti-VEGF therapies in high-risk patients, including patients ≥60 years old and/or with a BMI of ≥25 kg/m2. Finally, further studies are needed to elucidate the mechanism of hypertension with these agents, which may provide clues to the vascular biology underlying human hypertension.
Acknowledgments
Funding sources:
This work was conducted with support from Harvard Catalyst | The Harvard Clinical and Translational Science Center (National Center for Research Resources and the National Center for Advancing Translational Sciences, National Institutes of Health Award 1UL1 TR001102-01 and financial contributions from Harvard University and its affiliated academic healthcare centers, as well as the Trust Family and Michael Brigham funds for Kidney Cancer Research (TKC).
Footnotes
The content is solely the responsibility of the authors and does not necessarily represent the official views of Harvard Catalyst, Harvard University and its affiliated academic health care centers, or the National Institutes of Health.
The other authors report no financial disclosures.
Financial disclosures:
Dr. Choueiri reports receiving research support from Pfizer, and serving as a compensated member of advisory boards/consulting for Pfizer, GSK, Novartis, Bayer, and AVEO the past 2 years.
Dr. Williams reports receiving research support from DiaSorin, Novartis, and Otsuka.
Dr. Turchin reports receiving research support from Merck and serving as a compensated member of advisory boards for Monarch Medical Technologies.
References
- 1.Meadows KL, Hurwitz HI. Anti-VEGF therapies in the clinic. Cold Spring Harb Perspect Med. 2012:2. doi: 10.1101/cshperspect.a006577. [DOI] [PMC free article] [PubMed] [Google Scholar]
- 2.Wu S, Chen JJ, Kudelka A, Lu J, Zhu X. Incidence and risk of hypertension with sorafenib in patients with cancer: a systematic review and meta-analysis. Lancet Oncol. 2008;9:117–123. doi: 10.1016/S1470-2045(08)70003-2. [DOI] [PubMed] [Google Scholar]
- 3.Zhu X, Stergiopoulos K, Wu S. Risk of hypertension and renal dysfunction with an angiogenesis inhibitor sunitinib: systematic review and meta-analysis. Acta Oncol. 2009;48:9–17. doi: 10.1080/02841860802314720. [DOI] [PubMed] [Google Scholar]
- 4.Qi WX, Shen Z, Lin F, et al. Incidence and risk of hypertension with vandetanib in cancer patients: a systematic review and meta-analysis of clinical trials. Br J Clin Pharmacol. 2013;75:919–930. doi: 10.1111/j.1365-2125.2012.04417.x. [DOI] [PMC free article] [PubMed] [Google Scholar]
- 5.Qi WX, Lin F, Sun YJ, et al. Incidence and risk of hypertension with pazopanib in patients with cancer: a meta-analysis. Cancer Chemother Pharmacol. 2013;71:431–439. doi: 10.1007/s00280-012-2025-5. [DOI] [PubMed] [Google Scholar]
- 6.Qi WX, He AN, Shen Z, Yao Y. Incidence and risk of hypertension with a novel multi-targeted kinase inhibitor axitinib in cancer patients: a systematic review and meta-analysis. Br J Clin Pharmacol. 2013;76:348–357. doi: 10.1111/bcp.12149. [DOI] [PMC free article] [PubMed] [Google Scholar]
- 7.Caro J, Morales E, Gutierrez E, Ruilope LM, Praga M. Malignant hypertension in patients treated with vascular endothelial growth factor inhibitors. J Clin Hypertens (Greenwich) 2013;15:215–216. doi: 10.1111/jch.12052. [DOI] [PMC free article] [PubMed] [Google Scholar]
- 8.Tlemsani C, Mir O, Boudou-Rouquette P, et al. Posterior reversible encephalopathy syndrome induced by anti-VEGF agents. Target Oncol. 2011;6:253–258. doi: 10.1007/s11523-011-0201-x. [DOI] [PubMed] [Google Scholar]
- 9.Bair SM, Choueiri TK, Moslehi J. Cardiovascular complications associated with novel angiogenesis inhibitors: emerging evidence and evolving perspectives. Trends Cardiovasc Med. 2013;23:104–113. doi: 10.1016/j.tcm.2012.09.008. [DOI] [PMC free article] [PubMed] [Google Scholar]
- 10.Rini BI, Cohen DP, Lu DR, et al. Hypertension as a biomarker of efficacy in patients with metastatic renal cell carcinoma treated with sunitinib. J Natl Cancer Inst. 2011;103:763–773. doi: 10.1093/jnci/djr128. [DOI] [PMC free article] [PubMed] [Google Scholar]
- 11.Rini BI, Schiller JH, Fruehauf JP, et al. Diastolic blood pressure as a biomarker of axitinib efficacy in solid tumors. Clin Cancer Res. 2011;17:3841–3849. doi: 10.1158/1078-0432.CCR-10-2806. [DOI] [PubMed] [Google Scholar]
- 12.Kim JJ, Vaziri SA, Rini BI, et al. Association of VEGF and VEGFR2 single nucleotide polymorphisms with hypertension and clinical outcome in metastatic clear cell renal cell carcinoma patients treated with sunitinib. Cancer. 2012;118:1946–1954. doi: 10.1002/cncr.26491. [DOI] [PMC free article] [PubMed] [Google Scholar]
- 13.Chobanian AV, Bakris GL, Black HR, et al. The Seventh Report of the Joint National Committee on Prevention, Detection, Evaluation, and Treatment of High Blood Pressure: the JNC 7 report. JAMA. 2003;289:2560–2572. doi: 10.1001/jama.289.19.2560. [DOI] [PubMed] [Google Scholar]
- 14.National Cancer Institute. Common Terminology Criteria for Adverse Events v4.0: NCI, NIH, DHHS. May 29, 2009. [Google Scholar]
- 15.Funakoshi T, Latif A, Galsky MD. Risk of hypertension in cancer patients treated with sorafenib: an updated systematic review and meta-analysis. J Hum Hypertens. 2013;27:601–611. doi: 10.1038/jhh.2013.30. [DOI] [PubMed] [Google Scholar]
- 16.Martin K, Begaud B, Latry P, Miremont-Salame G, Fourrier A, Moore N. Differences between clinical trials and postmarketing use. Br J Clin Pharmacol. 2004;57:86–92. doi: 10.1046/j.1365-2125.2003.01953.x. [DOI] [PMC free article] [PubMed] [Google Scholar]
- 17.Langenberg MH, van Herpen CM, De Bono J, et al. Effective strategies for management of hypertension after vascular endothelial growth factor signaling inhibition therapy: results from a phase II randomized, factorial, double-blind study of Cediranib in patients with advanced solid tumors. J Clin Oncol. 2009;27:6152–6159. doi: 10.1200/JCO.2009.22.2273. [DOI] [PubMed] [Google Scholar]
- 18.Maitland ML, Kasza KE, Karrison T, et al. Ambulatory monitoring detects sorafenib-induced blood pressure elevations on the first day of treatment. Clin Cancer Res. 2009;15:6250–6257. doi: 10.1158/1078-0432.CCR-09-0058. [DOI] [PMC free article] [PubMed] [Google Scholar]
- 19.Neiman V, Gottfried M, Hammers HJ, et al. Clinicopathologic factors associated with the development of sunitinib induced hypertension (HTN) in patients (pts) with metastatic renal cell carcinoma (mRCC) J Clin Oncol. 2014;32(suppl 4):abstr 508. [Google Scholar]
- 20.Houk BE, Bello CL, Kang D, Amantea M. A population pharmacokinetic meta-analysis of sunitinib malate (SU11248) and its primary metabolite (SU12662) in healthy volunteers and oncology patients. Clin Cancer Res. 2009;15:2497–2506. doi: 10.1158/1078-0432.CCR-08-1893. [DOI] [PubMed] [Google Scholar]
- 21.Choi MY, Jee SH, Sull JW, Nam CM. The effect of hypertension on the risk for kidney cancer in Korean men. Kidney Int. 2005;67:647–652. doi: 10.1111/j.1523-1755.2005.67137.x. [DOI] [PubMed] [Google Scholar]
- 22.Klarenbach S, Moore RB, Chapman DW, Dong J, Braam B. Adverse renal outcomes in subjects undergoing nephrectomy for renal tumors: a population-based analysis. Eur Urol. 2011;59:333–339. doi: 10.1016/j.eururo.2010.11.013. [DOI] [PubMed] [Google Scholar]
- 23.Llovet JM, Ricci S, Mazzaferro V, et al. Sorafenib in advanced hepatocellular carcinoma. N Engl J Med. 2008;359:378–390. doi: 10.1056/NEJMoa0708857. [DOI] [PubMed] [Google Scholar]
- 24.Motzer RJ, Hutson TE, Tomczak P, et al. Overall survival and updated results for sunitinib compared with interferon alfa in patients with metastatic renal cell carcinoma. J Clin Oncol. 2009;27:3584–3590. doi: 10.1200/JCO.2008.20.1293. [DOI] [PMC free article] [PubMed] [Google Scholar]
- 25.Demetri GD, van Oosterom AT, Garrett CR, et al. Efficacy and safety of sunitinib in patients with advanced gastrointestinal stromal tumour after failure of imatinib: a randomised controlled trial. Lancet. 2006;368:1329–1338. doi: 10.1016/S0140-6736(06)69446-4. [DOI] [PubMed] [Google Scholar]
- 26.Verhoest G, Veillard D, Guille F, et al. Relationship between age at diagnosis and clinicopathologic features of renal cell carcinoma. Eur Urol. 2007;51:1298–1304. doi: 10.1016/j.eururo.2006.11.056. discussion 1304–1295. [DOI] [PubMed] [Google Scholar]
- 27.Tham CK, Poon DY, Li HH, Tan MH, Choo SP, Foo KF. Gastrointestinal stromal tumour in the elderly. Crit Rev Oncol Hematol. 2009;70:256–261. doi: 10.1016/j.critrevonc.2008.09.007. [DOI] [PubMed] [Google Scholar]
- 28.Choi Y, Park B, Jeong BC, et al. Body mass index and survival in patients with renal cell carcinoma: a clinical-based cohort and meta-analysis. Int J Cancer. 2013;132:625–634. doi: 10.1002/ijc.27639. [DOI] [PubMed] [Google Scholar]
- 29.Hakimi AA, Furberg H, Zabor EC, et al. An epidemiologic and genomic investigation into the obesity paradox in renal cell carcinoma. J Natl Cancer Inst. 2013;105:1862–1870. doi: 10.1093/jnci/djt310. [DOI] [PMC free article] [PubMed] [Google Scholar]
- 30.Keizman D, Huang P, Eisenberger MA, et al. Angiotensin system inhibitors and outcome of sunitinib treatment in patients with metastatic renal cell carcinoma: a retrospective examination. Eur J Cancer. 2011;47:1955–1961. doi: 10.1016/j.ejca.2011.04.019. [DOI] [PMC free article] [PubMed] [Google Scholar]
- 31.McKay RR, Rodriguez GE, Lin X, Simantov R, Choueiri TK. Impact of angiotensin system inhibitors (ASI) on outcomes in patients (pts) with metastatic renal cell carcinoma (mRCC): Results from a pooled clinical trials database. J Clin Oncol. 2014;32(suppl 4):abstr 437. [Google Scholar]