

Abstract
Background
Youths with a family history of alcohol and other drug use disorders (FH+) are at a greater risk of developing substance use disorders than their peers with no such family histories (FH−), and this increased risk may be related to impaired maturation of forebrain circuitry. FH+ individuals have shown altered forebrain activity at rest and while performing cognitive tasks. However, it is not fully understood how forebrain activity is altered in FH+ individuals and ultimately how these alterations may contribute to substance use disorder risk.
Methods
In the present study, we tested 72 FH+ and 32 FH− youths performing a go/no-go task and examined activations in blocks with only go trials (Go Only), blocks with 50% go and 50% no go trials (Go/NoGo), and a contrast of those 2 blocks.
Results
FH+ youths had significantly greater cerebral activations in both the Go and Go/NoGo blocks than FH− youths in regions including the posterior cingulate/precuneus, bilateral middle/superior temporal gyrus, and medial superior frontal gyrus with no significant group differences in the subtraction between Go Only and Go/NoGo blocks. Additionally, FH+ youths had moderately slower reaction times on go trials in the Go Only blocks.
Conclusions
Our findings suggest that global activation increases in FH+ youths are modulated by FH density and are not specific to the inhibitory components of the task. This pattern of increased activations in FH+ youths may be at least partially due to impaired forebrain white matter development leading to greater activations/less efficient neural communication during task performance.
Keywords: Functional magnetic resonance imaging, family history, risk, go/no go, substance use
Introduction
Individuals with a family history of alcohol and other drug use disorders (FH+) are at increased risk for developing substance use disorders themselves compared to those without such histories (FH−) (Lieb et al., 2002, McCaul et al., 1990, Cotton, 1979). This risk is thought to be driven by behavioral and cognitive characteristics of “behavioral undercontrol” or “neurobehavioral disinhibition” consisting of increased sensation seeking and antisocial behaviors as well as deficits in executive functioning, impulse control, decision making, and attention (e.g., Stevens et al., 2003, Deckel, 1999, Corral et al., 2003, Acheson et al., 2011a, Acheson et al., 2011b, Lovallo et al., 2006, Tarter et al., 2003, Sher et al., 2004, Sher and Trull, 1994). Further, this increased risk may be at least partially driven by impaired or altered development of forebrain circuitry as FH+ youths and young adults appear to have impaired frontal white matter development (Herting et al., 2010, Acheson et al., 2014b, Acheson et al., 2014a) and show evidence of altered forebrain activity at both rest and while performing cognitive tasks (e.g., Schweinsburg et al., 2004, Acheson et al., 2009, Silveri et al., 2011, Heitzeg et al., 2010, Cservenka et al., 2012, Spadoni et al., 2008). However, it is not fully understood how forebrain activity is altered in FH+ individuals and ultimately how these alterations may contribute to substance use disorder risk.
The most common paradigm used in FH functional imaging studies has been the go/no-go task (Jamadar et al., 2012, Heitzeg et al., 2010, DeVito et al., 2013, Schweinsburg et al., 2004). Go/no-go tasks activate forebrain circuitry that regulates selective attention and inhibitory control by requiring subjects to selectively respond only to appropriate stimuli (“go” cues) and withhold responding to inappropriate stimuli (“no-go” cues) (Eagle et al., 2008). Previous FH studies investigating go/no go task activations only reported subtractions of activation maps for “no-go” from “go” trials in an effort to identify differences in inhibitory-related circuitry in FH+ and FH− individuals. Of these studies, three contrasted successfully inhibited no-go trials with go trials and found relatively increased forebrain activations in FH+ adolescents and adults (Jamadar et al., 2012, Heitzeg et al., 2010, DeVito et al., 2013), while a small sample study contrasting all (successfully inhibited and failed) no-go trials with go trials reported relatively decreased activations in FH+ adolescents (Schweinsburg et al., 2004). While interesting and important, these studies did not compare overall activations in FH+ and FH− individuals across all task conditions while performing the task. Given that reduced cerebral myelination is associated with increased BOLD activations (Burzynska et al., 2013, Zhu et al., 2013), FH+ youths may be expected to show increased forebrain activations generally while performing go/no go tasks since they appear to have forebrain white matter impairments (Herting et al., 2010, Acheson et al., 2014b, Acheson et al., 2014a). This is an important distinction as it would suggest more basic differences in FH+ individuals such as more globally decreased forebrain neural efficiency in FH+ individuals rather than differences limited to inhibitory circuitry functioning.
To address these issues, we examined go/no-go task performance in a large (N=104) sample of FH+ and FH− youths (ages 10–14) with no or very limited drug use histories. We have previously reported that these FH+ youths have impaired white matter integrity (Acheson et al., 2014a, Acheson et al., 2014b). We used a block design go/no go task and examined effects of FH status on activations in blocks with only go trials, blocks with 50% go and 50% no go trials, and a contrast of those 2 conditions. Next, we examined relationships between activity in regions showing significant group differences and the number of parents and grandparents with substance use disorders (FH density), a key risk factor for developing alcohol and other drug use disorders (Finn et al., 1990, Stoltenberg et al., 1998). We hypothesized FH+ youths would show greater forebrain activity under all task conditions than FH− youths and that these differences would be directly proportional to FH density.
Methods
Participants
Seventy two FH+ and 32 FH− youths (10 to 14 years old, average age= 12.9±1.0) were recruited from a cohort of 386 volunteers in an ongoing longitudinal study on adolescent development and substance use involvement (Ryan et al., Under Review). Exclusion criteria included: regular substance use (defined as substance use at least once per month for 6 consecutive months; Clark et al., 2005), positive urine test at time of screening, low IQ (< 70), or physical/developmental disabilities that would interfere with the ability to understand or complete study requirements. Oppositional Defiant Disorder, Conduct Disorder, ADHD, Dysthymia or Anxiety Disorders were not exclusionary for the FH+ group because these disorders are commonly co-morbid with substance use involvement (Iacono et al., 2008). The Institutional Review Board of The University of Texas Health Science Center at San Antonio approved the study procedures. Privacy was further protected by a Certificate of Confidentiality from the Department of Health and Human Services.
Family history of substance use disorders
Family history classification for the youth cohort was established using the Family History Assessment Module (Rice et al., 1995) based on parent report. All FH+ participants had at least a biological father with a past or present substance use disorder. Most FH+ youths (79%) had a father with an alcohol use disorder history, and 58% had a father with history of alcohol and other drug use disorders. Some FH+ youths (29%) had a biological mother with substance use disorder histories. Some (18%) had a mother with an alcohol use disorder history and 11% had a mother with history of alcohol and other drug use disorders. The most common other drug use disorders among parents were cannabis and stimulant use disorders. Family history was also examined to calculate a family history density score (FH density) by counting the number of biological parents and grandparents meeting lifetime criteria for substance use disorders. Affected grandparents had similar alcohol and other drug use disorder histories as affected parents. Scores ranged from 0 (FH− participants) to a possible 6 (FH+ participants with both parents and all grandparents affected).
Collection and Processing of Magnetic Resonance Imaging Data
Imaging was performed at the Research Imaging Institute, University of Texas Health Science Center at San Antonio. All imaging data were collected using a Siemens Tim Trio 3T MR system (Erlangen, Germany) equipped with a multichannel head coil using a protocol that combined functional magnetic resonance imaging (fMRI), diffusion tensor imaging (DTI) and magnetic resonance spectroscopy as described elsewhere (Wijtenburg et al., 2012). In short, fMRI was performed using a gradient-echo, echo-planar sequence, acquiring 43 continuous slices parallel to the anterior commissure-posterior commissure (AC–PC) plane (repetition time/echo time [TR/TE] = 3000/30 ms, 1.72 × 1.72 × 3.0 mm, and field of view [FOV] = 220 mm). For anatomical reference, a 3-D high resolution T1-weighted series was acquired (TR/TE = 2000/2.83 ms, flip angle = 13°, 0.8 × 0.8 × 0.8 mm, FOV = 256 mm) using an optimized protocol described previously (Kochunov et al., 2006).
Go/No-go Task
The go/no-go task is a standard fMRI task for probing selective attention and inhibition networks and the version used in this study has been used previously (Altshuler et al., 2005). This task consisted of 12 alternating 28-sec blocks of a go trials only (Go Only blocks) with blocks of 50% go trials and 50% no-go trials (Go/NoGo blocks). Each block was preceded by a 2 sec instruction. In the go condition, subjects were presented with a series of random letters and are instructed to respond for all letters. In the no-go condition, subjects are shown random letters 50% of the time and the letter “D” the remaining trials and are instructed to respond for each letter except for the letter “D”. Within all blocks (Go Only and Go/NoGo), stimulus presentation was .5 sec with an interstimulus interval of 1.5 sec. Primary dependent measures were go trial reaction times, omission errors (failure to respond on go trials) and commission errors (failure to inhibit responding on no go trials).
Analysis of fMRI Data
Analyses of fMRI data were performed A) to examine group differences in functional activation maps produced by the different task blocks and B) to examine effects of FH density on the functional activation maps. The fMRI data were preprocessed and analyzed using SPM8 (Wellcome Department of Imaging Neuroscience, London). Preprocessing consisted of slice timing correction, motion correction, spatial normalization, and spatial smoothing with an 8mm FHWM Gaussian filter. The first level analysis was performed to generate task versus baseline and between-task contrast maps for the second level analyses. Three contrast maps were generated for each subject a) Go Only blocks minus baseline, b) Go/NoGo blocks minus baseline and c) Go/NoGo blocks minus Go Only blocks. In the second-level analyses we first examined activation patterns in the Go/NoGo minus Go Only blocks contrast, in each group, using a one-sample t-test. Next, we performed analyses of between-group difference in the Go Only, Go/NoGo, and Go/NoGo minus Go Only blocks contrast maps using a voxel-wise two-sample t-test. The results of the second-level analyses were corrected for multiple comparisons by thresholding them at the cluster-level family-wise error (FWE) corrected p-value of 0.05 by using a voxelwise threshold of p < 0.001 and a cluster size of >280 voxels. These analyses were then replicated excluding participants with any DSM-IV disorders. Sex was not included in our final analyses because an exploratory FH by sex ANOVA found no significant main effects of sex or FH by sex interactions.
Finally, we examined effects of FH density on functional activations. This analysis was performed by extracting temporal trends from the volumes of interest (VOIs) of the inter-group difference in the Go Only and Go/NoGo blocks. The fMRI data were preprocessed and analyzed using SPM8 (Wellcome Department of Imaging Neuroscience, London). The first eigenvariate of a spherical volume (diameter= 8mm) centered at the coordinates of the peak activation in each region was extracted for all subjects. The first eigenvariate is a statistical construct, calculated using Principal Component Analysis of the time series across voxels within each cluster, that represents the weighted mean of the ROI data that results in the time series with maximum possible variance (Friston et al., 2006). In essence, this describes the most typical response across all voxels within the ROI for each subject. Pearson’s correlation analysis was used to study association between the eigenvariate for each VOI and FH density, and a Bonferroni correction was applied to the comparisons in each condition.
Results
Participant Characteristics
Demographic data are summarized in Table 1. The FH+ and FH− groups did not differ in age, race, or ethnicity or drug use. However FH+ participants had significantly lower IQ, socioeconomic status, more externalizing symptoms, and internalizing symptoms.
Table 1.
Demographics
| FH− (n=32) | FH+ (n=72) | |||
|---|---|---|---|---|
|
| ||||
| Mean | (SD) | Mean | (SD) | |
| Age | 12.9 | (1.1) | 12.9 | (1.0) |
| Wechsler Abbreviated Scale of Intelligence | 102.0 | (11.7) | 96.5 | (12.6)* |
| Four Factor Index of Socioeconomic Status | 42.9 | (10.0) | 34.8 | (12.9)* |
| CBCL Externalizing Problems | 1.9 | (2.3) | 7.4 | (7.6)* |
| CBCL Internalizing Problems | 2.9 | (4.0) | 6.7 | (6.4)* |
|
| ||||
| Number | (%) | Number | (%) | |
|
| ||||
| Gender | ||||
| Male | 18 | (56) | 35 | (49) |
| Female | 14 | (44) | 37 | (51) |
| Race | ||||
| African-American | 1 | (3) | 10 | (14) |
| Caucasian | 31 | (97) | 60 | (83) |
| Other | 0 | (0) | 2 | (3) |
| Ethnicity | ||||
| Hispanic/Latino | 28 | (88) | 56 | (78) |
| Non-Hispanic/Latino | 4 | (12) | 16 | (22) |
| Externalizing Disorders | ||||
| Attention Deficit Hyperactivity Disorder | 0 | (0) | 14 | (20) |
| Conduct Disorder | 0 | (0) | 3 | (4) |
| Oppositional Defiant Disorder | 0 | (0) | 7 | (10) |
| Internalizing Disorders | ||||
| Generalized Anxiety Disorder | 0 | (0) | 6 | (8) |
| Separation Anxiety Disorder | 0 | (0) | 1 | (1) |
| Specific Phobia | 0 | (0) | 4 | (6) |
| Lifetime alcohol & drug use (n. ever used) | ||||
| Alcohol | 1 | (3) | 5 | (7) |
| Marijuana | 0 | (0) | 3 | (4) |
| Tobacco | 1 | (3) | 1 | (3) |
| Other | 0 | (0) | 0 | (0) |
p<0.05
FH+= family history of substance use disorders (SUDs); FH−= no family history of SUDs; Wechsler Abbreviated Scale of Intelligence (WASI; PsychologicalCorporation, 1999); Four Factor Index of Socioeconomic Status (FFIS; Hollingshead, 1975); CBCL= Child Behavior Checklist (Achenbach, 2001).
Behavioral findings
Behavioral data are summarized in Table 2. FH+ youths had slower reaction times on go trials in the Go Only blocks. There were no significant group differences in omission errors on go trials in either the Go Only or Go/NoGo blocks or differences in commission errors on no go trials in the Go/NoGo blocks. The reaction time differences was no longer significant after excluding FH+ youths with DSM-IV disorders (n=28; p=.2). However the mean RT did not change, suggesting the loss of significance may be due to reduced power rather than FH+ youths with disorders driving the difference.
Table 2.
Performance on the Go/No Go task
| FH− | FH+ | p-value | |
|---|---|---|---|
| Go Trial Reaction Time (ms) | |||
| Go Only Condition | 363.50 (51.15) | 401.74 (138.67) | .043 |
| Go/NoGo Condition | 454.88 (43.52) | 475.85(109.39) | .165 |
| Accuracy | |||
| Omission errors/ Go Only Condition | 3.19 (3.21) | 4.56 (6.91) | .288 |
| Omission errors/ Go/NoGo Condition | 2.94 (3.45) | 3.54 (3.53) | .419 |
| Comission errors/ Go/NoGo Condition | 11.00 (5.47) | 11.43 (5.97) | .728 |
Entries show M ± SD
Imaging findings
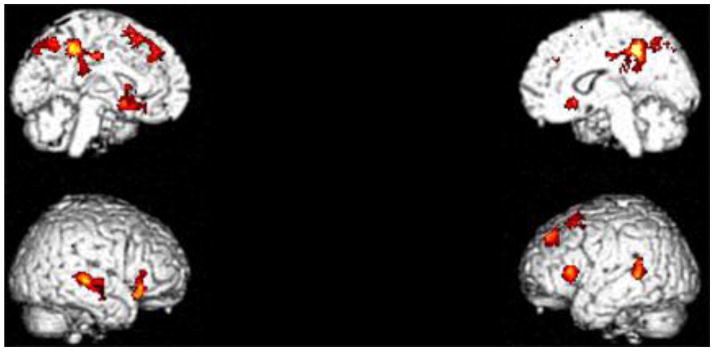
The Go/NoGo minus Go Only blocks contrast maps for each of the groups yielded significant activations (Figure 1). The pattern of activation was spatially similar in both groups. It included the supplementary motor area and anterior cingulated (BA 6/32), bilateral insula (BA 13/37), and right middle frontal gyrus (BA 10). In addition, the FH+ group had activations in middle occipital cortex (BA 18), and left cerebellum. The FH− group did not show activations in these areas and did not show any additional activations.
Figure 1.

Go/NoGo blocks minus Go Only blocks for both groups.
Red: FH−; Green: FH+; Yellow: Both groups. Cluster-level FWE corrected p <0.05.
Between-Group Analyses
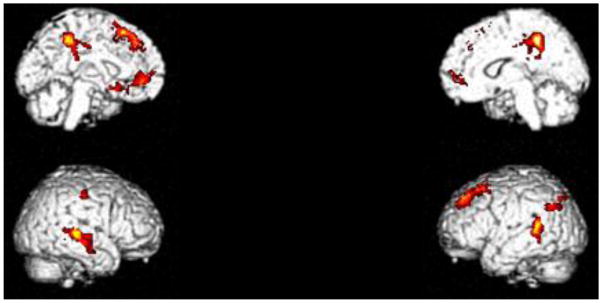
FH+ youths had greater activations than FH− youths in both Go Only and Go/NoGo blocks (respective tasks versus baseline). FH+ youths had greater activations in the Go Only blocks in the posterior cingulate/precuneus (BA 5/31), bilateral middle/superior temporal gyrus (BA 22), medial superior frontal gyrus (BA 8), left inferior frontal gyrus (BA 45), bilateral striatum, and medial parietal lobe/precuneus (BA 7) (Figure 2, Table 3). FH+ youths had greater activations in the Go/NoGo blocks in the posterior cingulate/precuneus (BA 31), bilateral middle/superior temporal gyrus (BA 21/22), medial superior frontal gyrus (BA 8), left parietal lobe/angular gyrus (BA 39/40), and rostral anterior cingulate (BA 32) (Figure 3, Table 4). The group differences on the Go Only and Go/NoGo blocks overlapped on five (posterior cingulate/precuneus, bilateral middle/superior temporal gyrus, and medial superior frontal gyrus) out of 7 regions. We observed no significant between-group differences in the Go Only minus Go/NoGo blocks. Results did not change when only FH+ individuals with no DSM-IV disorders (n = 44) were included in the analysis. Significant between-group differences were in the same locations and no additional differences were observed, suggesting that group differences were not driven by the presence of DSM-IV disorders in 28 FH+ youths.
Figure 2.
FH+ versus FH− in Go Only blocks minus baseline contrast. FH+ youths had greater activations in the Go Only blocks in the posterior cingulate/precuneus (BA 5/31), bilateral middle/superior temporal gyrus (BA 22), medial superior frontal gyrus (BA 8), left inferior frontal gyrus (BA 45), bilateral striatum, and medial parietal lobe/precuneus (BA 7), see Table 3. Cluster-level FWE corrected p <0.05.
Table 3.
Significant clusters in the FH+ minus FH− in the Go minus baseline condition. ‘k’ denotes cluster size in voxels.
| Region | X | Y | Z | T score | Z score | p (FWE) | k | Cluster p-value |
|---|---|---|---|---|---|---|---|---|
| Posterior Cingulate Cortex/Precuneus (BA 5/31) | −4 | −40 | 48 | 5.15 | 4.85 | 0.02 | 1306 | 0.00 |
| 14 | −42 | 46 | 4.32 | 4.13 | 0.25 | |||
| 18 | −48 | 34 | 3.95 | 3.81 | 0.58 | |||
| Right Caudate/Putamen | 18 | 20 | −6 | 4.62 | 4.40 | 0.10 | 532 | 0.00 |
| 42 | 26 | −12 | 4.26 | 4.08 | 0.29 | |||
| 36 | 30 | −6 | 4.13 | 3.96 | 0.40 | |||
| Right Superior Temporal Gyrus (BA 22) | 56 | −28 | 2 | 4.46 | 4.26 | 0.16 | 470 | 0.01 |
| 68 | −24 | −2 | 4.27 | 4.09 | 0.28 | |||
| 64 | −10 | −16 | 3.70 | 3.58 | 0.83 | |||
| Left Medial Superior Frontal Gyrus (BA 8) | −20 | 20 | 52 | 4.38 | 4.19 | 0.21 | 727 | 0.00 |
| −14 | 40 | 44 | 3.85 | 3.72 | 0.69 | |||
| −24 | 40 | 42 | 3.82 | 3.68 | 0.72 | |||
| Precuneus (BA 7) | −2 | −60 | 48 | 4.33 | 4.15 | 0.24 | 293 | 0.05 |
| −2 | −70 | 50 | 3.99 | 3.84 | 0.54 | |||
| −8 | −76 | 42 | 3.84 | 3.71 | 0.69 | |||
| Left Middle Temporal Gyrus/Superior Temporal Gyrus (BA 22) | −56 | −44 | 14 | 4.10 | 3.94 | 0.43 | 295 | 0.04 |
| −50 | −42 | 6 | 3.74 | 3.62 | 0.79 | |||
| −64 | −50 | 10 | 3.49 | 3.39 | 0.95 | |||
| Left Caudate/Putamen | −16 | 8 | −12 | 3.88 | 3.74 | 0.65 | 416 | 0.01 |
| −20 | 16 | −12 | 3.82 | 3.69 | 0.72 | |||
| −26 | 26 | 6 | 3.68 | 3.56 | 0.84 |
Figure 3.
FH+ versus FH− in Go/NoGo blocks minus baseline contrast. FH+ youths had greater activations in the Go/NoGo blocks in the posterior cingulate/precuneus (BA 31), bilateral middle/superior temporal gyrus (BA 21/22), medial superior frontal gyrus (BA 8), left parietal lobe/angular gyrus (BA 39/40), and rostral anterior cingulate (BA 32), see Table 4. Cluster-level FWE corrected p <0.05.
Table 4.
Significant clusters in the FH+ minus FH− in the NoGo minus baseline condition. ‘k’ denotes cluster size in voxels.
| Region | X | Y | Z | T score | Z score | p (FWE) | k | Cluster p-value |
|---|---|---|---|---|---|---|---|---|
| Posterior Cingulate Cortex (BA 31) | −4 | −40 | 48 | 5.00 | 4.80 | 0.00 | 1161 | 0.00 |
| 14 | −44 | 46 | 4.10 | 3.90 | 0.40 | |||
| 26 | −38 | 48 | 4.10 | 3.90 | 0.50 | |||
| Middle Temporal Gyrus (BA 21/22) | 68 | −24 | −2 | 4.90 | 4.60 | 0.00 | 616 | 0.00 |
| 58 | −28 | 4 | 4.30 | 4.10 | 0.20 | |||
| 64 | −10 | −16 | 4.20 | 4.00 | 0.30 | |||
| Left Medial Superior Frontal Gyrus (BA 8) | −20 | 20 | 52 | 4.50 | 4.30 | 0.10 | 1026 | 0.00 |
| −10 | 34 | 52 | 4.40 | 4.20 | 0.20 | |||
| −10 | 38 | 44 | 3.90 | 3.70 | 0.70 | |||
| Left Middle Temporal Gyrus/Superior Temporal Gyrus (BA 22) | −54 | −44 | 14 | 4.40 | 4.20 | 0.20 | 415 | 0.00 |
| −62 | −48 | 10 | 3.90 | 3.80 | 0.60 | |||
| −56 | −42 | 4 | 3.80 | 3.70 | 0.70 | |||
| Rostral Anterior Cingulate Cortex (BA 32) | −4 | 48 | 0 | 4.00 | 3.80 | 0.50 | 427 | 0.00 |
| −8 | 40 | −4 | 3.80 | 3.70 | 0.70 | |||
| −14 | 20 | −12 | 3.80 | 3.70 | 0.70 |
Correlations with FH Density
The ROI analyses were performed for all regions that showed significant group differences in the Go Only and Go/NoGo blocks. In the Go Only blocks (Table 5), FH density was significantly positively correlated with activity in posterior cingulate cortex/precuneus (r=.296, p=.014, corrected), the left medial superior frontal gyrus (r=.277, p=.028, corrected), and right caudate/putamen (r=.270, p=.035, corrected). In the Go/NoGo blocks (Table 6), FH density was significantly positively correlated with activity in the posterior cingulate cortex (r=.280, p=.020, corrected) and the left middle/superior temporal gyrus (r=.258, p=.040, corrected).
Table 5.
Correlations between family history density and activation in the Go minus baseline condition. The corrected p column is the p-value corrected for 7 comparisons.
| Region | X | Y | Z | r | Corrected p |
|---|---|---|---|---|---|
| Posterior Cingulate Cortex/Precuneus (BA 5/31) | −4 | −40 | 48 | .296 | .014 |
| Right Caudate/Putamen | 18 | 20 | −6 | .270 | .035 |
| Right Superior Temporal Gyrus (BA 22) | 56 | −28 | 2 | .247 | .077 |
| Left Medial Superior Frontal Gyrus (BA 8) | −20 | 20 | 52 | .277 | .028 |
| Precuneus (BA 7) | −2 | −60 | 48 | .233 | .119 |
| Left Middle Temporal Gyrus/Superior Temporal Gyrus (BA 22) | −56 | −44 | 14 | .150 | .889 |
| Left Caudate/Putamen | −16 | 8 | −12 | .228 | .133 |
Table 6.
Correlations between family history density scores and activation in the NoGo minus baseline condition. The corrected p column is the p-value corrected for 5 comparisons.
| Region | X | Y | Z | r | Corrected p |
|---|---|---|---|---|---|
| Posterior Cingulate Cortex (BA 31) | −4 | −40 | 48 | .280 | .020 |
| Middle Temporal Gyrus (BA 21/22) | 68 | −24 | −2 | .179 | .340 |
| Left Medial Superior Frontal Gyrus (BA 8) | −20 | 20 | 52 | .224 | .110 |
| Left Middle Temporal Gyrus/Superior Temporal Gyrus (BA 22) | −54 | −44 | 14 | .258 | .040 |
| Rostral Anterior Cingulate Cortex (BA 32) | −4 | 48 | 0 | .176 | .365 |
Discussion
In this study, we compared functional activations in a large sample of FH+ and FH− youths performing a go/no go task in trial blocks with only go trials (Go Only blocks) and trial blocks with 50% go and 50% no go trials (Go/NoGo blocks). FH+ youths had significantly greater cerebral activations in both the Go Only and Go/NoGo blocks than FH− youths in regions including the posterior cingulate/precuneus, bilateral middle/superior temporal gyrus, and medial superior frontal gyrus. FH density was significantly and positively correlated with activity in posterior cingulate cortex/precuneus, medial superior frontal gyrus, caudate/putamen, and middle/superior temporal gyrus. There were no significant group differences in the subtraction between Go Only and Go/NoGo blocks, suggesting that groups did not differ in this second order contrast. Additionally, FH+ youths had moderately slower reaction times on go trials in the Go Only blocks, suggesting a general attention or performance deficit on this fundamental component of the task. Overall, our findings suggest that global activation increases in FH+ youths are modulated by FH density and not specific to the inhibitory components of the task. This pattern of increased activations in FH+ youths may be at least partially due to impaired forebrain white matter development (Herting et al., 2010, Acheson et al., 2014b, Acheson et al., 2014a) leading to greater activations as a result of less efficient neural communication during task performance.
To our knowledge, no previous study reported similar first-level activations in FH+ and FH− individuals performing go/no-go tasks. The increased forebrain activations in FH+ youths may be due at least in part to their impaired forebrain white matter integrity (Herting et al., 2010, Acheson et al., 2014b, Acheson et al., 2014a) as decreased forebrain white matter integrity has previously been associated with increased forebrain activations during task performance and is thought to indicate increased energy required due to poorer insulation of axonal tracts resulting in decreased neural efficiency (Burzynska et al., 2013, Zhu et al., 2013). Specifically, improved white matter integrity increases the efficiency of neuronal firing by reducing ion leak through axonal membranes and shifting some of the metabolic burden of action potential propagation from neurons to oligodendrocytes and other glial cells by facilitating saltatory conduction. Saltatory conduction increases the velocity of signal propagation while reducing neuronal metabolic burden by up to ten-fold (Hildebrand et al., 1993, Susuki, 2013, Miller et al., 2013). Because of white matter integrity impairments, FH+ youths may be required to expend more processing effort and energy utilization in neurons for long-distance communication and thus resulting in increased functional activations. Decreased neural efficiency may also contribute to the moderately slower reaction times in FH+ youths on go trials in the Go Only blocks. While we did not observe significant differences on omission and commission errors, there were generally low levels of these across all subjects, and it is possible FH+ youths would show more robust deficits on more cognitively demanding version of the task.
Our findings of no significant group differences in the Go/NoGo minus Go Only blocks contrast differs from previous reported findings of increased activations in FH+ youths and adults when contrasting successfully inhibited no-go trials with go trials (Jamadar et al., 2012, Heitzeg et al., 2010, DeVito et al., 2013) and decreased activations in FH+ youths when contrasting all no-go trials with go trials (Schweinsburg et al., 2004). However, it is difficult to directly compare findings because of the different analysis strategies between our study and the previous FH go/no go studies. Event-related designs are likely more sensitive in detecting activation differences between no-go and go trials, while block designs contrasting task and rest condition may be better for detecting overall activation differences associated with task performance. The prior studies employed go/no-go tasks with more go cues than no go cues. This is intended to induce pre-potent responding that must be inhibited on no-go trials. In contrast, our task had discreet blocks consisting of only go trials alternating with blocks with an equal number of go and no-go trials and thus may have required less inhibitory effort. However, we would expect that FH+ youths would also show greater overall activation increases performing go/no go tasks more likely to induce pre-potent responding if task versus rest contrasts were employed as our results suggest there are basic differences in neural functioning associated with go/no-go performance in FH+ youths that are not unique to inhibitory processing.
There are several caveats to this study. Our results indicate that FH+ youths have increased forebrain activity while performing basic go/no-go task components, and given associations between neuronal activations and white matter integrity, FH+ youths may be expected to show increased forebrain activity across a range of cognitive tasks. Consistent with this, FH+ individuals have been show to have elevated forebrain activations during Stroop and simulated gambling tasks when task performance had contrasted with either rest or low level perceptual motor control conditions (Silveri et al., 2011, Acheson et al., 2009). Similarly, studies reporting relative decreases in forebrain activity in FH+ individuals have typically employed potentially more subtle task contrasts in an effort to isolate neural activity associated with specific cognitive processes (Cservenka and Nagel, 2012, Andrews et al., 2011, Spadoni et al., 2008, Cservenka et al., 2012). However, more studies employing resting or low level perceptual motor control contrast conditions are needed to confirm this hypothesis. Additionally, our cohort included individuals with psychiatric disorders that are more common in FH+ youths and frequently co-morbid with drug and alcohol abuse (Iacono et al., 2008). However, removing participants with psychiatric disorders as well as any prior drug use from the analyses did not alter the findings. Also while we did exclude youths with low IQ or physical/developmental disabilities, we did not screen for substance use exposure during pregnancy or control other potential adverse environmental influences such as poor prenatal care or elevated maternal or childhood stress and adversity. Thus further study is necessary to determine to what extent the differences we observed are genetically versus environmentally mediated. Finally, it is presently unclear how increased forebrain activations may relate to risk for developing substance use disorders although it may be a marker for impaired or delayed forebrain development. Longitudinal studies are necessary to address these issues.
In summary, we observed increased forebrain activations in FH+ youths performing a go/no go task under both go and no/go first order contrast conditions, but not under no/go minus go second order contrast conditions. These increased activations in several forebrain regions were proportional to the number of affected parents and grandparents, an empirical risk factor for developing substance use disorder (Stoltenberg et al., 1998, Dawson et al., 1992). These findings suggest basic differences task neural regulation of task performance that are not unique to inhibitory processing. Considered together with previous findings indicating FH+ youths have impaired forebrain white matter integrity, our results suggest these youths also have less efficient neural processing and provide further evidence for delayed or impaired forebrain maturation in FH+ youths. These youths are part of a longitudinal study on adolescent brain and impulse control development and progression of substance use disorders. As part of our ongoing studies, we will evaluate how elevated forebrain activations relate to the initiation and progression of substance use disorders.
Acknowledgments
Research reported in this publication was supported by NIDA and NIBIB of the National Institutes of Health under award numbers R01-DA026868, R01-DA033997, and R01-EB015611. Donald Dougherty is the recipient of the William and Marguerite Wurzbach Distinguished Professorship.
Footnotes
The content is solely the view of the authors and does not necessarily represent the official view of the National Institutes of Health.
References
- Achenbach TM. Child behavior checklist for ages 6 to 18. University of Vermont, Research Center for Children, Youth, and Families; Burlington, VT: 2001. [Google Scholar]
- Acheson A, Richard DM, Mathias CW, Dougherty DM. Adults with a family history of alcohol related problems are more impulsive on measures of response initiation and response inhibition. Drug Alcohol Depend. 2011a;117:198–203. doi: 10.1016/j.drugalcdep.2011.02.001. [DOI] [PMC free article] [PubMed] [Google Scholar]
- Acheson A, Robinson JL, Glahn DC, Lovallo WR, Fox PT. Differential activation of the anterior cingulate cortex and caudate nucleus during a gambling simulation in persons with a family history of alcoholism: studies from the Oklahoma Family Health Patterns Project. Drug Alcohol Depend. 2009;100:17–23. doi: 10.1016/j.drugalcdep.2008.08.019. [DOI] [PMC free article] [PubMed] [Google Scholar]
- Acheson A, Vincent AS, Sorocco KH, Lovallo WR. Greater Discounting of Delayed Rewards in Young Adults with Family Histories of Alcohol and Drug Use Disorders: Studies from the Oklahoma Family Health Patterns Project. Alcohol Clin Exp Res. 2011b doi: 10.1111/j.1530-0277.2011.01507.x. [DOI] [PMC free article] [PubMed] [Google Scholar]
- Acheson A, Wijtenburg SA, Rowland LM, Bray BC, Gaston F, Mathias CW, Fox PT, Lovallo WR, Wright SN, Hong LE, McGuire S, Kochunov P, Dougherty DM. Combining diffusion tensor imaging and magnetic resonance spectroscopy to study reduced frontal white matter integrity in youths with family histories of substance use disorders. Hum Brain Mapp. 2014a doi: 10.1002/hbm.22591. [DOI] [PMC free article] [PubMed] [Google Scholar]
- Acheson A, Wijtenburg SA, Rowland LM, Winkler AM, Gaston F, Mathias CW, Fox PT, Lovallo WR, Wright SN, Hong LE, Dougherty DM, Kochunov P. Assessment of whole brain white matter integrity in youths and young adults with a family history of substance-use disorders. Hum Brain Mapp. 2014b doi: 10.1002/hbm.22559. [DOI] [PMC free article] [PubMed] [Google Scholar]
- Altshuler LL, Bookheimer SY, Townsend J, Proenza MA, Eisenberger N, Sabb F, Mintz J, Cohen MS. Blunted activation in orbitofrontal cortex during mania: a functional magnetic resonance imaging study. Biol Psychiatry. 2005;58:763–769. doi: 10.1016/j.biopsych.2005.09.012. [DOI] [PubMed] [Google Scholar]
- Andrews MM, Meda SA, Thomas AD, Potenza MN, Krystal JH, Worhunsky P, Stevens MC, O’Malley S, Book GA, Reynolds B, Pearlson GD. Individuals family history positive for alcoholism show functional magnetic resonance imaging differences in reward sensitivity that are related to impulsivity factors. Biol Psychiatry. 2011;69:675–683. doi: 10.1016/j.biopsych.2010.09.049. [DOI] [PMC free article] [PubMed] [Google Scholar]
- Burzynska AZ, Garrett DD, Preuschhof C, Nagel IE, Li SC, Backman L, Heekeren HR, Lindenberger U. A scaffold for efficiency in the human brain. J Neurosci. 2013;33:17150–17159. doi: 10.1523/JNEUROSCI.1426-13.2013. [DOI] [PMC free article] [PubMed] [Google Scholar]
- Clark DB, Cornelius JR, Kirisci L, Tarter RE. Childhood risk categories for adolescent substance involvement: a general liability typology. Drug Alcohol Depend. 2005;77:13–21. doi: 10.1016/j.drugalcdep.2004.06.008. [DOI] [PubMed] [Google Scholar]
- Corral M, Holguin SR, Cadaveira F. Neuropsychological characteristics of young children from high-density alcoholism families: a three-year follow-up. J Stud Alcohol. 2003;64:195–199. doi: 10.15288/jsa.2003.64.195. [DOI] [PubMed] [Google Scholar]
- Cotton NS. The familial incidence of alcoholism: a review. J Stud Alcohol. 1979;40:89–116. doi: 10.15288/jsa.1979.40.89. [DOI] [PubMed] [Google Scholar]
- Cservenka A, Herting MM, Nagel BJ. Atypical frontal lobe activity during verbal working memory in youth with a family history of alcoholism. Drug Alcohol Depend. 2012;123:98–104. doi: 10.1016/j.drugalcdep.2011.10.021. [DOI] [PMC free article] [PubMed] [Google Scholar]
- Cservenka A, Nagel BJ. Risky decision-making: an FMRI study of youth at high risk for alcoholism. Alcohol Clin Exp Res. 2012;36:604–615. doi: 10.1111/j.1530-0277.2011.01650.x. [DOI] [PMC free article] [PubMed] [Google Scholar]
- Dawson DA, Harford TC, Grant BF. Family history as a predictor of alcohol dependence. Alcohol Clin Exp Res. 1992;16:572–575. doi: 10.1111/j.1530-0277.1992.tb01419.x. [DOI] [PubMed] [Google Scholar]
- Deckel AW. Tests of executive functioning predict scores on the MacAndrew Alcoholism Scale. Progress in neuro-psychopharmacology & biological psychiatry. 1999;23:209–223. doi: 10.1016/s0278-5846(98)00108-0. [DOI] [PubMed] [Google Scholar]
- DeVito EE, Meda SA, Jiantonio R, Potenza MN, Krystal JH, Pearlson GD. Neural correlates of impulsivity in healthy males and females with family histories of alcoholism. Neuropsychopharmacology. 2013;38:1854–1863. doi: 10.1038/npp.2013.92. [DOI] [PMC free article] [PubMed] [Google Scholar]
- Eagle DM, Bari A, Robbins TW. The neuropsychopharmacology of action inhibition: cross-species translation of the stop-signal and go/no-go tasks. Psychopharmacology (Berl) 2008;199:439–456. doi: 10.1007/s00213-008-1127-6. [DOI] [PubMed] [Google Scholar]
- Finn PR, Kleinman I, Pihl RO. The lifetime prevalence of psychopathology in men with multigenerational family histories of alcoholism. The Journal of Nervous and Mental Disease. 1990;178:500–504. [PubMed] [Google Scholar]
- Friston K, Henson R, Phillips C, Mattout J. Bayesian estimation of evoked and induced responses. Hum Brain Mapp. 2006;27:722–735. doi: 10.1002/hbm.20214. [DOI] [PMC free article] [PubMed] [Google Scholar]
- Heitzeg MM, Nigg JT, Yau WY, Zucker RA, Zubieta JK. Striatal dysfunction marks preexisting risk and medial prefrontal dysfunction is related to problem drinking in children of alcoholics. Biol Psychiatry. 2010;68:287–295. doi: 10.1016/j.biopsych.2010.02.020. [DOI] [PMC free article] [PubMed] [Google Scholar]
- Herting MM, Schwartz D, Mitchell SH, Nagel BJ. Delay discounting behavior and white matter microstructure abnormalities in youth with a family history of alcoholism. Alcohol Clin Exp Res. 2010;34:1590–1602. doi: 10.1111/j.1530-0277.2010.01244.x. [DOI] [PMC free article] [PubMed] [Google Scholar]
- Hildebrand C, Remahl S, Persson H, Bjartmar C. Myelinated nerve fibres in the CNS. Progress in neurobiology. 1993;40:319–384. doi: 10.1016/0301-0082(93)90015-k. [DOI] [PubMed] [Google Scholar]
- Hollingshead AB. Series Four Factor Index of Social Status. Department of Sociology, Yale University; 1975. Four Factor Index of Social Status; p. 27. [Google Scholar]
- Iacono WG, Malone SM, McGue M. Behavioral disinhibition and the development of early-onset addiction: common and specific influences. Annual review of clinical psychology. 2008;4:325–348. doi: 10.1146/annurev.clinpsy.4.022007.141157. [DOI] [PubMed] [Google Scholar]
- Jamadar S, DeVito EE, Jiantonio RE, Meda SA, Stevens MC, Potenza MN, Krystal JH, Pearlson GD. Memantine, an NMDA receptor antagonist, differentially influences Go/No-Go performance and fMRI activity in individuals with and without a family history of alcoholism. Psychopharmacology (Berl) 2012;222:129–140. doi: 10.1007/s00213-011-2628-2. [DOI] [PMC free article] [PubMed] [Google Scholar]
- Kochunov P, Lancaster JL, Glahn DC, Purdy D, Laird AR, Gao F, Fox P. Retrospective motion correction protocol for high-resolution anatomical MRI. Hum Brain Mapp. 2006;27:957–962. doi: 10.1002/hbm.20235. [DOI] [PMC free article] [PubMed] [Google Scholar]
- Lieb R, Isensee B, Hofler M, Pfister H, Wittchen HU. Parental major depression and the risk of depression and other mental disorders in offspring: a prospective-longitudinal community study. Arch Gen Psychiatry. 2002;59:365–374. doi: 10.1001/archpsyc.59.4.365. [DOI] [PubMed] [Google Scholar]
- Lovallo WR, Yechiam E, Sorocco KH, Vincent AS, Collins FL. Working memory and decision-making biases in young adults with a family history of alcoholism: studies from the Oklahoma family health patterns project. Alcoholism, Clinical and Experimental Research. 2006;30:763–773. doi: 10.1111/j.1530-0277.2006.00089.x. [DOI] [PMC free article] [PubMed] [Google Scholar]
- McCaul ME, Turkkan JS, Svikis DS, Bigelow GE, Cromwell CC. Alcohol and drug use by college males as a function of family alcoholism history. Alcohol Clin Exp Res. 1990;14:467–471. doi: 10.1111/j.1530-0277.1990.tb00505.x. [DOI] [PubMed] [Google Scholar]
- Miller DJ, Duka T, Stimpson CD, Schapiro SJ, Baze WB, McArthur MJ, Fobbs AJ, Sousa AM, Sestan N, Wildman DE, Lipovich L, Kuzawa CW, Hof PR, Sherwood CC. Prolonged myelination in human neocortical evolution. Proc Natl Acad Sci U S A. 2013;109:16480–16485. doi: 10.1073/pnas.1117943109. [DOI] [PMC free article] [PubMed] [Google Scholar]
- PsychologicalCorporation. Wechsler Abbreviated Scale of intelligence (WASI) manual. The Psychological Corporation; San Antonio: 1999. [Google Scholar]
- Rice JP, Reich T, Bucholz KK, Neuman RJ, Fishman R, Rochberg N, Hesselbrock VM, Nurnberger JI, Jr, Schuckit MA, Begleiter H. Comparison of direct interview and family history diagnoses of alcohol dependence. Alcohol Clin Exp Res. 1995;19:1018–1023. doi: 10.1111/j.1530-0277.1995.tb00983.x. [DOI] [PubMed] [Google Scholar]
- Ryan SR, Acheson A, Charles NE, Lake SL, Hernandez DL, Mathias CW, Dougherty DM. Clinical and Social/Environmental Characteristics in a Community Sample of Children With and Without Family Histories of Substance Use Disorder in the San Antonio Area: A Descriptive Study. (Under Review) [DOI] [PMC free article] [PubMed] [Google Scholar]
- Schweinsburg AD, Paulus MP, Barlett VC, Killeen LA, Caldwell LC, Pulido C, Brown SA, Tapert SF. An FMRI study of response inhibition in youths with a family history of alcoholism. Ann N Y Acad Sci. 2004;1021:391–394. doi: 10.1196/annals.1308.050. [DOI] [PubMed] [Google Scholar]
- Sher KJ, Grekin ER, Williams NA. The development of alcohol use disorders. Annual Reviews of Clinical Psychology. 2004;22:1–22. doi: 10.1146/annurev.clinpsy.1.102803.144107. [DOI] [PubMed] [Google Scholar]
- Sher KJ, Trull TJ. Personality and disinhibitory psychopathology: alcoholism and antisocial personality disorder. Journal of Abnormal Psychology. 1994;103:92–102. doi: 10.1037//0021-843x.103.1.92. [DOI] [PubMed] [Google Scholar]
- Silveri MM, Rogowska J, McCaffrey A, Yurgelun-Todd DA. Adolescents at risk for alcohol abuse demonstrate altered frontal lobe activation during Stroop performance. Alcohol Clin Exp Res. 2011;35:218–228. doi: 10.1111/j.1530-0277.2010.01337.x. [DOI] [PMC free article] [PubMed] [Google Scholar]
- Spadoni AD, Norman AL, Schweinsburg AD, Tapert SF. Effects of family history of alcohol use disorders on spatial working memory BOLD response in adolescents. Alcohol Clin Exp Res. 2008;32:1135–1145. doi: 10.1111/j.1530-0277.2008.00694.x. [DOI] [PMC free article] [PubMed] [Google Scholar]
- Stevens MC, Kaplan RF, Hesselbrock VM. Executive-cognitive functioning in the development of antisocial personality disorder. Addict Behav. 2003;28:285–300. doi: 10.1016/s0306-4603(01)00232-5. [DOI] [PubMed] [Google Scholar]
- Stoltenberg SF, Mudd SA, Blow FC, Hill EM. Evaluating measures of family history of alcoholism: density versus dichotomy. Addiction. 1998;93:1511–1520. doi: 10.1046/j.1360-0443.1998.931015117.x. [DOI] [PubMed] [Google Scholar]
- Susuki K. Node of Ranvier disruption as a cause of neurological diseases. ASN Neuro. 2013;5:209–219. doi: 10.1042/AN20130025. [DOI] [PMC free article] [PubMed] [Google Scholar]
- Tarter RE, Kirisci L, Mezzich A, Cornelius JR, Pajer K, Vanyukov M, Gardner W, Blackson T, Clark D. Neurobehavioral disinhibition in childhood predicts early age at onset of substance use disorder. American Journal of Psychiatry. 2003;160:1078–1085. doi: 10.1176/appi.ajp.160.6.1078. [DOI] [PubMed] [Google Scholar]
- Wijtenburg SA, McGuire SA, Rowland LM, Sherman PM, Lancaster JL, Tate DF, Hardies LJ, Patel B, Glahn DC, Hong LE, Fox PT, Kochunov P. Relationship between fractional anisotropy of cerebral white matter and metabolite concentrations measured using (1)H magnetic resonance spectroscopy in healthy adults. Neuroimage. 2012;66C:161–168. doi: 10.1016/j.neuroimage.2012.10.014. [DOI] [PMC free article] [PubMed] [Google Scholar]
- Zhu Z, Johnson NF, Kim C, Gold BT. Reduced Frontal Cortex Efficiency is Associated with Lower White Matter Integrity in Aging. Cereb Cortex. 2013 doi: 10.1093/cercor/bht212. [DOI] [PMC free article] [PubMed] [Google Scholar]