Abstract
Cue- and reward-evoked phasic dopamine activity during Pavlovian and operant conditioning paradigms is well correlated with reward-prediction errors from formal reinforcement learning models, which feature teaching signals in the form of discrepancies between actual and expected reward outcomes. Additionally, in learning tasks where conditioned cues probabilistically predict rewards, dopamine neurons show sustained cue-evoked responses that are correlated with the variance of reward and are maximal to cues predicting rewards with a probability of 0.5. Therefore, it has been suggested that sustained dopamine activity after cue presentation encodes the uncertainty of impending reward delivery. In the current study we examined the acquisition and maintenance of these neural correlates using fast-scan cyclic voltammetry in rats implanted with carbon fiber electrodes in the nucleus accumbens core during probabilistic Pavlovian conditioning. The advantage of this technique is that we can sample from the same animal and recording location throughout learning with single trial resolution. We report that dopamine release in the nucleus accumbens core contains correlates of both expected value and variance. A quantitative analysis of these signals throughout learning, and during the ongoing updating process after learning in probabilistic conditions, demonstrates that these correlates are dynamically encoded during these phases. Peak CS-evoked responses are correlated with expected value and predominate during early learning while a variance-correlated sustained CS signal develops during the post-asymptotic updating phase.
Introduction
The phasic firing of dopamine neurons in response to rewards and reward-predictive cues during operant and Pavlovian conditioning tasks conforms well to a teaching signal from formal models of reinforcement learning (Rescorla and Wagner 1972; Sutton 1988; Fiorillo et al. 2003, Schultz et al. 1997, Waelti et al. 2001). Specifically, the temporal difference algorithm is a computational model built in time steps between predictive stimuli and reward presentation. It responds to discrepancies between rewards received and what was anticipated based on the predictive stimuli. These “reward-prediction error” signals track back through the state space to the predictive stimulus to represent changes in expectation conferred by the stimulus (i.e. “back propagation”)(Niv et al., 2005). Indeed, when reward-predictive stimuli are presented unexpectedly, the phasic firing of dopamine neurons correlates with the expected value (EV; magnitude x probability) of future reward conferred by that stimulus. Subsequently, at the time of expected reward delivery phasic dopamine activity correlates with the discrepancy between the expected value and the actual reward delivered (Schultz et al. 1997, Waelti et al. 2001, Fiorillo et al. 2003, Nakahara et al. 2004, Bayer and Glimcher 2005, Tobler et al. 2005, Pan et al. 2005, Bayer et al. 2007, Fiorillo 2011). These signals are mirrored by neural activity in the nucleus accumbens in the form of the BOLD signal (Preuschoff et al. 2006, Rutledge et al. 2010) and phasic dopamine release (Gan et al. 2010, Flagel et al. 2011, Clark et al. 2013).
In addition to representing these signals dopamine neurons may encode the uncertainty of reward associated with a partially reinforced CS. Probabilistic cues evoke a sustained increase or ramping in the firing rate of dopamine neurons that correlates with the variance of reward, with a maximum response to CSs that predict rewards with a probability of 0.5 (Fiorillo et al. 2003). A variance-correlated signal can also be found in the nucleus accumbens, a downstream target of these neurons (Preuschoff et al. 2006). However, it is unclear how a representation of reward variance is acquired or how it is used. Attempts to reconcile the signal with the TD model have resulted in controversy (Niv et al. 2005, Fiorillo et al. 2005). Niv et al. (2005) proposed that the variance correlate could be replicated by a modified TD model that represented positive and negative reward-prediction errors asymmetrically, which may be a consequence of the low tonic firing rate of dopamine neurons (Bayer and Glimcher 2005). The Niv et al. (2005) model predicts that while the variance signal can be observed in the responses of dopamine neurons to a probablistic CS, it is property of signal averaging. However, Schultz and colleagues (Fiorillo et al. 2005) subsequently provided evidence for the presence of the variance correlate in the responses of dopamine neurons on individual trials.
Studies using fast-scan cyclic voltammetry in the nucleus accumbens core of rats during Pavlovian conditioning or operant tasks in rats have demonstrated that EV and reward-prediction-error correlates are present in the form of phasic dopamine release (Stuber et al. 2008, Gan et al. 2010, Flagel et al. 2011, Clark et al. 2013), but a correlate of variance or uncertainty in the form of phasic dopamine release has not been described. Therefore, in the current study, we recorded dopamine release in the nucleus accumbens core of rats undergoing Pavlovian conditioning with partial reinforcement which allowed for both the examination of signaling on individual trials and a quantitative analysis of signaling profiles across multiple stages of learning.
Materials and Methods
Animals and Surgery
The University of Washington institutional animal care and use committee approved all animal procedures, which were conducted during the animals’ light cycle. We anaesthetized male Sprague-Dawley rats (mean ± σ weight = 389 ± 30 g) with isoflurane and chronically implanted them either unilaterally or bilaterally with carbon fiber microelectrodes targeted to the nucleus accumbens core (from Bregma: anterior 1.3 mm, medial 1.3 mm, ventral 6.8 - 7.2 mm) and unilateral Ag/AgCl reference electrodes (Clark et al. 2010). We connected electrodes to 6-pin data-mate connectors (Harwin, Portsmouth, UK), which were cemented to the skull. Implants were held in place with stainless steel screws in the skull and dental cement. We singly housed rats after surgery for the duration of the experiment. After recovery from surgery, rats were food restricted to maintain them at 85% to 90% of their post-recovery body weight throughout training.
Pavlovian Training
We conducted Pavlovian training and voltammetry recording in modified MED Associates (St. Albans, VT) behavioral chambers (Flagel et al. 2011). Each chamber was equipped with a house light, a fan, two retractable levers below cue lights and a food magazine equipped with a cue light, an IR beam and a photo-sensor, located between the levers. Behavioral chambers were equipped with infrared sensitive cameras, and DVD recorders so that behavior could be recorded and scored offline. We habituated rats to the behavior chambers before the beginning of training. During habituation, the magazine light, house light, and fan were turned on, and approximately ten 45-mg dustless precision pellets (Bio-Serv, Frenchtown, NJ) were placed in the feeder magazine. The rats remained in behavior chambers until they consumed all of the pellets. After habituation, the rats then underwent three sessions of magazine training. During magazine training, the house light and fan were on continuously and the unconditioned stimulus (US) was delivered 20 times per session 90 ± 30 s apart. The US was composed of the delivery of a single food pellet coincident with the start of a 3-s illumination of the magazine light.
After magazine training, we conducted Pavlovian delay conditioning. The conditioned stimulus (CS) was composed of a lever extension and illumination of a cue light for 8 s. We assigned the CS to the left or right side of the feeder in a counterbalanced manner across rats. We assigned rats to 5 probability groups (0: n = 4, 0.25: n = 4, 0.50: n = 5, 0.75: n = 4, 1.00: n = 5). All rats received 24 rewarded trials per session, except one rat in the 0.5 group who received 25 rewarded trials per session. On rewarded trials the CS was immediately followed by the US. On reward omission trials, the CS was presented but was not followed by the US. The number of reward omission trials varied between groups and was determined by the probability of reinforcement (Probability: Reward Omission Trials, 0.25: 72, 0.5: 24 (25 for one rat), 0.75: 8, 1.00: 0). Rats in the 0 probability group received 24 non-rewarded CS presentations per session. They were also randomly presented with the US 24 times throughout each session. During behavioral sessions, we automatically recorded feeder-entry and lever-press responses. We conducted no more than one behavioral session per rat per day and we ran behavioral sessions once every 2 to 3 days. We continued Pavlovian conditioning up to ten sessions for each rat.
Approach Behavior
We scored CS approach trials from DVD recordings of Pavlovian training sessions. We counted a trial as a CS approach trial if, during the CS period, any part of the rat's head or forelimb made contact with the lever or occupied the space immediately above or below the lever. We calculated approach probability as the number of cue approach trials divided by the total number of trials. We used this method to score approaches rather than lever presses because we found that rats often made lever contacts that did not register as lever pressing. Rats would bite, pull, or even push up on the lever with their noses, and in other instances, rats approached and fixated on the cue light immediately above the lever but did not make lever contacts. We calculated a two-way mixed-model ANOVA for effects of session (session 1 vs. session 6) and probability of reinforcement on CS approach probability. We also conducted Bonferroni-corrected t-tests to compare each group to the 0 probability group in sessions 1 and 6.
Voltammetry
We recorded phasic dopamine release using fast-scan cyclic voltammetry at the implanted carbon-fiber electrodes. We began voltammetry recordings no later than the third magazine training session. We conducted recordings as described previously (Gan et al., 2010; Clark et al., 2010). We plugged each rat into an amplifier headstage (built in house), which was attached via an electrical swivel (Crist Instrument Co., Bethesda, MD or Dragonfly Research and Development, Inc., Ridgely, WV), allowing it to move freely during recording sessions, to National Instruments data-acquisition cards. Signals were digitized and recorded on a PC running Tar Heel (LabVIEW) software. Throughout fast-scan cyclic voltammetry recordings, electrodes were held at −0.4 V, and a triangular voltage waveform was applied to the electrode every 100 ms. The peak of the waveform was 1.3 V, and the scan rate was 400 V/s; the total duration of the waveform was 8.5 ms. During the voltage sweep, current data from the electrodes was collected in either single or dual-channel modes. In single-channel mode, 1000 points of data were sampled during each 8.5 ms voltage scan, for a sample rate of 117.6 kHz. In dual-channel mode, 500 points of data from each channel were sampled during each scan, for a sample rate of 58.8 kHz. To facilitate conditioning of the electrode surface before recordings, we applied the waveform at 60 Hz for approximately one hour before switching to the normal 10 Hz collection mode and waiting for another 30 minutes. To facilitate synchronization of voltammetry and behavior, TTLs from the behavioral control computer were recorded concurrently with voltammetry data. We verified electrode function by examining the mean US-evoked dopamine release from 20 unpredicted USs in the third magazine-training session, and re-verified electrodes before each Pavlovian session by presenting an unpredicted food pellet. We recorded cyclic voltammagrams (CVs) during unpredicted pellet presentation and inspected background-subtracted CVs for their similarity to a dopamine CV. If an unpredicted reward failed to produce a dopamine-like CV, then the animal was rested for 2 days. After three consecutive failures, we considered electrodes no longer usable for data collection. Data were included from electrodes that yielded voltammetry recordings in at least six Pavlovian sessions.
Data Processing and Analysis
We recorded dopamine release in the accumbens core from at least 6 Pavlovian sessions with 24 (0: n = 5, 0.25: n = 4; 0.5 n = 6; 0.75 n = 4; 1: n = 5) electrodes implanted in 22 rats. We processed all fast-scan cyclic voltammetry data using custom Matlab (The Mathworks Natick, MA) software written by ASH or modified by ASH from Keithley and Wightman (2010). We low-pass filtered fast-scan cyclic voltammetry at 2 kHz. We parsed voltammetry data into trials by cutting records to the onset of the CSs, as well as the unpredicted rewards in the case of magazine training sessions and Pavlovian sessions for the 0 probability group. In order to remove the background current from the data, we subtracted the average of 10 CVs recorded immediately before trial onset from each trial's CV data. We converted CV data to dopamine and pH current using principal components regression (two principal components) against a training set of electrically evoked dopamine and pH responses. We conducted residual error analysis on each CV and excluded CV data for which the error was great enough to reject the null hypothesis (α = 0.05) that it was produced by random noise (Jackson and Mudholkar 1979). To calculate the change in dopamine due to reward delivery or reward omission in the nonzero probability groups, we subtracted the average dopamine signal from the last ten scans during the CS. When showing dopamine traces from individual trials, we smoothed data with a five-point sliding average, however, we conducted all quantitative analyses on unsmoothed data averaged over trials. We conducted regression analyses to test the CS- and US-evoked dopamine responses from each session for correlates of EV and variance. For binary rewards, EV is equivalent to probability of reinforcement (PR), and variance is equivalent to PR - PR2. Therefore, we fit the data to first (equation 1) and second order (equation 2) polynomial functions of PR, where D(t) is the dopamine signal recorded at time t. The negative weight for B2 reflects the expected negative weight on PR2 for a variance correlate.
| (1) |
| (2) |
We calculated the mean CS-evoked and US-evoked dopamine response from each session for each electrode (n=24). We then calculated regressions of session mean responses at each time point against first- and second-order polynomial models of dopamine as a function of reward probability. We calculated F statistics and r2 for both models for (1,22 and 2,21 degrees of freedom) as well as the F statistic (1,21 degrees of freedom) and the marginal increase in r2 for the addition of the second-order term to the first-order model. As an estimate of the relative performance of the two models in explaining the variance of the data, we compared the marginal increase in r2 for the second-order model with r2 for the first-order model. We repeated this procedure for all time points (−1 s to 8 s relative to CS-onset, 0.1 s interval) for six sessions of acquisition. For US-evoked dopamine release, we used a similar procedure but calculated regressions against the first-order model only for time points relative to the US (−1 s to 6 s relative to US-onset). For follow up analyses, we calculated the mean dopamine oxidation current from the session averaged dopamine responses for each electrode over four epochs from session two and session six. Three epochs were defined by the CS: CS-onset (0.4 - 1.4 s), CS-peak (1.5 - 2.5 s), CS-late (6.9 - 7.9s), and one epoch was defined by the reward: US-peak (1.5-2.5s from US onset). We also calculated the mean current from the US-peak epoch for reward omission trials. We performed the same regression procedures as above on the mean dopamine responses from each epoch.
We calculated history-based within-electrode contrasts for CS-evoked responses from trials in three stages of Pavlovian training. For subjects in the 0.25, 0.5, and 0.75 probability groups, we sorted trials by the outcomes of the previous two trials. We then calculated the average CS-evoked dopamine response from trials following two rewarded trials and from trials following two omissions from early training (sessions 1 - 3), late training (sessions 4 - 6), and asymptotic (sessions 7-10) stages. We excluded responses from the first two trials of each session. For asymptotic data, we used the subset of electrodes that reached 10 Pavlovian sessions (0.25: n = 4, 0.5: n = 4, 0.75: n = 4). We then calculated the mean dopamine oxidation current in the CS-peak and CS-late epochs defined above, and for contrasts, we subtracted the responses from trials following two omissions from the responses from trials following two rewards. We conducted six paired t-tests for within-electrodes contrasts for each stage/epoch combination and corrected α-levels from t-tests using the Holm-Bonferroni procedure. We performed all statistics using Matlab, except 2-way ANOVAs, for which we used Prism 4.0 (Graphpad Software, San Diego, CA). α = 0.05 for all tests, except where corrected for multiple comparisons.
Histology
After completing Pavlovian training and fast-scan cyclic voltammetry data collection, we anaesthetized rats with ketamine (150 mg/kg) and performed electrolytic lesions through their electrodes. We subsequently perfused the rats through the heart with saline, followed by paraformaldehyde (PFA, 40 g/L in phosphate-buffered saline). We then removed brains and and stored them in PFA in PBS at 4° C. We later saturated brains in sucrose (300 g/L in PBS) at 4° C. We then froze them on dry ice and sectioned them on a cryostat at 50 μm. We mounted sections containing the nucleus accumbens core on slides and stained with cresyl violet. We verified electrode placement using an adult rat brain atlas (Paxinos and Watson 2005).
Results
Behavior
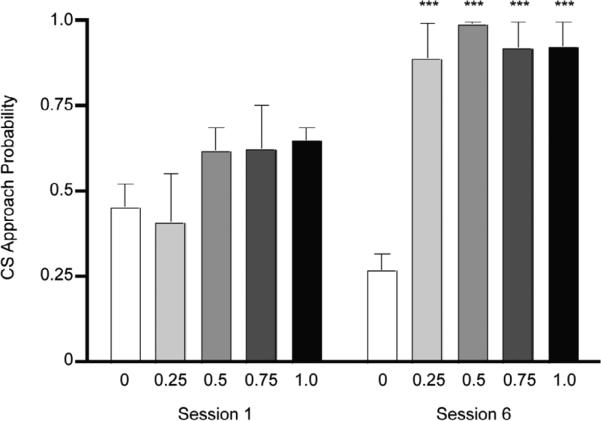
We found that Pavlovian conditioning with any non-zero probability of reinforcement produced learned CS approach behavior. Rats in the 0.25, 0.5, 0.75, and 1.0 probability groups increased their likelihood of CS approach between the first and sixth sessions, while rats in the non-paired group showed a downward trend in approach probability (Figure 1; 2-Way mixed-model ANOVA Session: F1,17 = 26.90, P = 0.00007, Probability: F4,17 = 8.463, P = 0.0006, Interaction: F4,17 = 5.388, P = 0.0055). Post-hoc analysis revealed that rats in the 0.25, 0.5, 0.75, 1.0 probability groups approached the lever more frequently than rats in the 0 probability group in session 6 (t > 4.784, P < 0.001 for all comparisons), but not in session 1 (t < 1.553, P > 0.05 for all comparisons).
Figure 1.
Rats in all groups approached the CS during the first session of training, but by session 6, rats in the 0 probability group (n=4) responded significantly less than rats in the 0.25 (n = 4), 0.5 (n=5), 0.75 (n=4), and 1.0 (n=5) groups. Bars show mean plus standard error (***: P < 0.001 with respect to non-paired group, Bonferroni corrected t-test).
CS-Evoked Dopamine Correlates of Expected Value and Variance
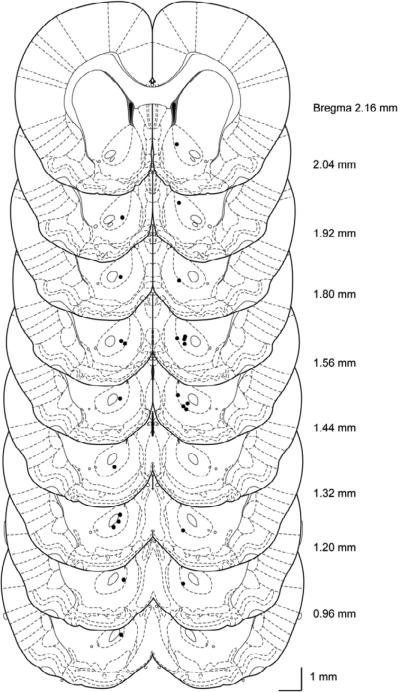
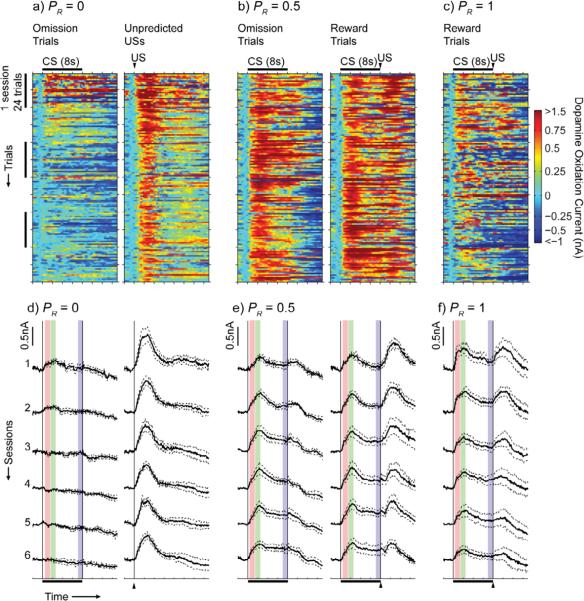
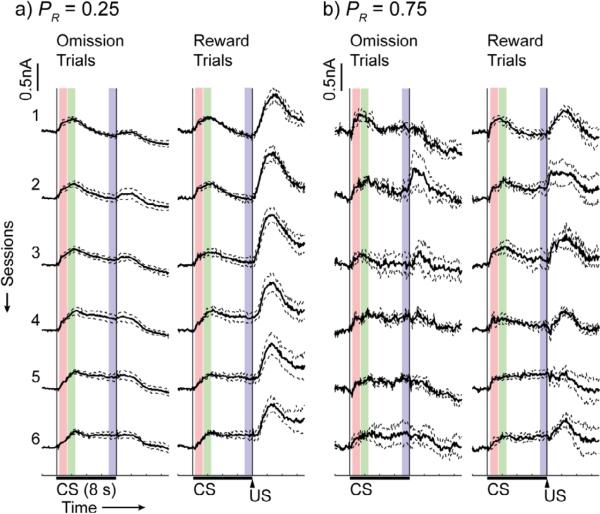
CS- and US-evoked dopamine responses recorded in the nucleus accumbens core (Figure 2) were present in recordings from individual electrodes on individual trials (Figure 3a-c) as well as in average responses over sessions (Figure 3d-f, Figure 4). The CS reliably evoked dopamine release on individual trials over six sessions of training for rats in all non-zero probability groups. Dopamine levels remained elevated during the CS on individual trials for rats in the 0.25, 0.5 (Figure 3b), and 0.75 groups, and this sustained response was present in average dopamine traces from later sessions in the 0.25 (Figure 4a), 0.5 (Figure 3e), and 0.75 (Figure 4b) groups. Sustained responses were also present in average dopamine traces from early sessions in the 1.0 group (Figure 3f). US-evoked responses were also present, but they attenuated over training in all groups, and were nearly eliminated over training in rats in the 1.0 probability group (Figure 3d-f, Figure 4).
Figure 2.
Coronal sections of rat brain show locations for (n = 24) voltammetry electrodes chronically implanted in nucleus accumbens core. Brain atlas sections are from Paxinos and Watson (2005).
Figure 3.
(a-c) Example dopamine traces on individual trials recorded at individual electrodes in the 0, 0.5 and 1.0 groups are shown. For the 0.5 group, reward trials and reward omission trials are shown separately, though they were randomly interleaved during training. Traces were smoothed with a 5-point running average. Gray points indicate data that was excluded because residual error after principal components regression was large enough to reject the null hypothesis (P < 0.05) that error was due to random noise. (d-f) Mean ± SEM of session-averaged traces for the 0 (n = 5), 0.5 (n = 6), and 1.0 (n = 5) groups are shown. Traces from reward and reward omission trials for each session were averaged separately to illustrate differential responding at the time of the US. Colored boxes represent the analysis windows during CS presentation (red: early CS, green: peak CS, blue: late CS).
Figure 4.
Mean ± SEM of session-averaged traces for the 0.25 (n = 4), 0.75 (n = 4) groups are shown. Traces from reward and reward omission trials for each session were averaged separately to illustrate differential responding at the time of the US. Colored boxes represent the analysis windows during CS presentation (red: early CS, green: peak CS, blue: late CS).
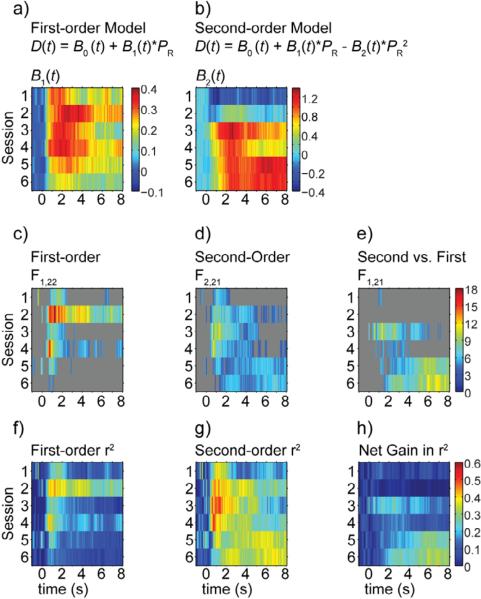
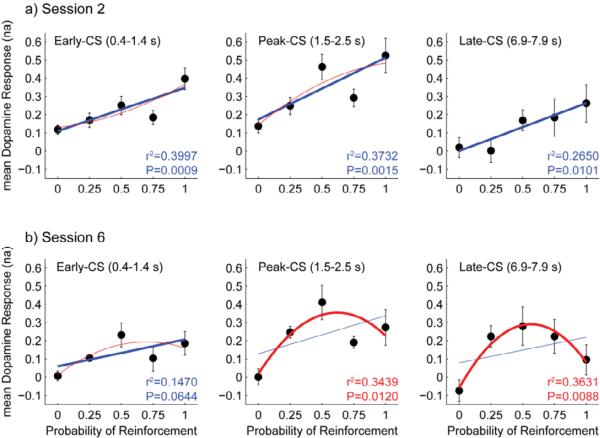
CS-evoked dopamine release contained correlates of both probability and variance over training; however, the development and time course differed between the two. Least squares fits of dopamine release at each time-point by first- and second-order polynomial functions of probability of reinforcement (PR) revealed that the probability correlate emerged first, while the variance correlate appeared later in training. Examination of regression weights revealed that the first order fits were strongest during the early part of the CS (Figure 5a), the second order fits were strongest during the late part of the CS (Figure 5b), and that there was blending of the two models at intermediate time points later in training. Time points with significant first-order regressions (nonzero slope at P < 0.05, F-test) tended to exist in the first 2 seconds of the CS (Figure 5c), while time points for which the second-order model significantly improved the fit (P < 0.05, F-test) over the linear model tended to exist during 2 to 8 s after CS onset (Figure 5e). Exceptions to these trends existed in session 2, during which the linear model was significant for all time points during the CS, and session 3, during which the quadratic model significantly improved the fit in the period one to two seconds after CS onset. Comparison of marginal increase in explained variance for the second-order term to the model with the explained variance of the first-order model indicated that the linear model tended to perform best during the first second after CS-onset, while the second-order model tended to perform best during the last second of the CS (Figure 6). These trends strengthened over training. Follow up analyses on mean CS-evoked dopamine release from early-, peak-, and late-CS epochs from sessions two (Figure 6a) and six (Figure 6b) highlight the transition from the first-order to the second-order model from early to late learning and within the time series of the CS-evoked response during the late learning phase. For all three epochs tested, the linear model fit the dopamine response in session two, and the quadratic model did not significantly improve the fit. In session six, the quadratic model significantly improved the fit and the second order term accounted for more variance than the first order term for the peak-CS and late-CS epochs but not the early-CS epoch (Figure 6, see Table 1 for statistics).
Figure 5.
Regression weights for B1 (a) from the first-order model and B2 (b) from the second-order model are shown for each time point (-1s to 8 s from CS-onset, 0.1 s interval) for sessions 1 through 6. (c-e) F-statistics for significant (P < 0.05) least squares fits for the first- (c) and second-order (d) models, as well as for comparison between the two models (e) are shown for the regressions in a and b. Gray indicates that the F test was not significant for that time point. (f-h) r2 values are shown for the first- (f) and second-order (g) models in a and b, as well as the net increase in r2 (h) for the second-order over the first-order model at each time point.
Figure 6.
(a-b) Group mean ± SEM for dopamine responses in early-CS (left), peak-CS (middle), and late-CS (right) epochs for sessions 2 (a) and 6 (b) are plotted with respect to reinforcement probability. Curves for first-order (blue) and second-order (red) models fits are shown for each epoch. The heavier curve in each plot is for the model that produces the greater net increase in r2. All first-order fits in session 2 are significant. Second order fits for peak-CS and late-CS in session 6 are significant. The first order fit for early-CS in session 6 borders on significance (See table 1 for statistics).
Table 1.
Statistics are shown for follow-up regression analysis on mean CS-evoked dopamine release for early (0.4 - 1.4 s), peak (1.5 - 2.5 s), and late (6.9 - 7.9 s) epochs from sessions 2 and 6. B1 is the slope for the first-order model, and B2 is the weight for - PR2 in the second order-model. F and P values that are significant at P < 0.05 are shown in bold. Net r2 is the difference in r2 between the first- and second-order models. r2 and net r2 are colored to signify the term that accounts for the most variance (blue: B1, red: B2).
| Session Epoch | B1 SEM | SEM | Lin F1,22 P | Quad F2,21 P | Q vs. L F1,21 P | r2 for B1 | Net r2 for B2 |
|---|---|---|---|---|---|---|---|
| 2 Early |
0.2376 0.0621 |
−0.1593 0.2046 |
14.6496 0.0009 |
7.4969 0.0035 |
0.6063 0.4449 |
0.3997 | 0.0168 |
| 2 Peak |
0.3393 0.0938 |
0.2417 0.3090 |
13.0989 0.0015 |
6.7400 0.0055 |
0.6120 0.4428 |
0.3732 | 0.0178 |
| 2 Late |
0.2629 0.0933 |
−0.0069 0.3120 |
7.9321 0.0101 |
3.7861 0.0394 |
0.0005 0.9825 |
0.2650 | 0.00001 |
| 6 Early |
0.1481 0.0760 |
0.3733 0.2408 |
3.7920 0.0644 |
3.2188 0.0603 |
2.4037 0.1360 |
0.1470 | 0.0876 |
| 6 Peak |
0.2086 0.1153 |
0.8767 0.3347 |
3.2732 0.0841 |
5.5039 0.0120 |
6.8623 0.0160 |
0.1295 | 0.2144 |
| 6 Late |
0.1414 0.1257 |
1.1003 0.3449 |
1.2644 0.2729 |
5.9849 0.0088 |
10.1779 0.0044 |
0.0544 | 0.3087 |
US-Evoked Dopamine Correlates of Probability
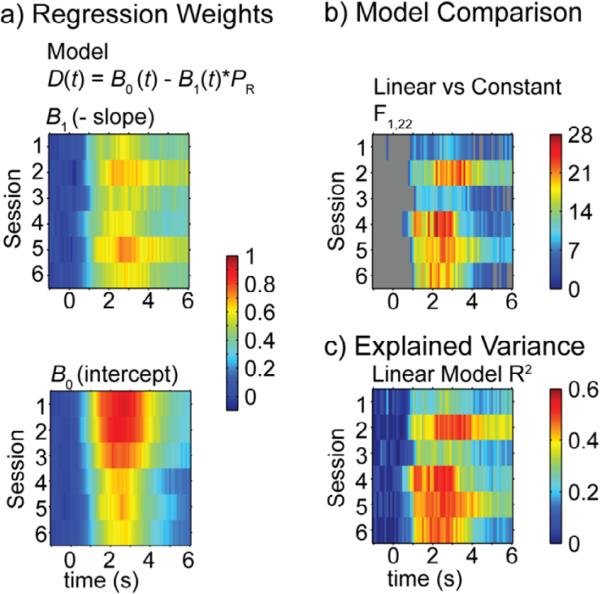
Linear regression analyses of the US-evoked dopamine at each time point from sessions 1 through 6 showed that dopamine release was negatively correlated with PR throughout learning, with the stronger correlations later in training than early (Figure 7 and Table 2). Learning was characterized by a decrease in the intercepts (B0) rather than a steepening of the slopes (B1) of the linear regressions. Follow-up analysis on the mean dopamine release from the peak-US epoch (1.5 - 2.5 s after US onset) from session 2 and session 6 showed consistent results (Figure 8). Linear regressions were significant for session 2 (B0 = 0.8225 ± 0.0910, B1 = −0.6058 ± 0.1486, r2 = 0.4303, P = 0.0005) and session 6 (B0 = 0.5580 ± 0.0716, B1 = −0.5217 ± 0.1169, r2 = 0.4753, P = 0.0002), and while the intercept was greater in session 2 than in session 6 (t22 = 3.2534, P=0.0036), the slopes did not significantly differ (t22 = 0.6378, P=0.5302). Slopes of regression lines of the mean dopamine release during the same epoch on reward omission trials against PR were not significantly different from zero (Session 2: r2 = 0.1039, P = 0.1784; Session 6: r2 = 0.0066, P = 0.7410).
Figure 7.
(a) Slopes (B1) and intercepts (B0) are shown for linear regressions at each time points (-1 s to 6 s relative to US-onset, 0.1 s interval) for rewarded trials in sessions 1 through 6. Significant (P < 0.05) F statistics (b) and r2 (c) values are shown for linear regressions in a.
Table 2.
Statistics are shown for follow-up regression analysis on mean CS-evoked dopamine release for early (0.4 - 1.4 s), peak (1.5 - 2.5 s), and late (6.9 - 7.9 s) epochs from sessions 1 through 6. B1 is the slope for the first-order model, and B2 is the weight for PR2 in the second-order model. Statistics of linear models that are significant at P < 0.05 are shown in bold. Statistics of quadratic models that significantly improve the fit over the linear model at P<0.05 are also shown in bold.
| Linear Model | Quadratic Model | Model Comparison | |||||||||
|---|---|---|---|---|---|---|---|---|---|---|---|
| Session | Epoch | B1 | R2 | F(1,22) | P | B2 | R2 | F(2,21) | P | F(1,21) | P |
| 1 | 0.4-1.4 s | 0.2519 | 0.2064 | 5.7206 | 0.0257 | −0.6297 | 0.3273 | 5.1086 | 0.0156 | 3.7750 | 0.0655 |
| 1.5-2.5 s | 0.2829 | 0.2473 | 7.2285 | 0.0134 | −0.4206 | 0.2985 | 4.4687 | 0.0242 | 1.5335 | 0.2292 | |
| 6.9-7.9 s | 0.1595 | 0.1114 | 2.7569 | 0.1110 | −0.3631 | 0.1655 | 2.0821 | 0.1496 | 1.3620 | 0.2563 | |
| 2 | 0.4-1.4 s | 0.2376 | 0.3997 | 14.6496 | 0.0009 | −0.1593 | 0.4166 | 7.4969 | 0.0035 | 0.6063 | 0.4449 |
| 1.5-2.5 s | 0.3393 | 0.3732 | 13.0989 | 0.0015 | 0.2417 | 0.3910 | 6.7400 | 0.0055 | 0.6120 | 0.4428 | |
| 6.9-7.9 s | 0.2629 | 0.2650 | 7.9321 | 0.0101 | −0.0069 | 0.2650 | 3.7861 | 0.0394 | 0.0005 | 0.9825 | |
| 3 | 0.4-1.4 s | 0.2538 | 0.2572 | 7.6181 | 0.0114 | 0.7597 | 0.4733 | 9.4340 | 0.0012 | 8.6136 | 0.0079 |
| 1.5-2.5 s | 0.3315 | 0.1926 | 5.2482 | 0.0319 | 1.1642 | 0.4154 | 7.4597 | 0.0036 | 8.0011 | 0.0101 | |
| 6.9-7.9 s | 0.1193 | 0.0383 | 0.8751 | 0.3597 | 0.7456 | 0.1782 | 2.2775 | 0.1273 | 3.5774 | 0.0724 | |
| 4 | 0.4-1.4 s | 0.2832 | 0.3324 | 10.9516 | 0.0032 | 0.5298 | 0.4414 | 8.2962 | 0.0022 | 4.0984 | 0.0558 |
| 1.5-2.5 s | 0.3496 | 0.2078 | 5.7719 | 0.0252 | 0.9419 | 0.3493 | 5.6355 | 0.0110 | 4.5641 | 0.0446 | |
| 6.9-7.9 s | 0.2419 | 0.1673 | 4.4216 | 0.0472 | 0.5345 | 0.2440 | 3.3883 | 0.0530 | 2.1282 | 0.1594 | |
| 5 | 0.4-1.4 s | 0.1868 | 0.2069 | 5.7409 | 0.0255 | 0.4055 | 0.2983 | 4.4646 | 0.0242 | 2.7355 | 0.1130 |
| 1.5-2.5 s | 0.2637 | 0.1314 | 3.3267 | 0.0818 | 0.9150 | 0.2796 | 4.0749 | 0.0320 | 4.3209 | 0.0501 | |
| 6.9-7.9 s | 0.1806 | 0.0677 | 1.5974 | 0.2195 | 1.1463 | 0.3233 | 5.0172 | 0.0166 | 7.9336 | 0.0103 | |
| 6 | 0.4-1.4 s | 0.1481 | 0.1470 | 3.7920 | 0.0644 | 0.3733 | 0.2346 | 3.2188 | 0.0603 | 2.4037 | 0.1360 |
| 1.5-2.5 s | 0.2086 | 0.1295 | 3.2732 | 0.0841 | 0.8767 | 0.3439 | 5.5039 | 0.0120 | 6.8623 | 0.0160 | |
| 6.9-7.9 s | 0.1414 | 0.0544 | 1.2644 | 0.2729 | 1.1003 | 0.3631 | 5.9849 | 0.0088 | 10.1779 | 0.0044 | |
Figure 8.
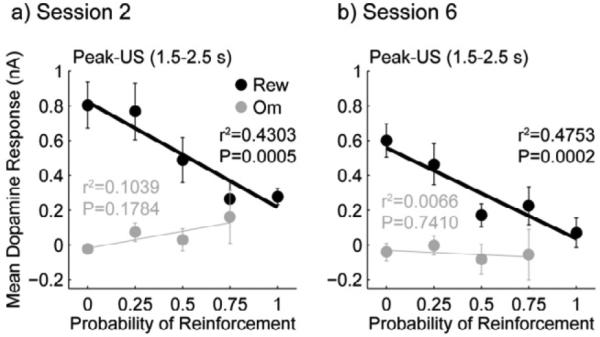
Group mean ± SEM for dopamine responses in the peak-US epoch are shown for reward and reward omission trials in sessions 2 (a) and session 6 (b). Linear regressions are significant for responses from reward trials for both sessions, but not for responses from omission trials.
History effect on CS-evoked dopamine responses
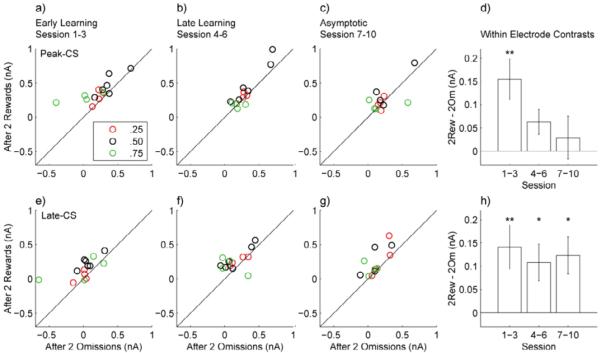
Within-electrode contrasts in CS-evoked dopamine responses between trials that followed two rewards and trials that followed two reward omissions showed that history effects reflected changes in reward probability rather than reward variance for both the peak-CS and late-CS time windows (Figure 9). The peak-CS time window had a significant contrast (Holm-Bonferroni corrected paired t-test t13 = 3.5414, P = 0.0036) for early learning but not for the late learning (Holm-Bonferroni corrected paired t-test t13 = 2.3377, P = 0.036) or asymptotic stages (Holm-Bonferroni corrected paired t-test t11= 0.6358, P = 0.5379). In contrast, the late-CS time window had significant contrasts for all three learning stages (Holm-Bonferroni corrected paired t-test: early: t13 = 3.0188, P = 0.0099, late: t13 = 2.7456, P = 0.0167, asymptotic: t11 = 3.0810, P = 0.0105). These effects were present even though data were combined between probability groups, for which runs of rewarded and omission trials would produce distinct and opposite effects on reward variance that would cancel out an overall effect.
Figure 9.
(a-c) Scatter plots show the mean dopamine response over the peak-CS epoch from trials following two rewards vs. the mean response from trials following two omissions from early learning (a), late learning (b), and asymptotic (c) stages for electrodes in uncertain probability groups. Points above the line indicate that the signal following two rewards is greater than the signal following two omissions. (d) Bar graph shows Mean ± SE of the difference for within electrode contrasts for the responses in a-c (early: n = 14, late: n = 14, asymptotic: n = 12). (f-g) Scatter plots and bar graph show the same data as a-d but for the late-CS epoch. (**: P < 0.01, *: P < 0.05 Paired t-test. Holm-Bonferroni correction was applied to α levels)
Discussion
Here, we used fast-scan cyclic voltammetry to record dopamine release in the nucleus accumbens core of rats during acquisition and maintenance of probabilistic Pavlovian conditioning. We report CS- and US-evoked phasic dopamine responses that confirm and expand upon the dopamine neuron firing rates reported by Fiorillo and colleagues (2003). We observed correlates of both EV and variance in phasic dopamine release that are dynamically modulated during learning differentially in three distinct time epochs following cue presentation: Early CS, Peak CS and Late (Sustained CS).
During this task there are at least two sources of uncertainty, that due to incomplete association between the CS and outcome during acquisition (learning uncertainty) and that due to probabilistic reward delivery that persists after the task has been acquired (probabilistic uncertainty). In the initial stages of learning the early and peak CS-evoked response reflect the developing estimate of EV. Prior to and during this stage, expectation of reward delivery is assumed to be low. Thus, in the p = 1 condition, surprise is maximal and decreases monotonically with decreasing probability. During this early period, uncertainty is determined by the degree to which reward delivery is surprising and, therefore, matches the reward rate. Indeed, CS-evoked dopamine release during all three time epochs matches this pattern. However, after learning, expectation of reward at p = 1 matches reward and uncertainty is zero. This is not the case with probabilistic conditions. The early CS-evoked response continued to match EV but the peak and sustained response correlated better with the variance of reward. Therefore, this profile of dopamine release is consistent with the encoding of uncertainty by sustained dopamine activity throughout acquisition and maintenance of the Pavlovian association. Peak CS-evoked dopamine responses to the CS were strongly modulated by both EV and variance, suggesting a blending of the signals. These findings suggest that the discrete coding of EV and variance observed in dopamine neuron firing rate in monkeys (Fiorillo et al. 2003) could give rise to a composite signal in the form of accumbens dopamine release through the slower time constants for uptake allowing diffusion associated with dopaminergic volume transmission (Garris et al. 1994).
In addition to correlates of EV and variance, we observed a negative correlate of PR in US-evoked dopamine release. This negative correlation is consistent with dopamine's hypothesized role as a reward-prediction-error signal and matches observations in monkeys (Schultz et al. 1997, Fiorillo et al. 2003, Nakahara et al. 2004, Bayer and Glimcher 2005, Bayer et al. 2007). The presence of significant correlations early in learning and a decrease in intercept but not slope between sessions two and six suggest that reward predictions are learned quickly, and that after extensive training on the task, rewards that occur within the task are not as unpredictable as when the animals are new to the task. The context of the behavioral chamber and its set of cues, such as the house light and fan noise, may modestly predict rewards within the behavioral task, so that reward-prediction-error signals are attenuated across all probabilities (Clark et al., 2013). We did not observe significant correlations between PR and dopamine release on omission trials. This finding is consistent with an imbalance in reward-prediction-error encoding by dopamine neurons reported by Bayer and Glimcher (2005).
This asymmetry of reward-prediction-error signals between the positive and negative domains provides the basis for the hypothesis that the origin of the sustained dopamine signal is the back-propagation of reward-prediction errors in subsequent trials giving a net-positive response even when averaging a balance between positive and negative reward-prediction errors (Niv et al., 2005). The pattern of signaling we observed does not falsify this hypothesis since across training, putative back-propagating reward-prediction errors should follow the neurochemical profile we observed as they reflect the occurrence of surprising outcomes in the reinforcement history.
While the encoding of uncertainty and the back-propagation of reward-prediction-error signals are closely correlated, one way to separate these phenomena is to examine history effects in the probabilistic conditions after learning has taken place, specifically by comparing dopamine release on trials that followed a string of rewards with those that followed a string of omissions. Under all probabilistic conditions (e.g. 0.25, 0.50, 0.75) sustained signals due to back-propagating reward-prediction errors should be larger for a history of a string of rewards than for a history of a string of omissions, making a contrast between these the two positive regardless of probability. Conversely, an objective variance signal would be expected to show contrasts between a string of rewards and a string of omissions that depend upon the probabilistic condition (i.e. opposite directions for the 0.25 and 0.75 groups). Indeed, variance is greatest for the 0.50 condition, and a string of rewards would move the local variance estimate toward this value under the 0.25 condition but not under the 0.75 condition. Further, a string of two omissions would move the local variance estimate toward 0.50 under the 0.75 but not the 0.25 condition. This is because when PR = 0.25, a run of two rewards would increase the variance of reward while a run of two omissions would slightly decrease the variance. These changes would result in a net contrast between the two conditions with the signal being slightly larger after two rewards than after two omissions. When PR = 0.75, the runs would have the opposite effects on variance, resulting in a net contrasts between the two conditions with the signal slightly larger after two omissions than after two rewards. When PR = 0.5, runs of either two rewards or two omissions should both slightly decrease reward variance, resulting in no net contrast between the two conditions. We show that the late-CS response is enhanced on trials following two rewards relative to trials following two omissions throughout all stages of the task. Importantly, this enhancement was present among members of all three probabilistic groups. The finding of a positive mean contrast with a larger signal after two rewards, therefore suggests that the signal is not a representation of reward variance within the task.
While this analysis is consistent with the prediction of back-propagating reward-prediction errors, other aspects of the current results are not consistent with the model in the form proposed by Niv et al. (2005). Specifically, in this model, the sustained response should not be evident in individual trials and only emerges as a function of signal averaging across trials. Nonetheless, the signal is clearly present on individual trials in our data. It is conceivable that the sustained signal takes its form because it is an average of dopamine released at the terminals of multiple neurons. Averaging the response of a single neuron across trials is often used as a proxy for the sum of the response from multiple neurons on a single trial. However, there is an important distinction between trial averaging and neuron averaging because the latter is a signal available to downstream networks in real time whereas the former is not (without long-term integration across trials). Therefore, in its current form, the Niv et al (2005) model suggests that the signal is essentially an artifact of signal averaging across multiple trials and would not be a useful biological signal accessible to downstream structures. In contrast, our data demonstrates that the persistent uncertainty-like signal is encoded by extracellular dopamine in the nucleus accumbens core.
As noted above, the sustained dopamine response does deviate from an objective uncertainty signal during local changes in reward variance within the task. However, it is interesting to speculate that the brain may use it as a proxy of uncertainty since it has good correlation with the longer-term average variance of reward. The use of such a proxy of a biologically important statistic of the environment is somewhat akin to using a cached value as an approximation of expected value. In both cases the information is immediately available to the agent without the need for online model-based calculations.
Acknowledgements
We thank Peter Dayan for feedback on an earlier version of the manuscript, and Scott Ng-Evans for technical assistance. This work was supported by NIH grants T32-DA007278 (ASH), R01-AA021121 (JJC), R01-DA027858 (PEMP), R01-AG044839 (PEMP) and R01-MH079292 (PEMP).
Footnotes
Publisher's Disclaimer: This is a PDF file of an unedited manuscript that has been accepted for publication. As a service to our customers we are providing this early version of the manuscript. The manuscript will undergo copyediting, typesetting, and review of the resulting proof before it is published in its final citable form. Please note that during the production process errors may be discovered which could affect the content, and all legal disclaimers that apply to the journal pertain.
References
- Bayer HM, Glimcher PW. Midbrain dopamine neurons encode a quantitative reward prediction error signal. Neuron. 2005;47:129–141. doi: 10.1016/j.neuron.2005.05.020. [DOI] [PMC free article] [PubMed] [Google Scholar]
- Bayer HM, Lau B, Glimcher PW. Statistics of midbrain dopamine neuron spike trains in the awake primate. J Neurophysiol. 2007;98:1428–1439. doi: 10.1152/jn.01140.2006. [DOI] [PubMed] [Google Scholar]
- Behrens TE, Woolrich MW, Walton ME, Rushworth MF. Learning the value of information in an uncertain world. Nat Neurosci. 2007;10:1214–1221. doi: 10.1038/nn1954. [DOI] [PubMed] [Google Scholar]
- Clark JJ, Collins AL, Sanford CA, Phillips PEM. Dopamine encoding of Pavlovian incentive stimuli diminishes with extended training. J Neurosci. 2013;33(8):3526–3532. doi: 10.1523/JNEUROSCI.5119-12.2013. [DOI] [PMC free article] [PubMed] [Google Scholar]
- Clark JJ, Sandberg SG, Wanat MJ, Gan JO, Horne EA, Hart AS, Akers CA, Parker JG, Willuhn I, Martinez V, Evans SB, Stella N, Phillips PEM. Chronic microsensors for longitudinal, subsecond dopamine detection in behaving animals. Nat Methods. 2010;7:126–129. doi: 10.1038/nmeth.1412. [DOI] [PMC free article] [PubMed] [Google Scholar]
- Fiorillo CD. Transient activation of midbrain dopamine neurons by reward risk. Neuroscience. 2011;197:162–171. doi: 10.1016/j.neuroscience.2011.09.037. [DOI] [PMC free article] [PubMed] [Google Scholar]
- Fiorillo CD, Tobler PN, Schultz W. Discrete coding of reward probability and uncertainty by dopamine neurons. Science. 2003;299:1898–1902. doi: 10.1126/science.1077349. [DOI] [PubMed] [Google Scholar]
- Fiorillo CD, Tobler PN, Schultz W. Evidence that the delay-period activity of dopamine neurons corresponds to reward uncertainty rather than backpropagating TD errors. Behav Brain Funct. 2005;1:7. doi: 10.1186/1744-9081-1-7. [DOI] [PMC free article] [PubMed] [Google Scholar]
- Flagel SB, Clark JJ, Robinson TE, Mayo L, Czuj A, Willuhn I, Akers CA, Clinton SM, Phillips PEM, Akil H. A selective role for dopamine in stimulus-reward learning. Nature. 2011;469:53–57. doi: 10.1038/nature09588. [DOI] [PMC free article] [PubMed] [Google Scholar]
- Gan JO, Walton ME, Phillips PEM. Dissociable cost and benefit encoding of future rewards by mesolimbic dopamine. Nat Neurosci. 2010;13:25–27. doi: 10.1038/nn.2460. [DOI] [PMC free article] [PubMed] [Google Scholar]
- Garris PA, Ciolkowski EL, Pastore P, Wightman RM. Efflux of dopamine from the synaptic cleft in the nucleus accumbens of the rat brain. J Neurosci. 1994;14:6084–6093. doi: 10.1523/JNEUROSCI.14-10-06084.1994. [DOI] [PMC free article] [PubMed] [Google Scholar]
- Jackson TE, Mudholkar GS. Control procedures for residuals associated with principal component analysis. Technometrics. 1979;21:341–349. [Google Scholar]
- Keithley RB, Heien ML, Wightman RM. Multivariate concentration determination using principal component regression with residual analysis. Trends Analyt Chem. 2009;28:1127–1136. doi: 10.1016/j.trac.2009.07.002. [DOI] [PMC free article] [PubMed] [Google Scholar]
- Ljungberg T, Apicella P, Schultz W. Responses of monkey dopamine neurons during learning of behavioral reactions. J Neurophysiol. 1992;67(1):145–163. doi: 10.1152/jn.1992.67.1.145. [DOI] [PubMed] [Google Scholar]
- Nakahara H, Itoh H, Kawagoe R, Takikawa Y, Hikosaka O. Dopamine neurons can represent context-dependent prediction error. Neuron. 2004;41:269–280. doi: 10.1016/s0896-6273(03)00869-9. [DOI] [PubMed] [Google Scholar]
- Nassar MR, Wilson RC, Heasly B, Gold JI. An approximately Bayesian delta-rule model explains the dynamics of belief updating in a changing environment. J Neurosci. 2010;30:12366–12378. doi: 10.1523/JNEUROSCI.0822-10.2010. [DOI] [PMC free article] [PubMed] [Google Scholar]
- Niv Y, Duff MO, Dayan P. Dopamine, uncertainty, and TD learning. Behav and Brain Funct. 2005;1:6. doi: 10.1186/1744-9081-1-6. [DOI] [PMC free article] [PubMed] [Google Scholar]
- Niv Y, Edlund JA, Dayan P, O'Doherty JP. Neural prediction errors reveal a risk-sensitive reinforcement-learning process in the human brain. J Neurosci. 2012;32:551–562. doi: 10.1523/JNEUROSCI.5498-10.2012. [DOI] [PMC free article] [PubMed] [Google Scholar]
- Pan WX, Schmidt R, Wickens JR, Hyland BI. Dopamine cells respond to predicted events during classical conditioning: evidence for eligibility traces in the reward-learning network. J Neurosci. 2005;25:6235–6242. doi: 10.1523/JNEUROSCI.1478-05.2005. [DOI] [PMC free article] [PubMed] [Google Scholar]
- Paxinos G, Watson C. The Rat Brain in Stereotaxic Coordinates. Ed 5. Elsevier Academic Press; London: 2005. [Google Scholar]
- Preuschoff K, Bossaerts P, Quartz SR. Neural differentiation of expected reward and risk in human subcortical structures. Neuron. 2006;51:381–390. doi: 10.1016/j.neuron.2006.06.024. [DOI] [PubMed] [Google Scholar]
- Rescorla RA, Wagner AR. A theory of Pavlovian conditioning: variations in the effectiveness of reinforcement and nonreinforcement. In: Black AH, Prokasy WF, editors. Classical Conditioning II: Current Research and Theory. Appleton-Century-Crofts; New York: 1972. pp. 64–99. [Google Scholar]
- Roesch MR, Calu DJ, Esber GR, Schoenbaum G. Neural correlates of variations in event processing during learning in basolateral amygdala. J Neurosci. 2010;30:2464–71. doi: 10.1523/JNEUROSCI.5781-09.2010. [DOI] [PMC free article] [PubMed] [Google Scholar]
- Schultz W, Dayan P, Montague PR. A neural substrate of prediction and reward. Science. 1997;275:1593–1599. doi: 10.1126/science.275.5306.1593. [DOI] [PubMed] [Google Scholar]
- Stuber GD, Klanker M, de Ridder B, Bowers MS, Joosten RN, Feenstra MG, Bonci A. Reward-predictive cues enhance excitatory synaptic strength onto midbrain dopamine neurons. Science. 2008;321(5896):1690–1692. doi: 10.1126/science.1160873. [DOI] [PMC free article] [PubMed] [Google Scholar]
- Sutton RS. Learning to predict by the methods of temporal differences. Machine Learning. 1988;3:9–44. [Google Scholar]
- Tobler PN, Fiorillo CD, Schultz W. Adaptive coding of reward value by dopamine neurons. Science. 2005;307:1642–1645. doi: 10.1126/science.1105370. [DOI] [PubMed] [Google Scholar]
- Waelti P, Dickinson A, Schultz W. Dopamine responses comply with basic assumptions of formal learning theory. Nature. 2001;412:43–48. doi: 10.1038/35083500. [DOI] [PubMed] [Google Scholar]


