Abstract
1,3,5-Trimethoxybenzene is a key component of the Chinese rose odor. This compound is synthesized in three successive methylation steps from phloroglucinol, the initial precursor. A novel, to our knowledge, phloroglucinol O-methyltransferase (POMT) characterized here methylates the first step to produce the intermediate 3,5-dihydroxyanisole, while two previously described orcinol O-methyltransferases catalyze the subsequent steps. We isolated POMT from rose petals and determined partial amino acid sequences of the purified enzyme. The full-length POMT cDNA was isolated and expressed in Escherichia coli. Both the native and recombinant POMT exhibited substrate specificity for phloroglucinol. POMT was expressed specifically in floral organs, in accordance with its role as a key enzyme in the synthesis of rose floral scent compounds.
Roses have been called the queen of flowers and are one of the economically most important groups of ornamental plants (Krussmann, 1981). More than 150 rose species and 20,000 cultivars have been registered (Cairns, 2000), most of which belong to the lineage of Chinese roses. These lines originated around 1752, when Chinese roses were first introduced to Europe and were bred for traits such as flower shape, recurrent flowering, and scent (Wylie, 1954). However, most modern roses lost their fragrance when breeding efforts focused on floral color and shape (Zuker et al., 1998).
Studies on rose floral scent have concentrated on its chemical composition (Watanabe et al., 1998). Roses emit three main classes of compounds: phenolic derivatives, terpenoids, and fatty acid derivatives (Flament et al., 1993). However, little is known about enzymes and genes responsible for the biosynthesis of these substances. Only recently, the rose has attracted the attention of molecular biologists because of its commercial value (Channeliere et al., 2002; Guterman et al., 2002; Lavid et al., 2002; Shalit et al., 2003). Roses have a relatively small genome (Yokoya et al., 2000) and thus are regarded good model species for genetic studies of scent production.
Rosa chinensis, the ancestor of modern roses (Rougetel, 1988), emits many scent compounds that are not present any more in most modern roses. In particular, 1,3,5-trimethoxybenzene (TMB) has been identified as a key component of the specific Chinese rose odor (Yomogida, 1992). This volatile is an effective sedative and has been used as a cosmetic additive (Shoji et al., 2000).
Floral scent plays a crucial role in both the attraction of pollinators and in the repellence of herbivores (Dobson et al., 1996). The ability to produce TMB as an attractant for pollinators is believed to have evolved in R. chinensis relatively recently (Wu et al., 2000). The biosynthesis pathway is thought to begin with phloroglucinol (PLG) and includes three methylation steps (Fig. 1). Many modern rose varieties synthesize a related compound, 3,5-dimethoxytoluene (Flament et al., 1993), from orcinol (3,5-dihydroxytoluene) by two successive methylations. The orcinol O-methyltransferases (OOMTs) responsible for these reactions have been characterized (Lavid et al., 2002; Scalliet et al., 2002). OOMTs can also carry out the last two methylation steps of TMB biosynthesis (Fig. 1), but they are incapable of efficiently methylating PLG, explaining the absence of TMB from the floral scent of modern rose varieties. Generally, little is known about the concentrations of the TMB precursors (PLG; 3,5-dihydroxyanisole [DHA]; and 3,5-dimethoxyphenol [DMP]) and the nature of the phloroglucinol O-methyltransferase (POMT) activity in rose flowers.
Figure 1.
Proposed biosynthetic pathway of TMB. A previously unknown, to our knowledge, POMT methylates PLG to produce DHA. The following steps to TMB via DHA and DMP are catalyzed by previously characterized OOMTs.
In this study, we purified and characterized a novel, to our knowledge, POMT from rose petals that encodes a protein which specifically methylates PLG to produce DHA, and characterized its biological role.
RESULTS
Purification of POMT from Rose Petals
In a previous study, we had established that crude enzyme extracts from rose petals contained high levels of PLG-directed O-methyltransferase (OMT) activity (Wu et al., 2003). Since this activity was strongest at flower stage 5 when petals begin to loosen, we extracted stage-5 rose petals. A typical purification scheme of such extracts is shown in Table I. We removed most contaminants by gel filtration (Sephadex G-25), ammonium sulfate precipitation, and anion-exchange chromatography on a Poros HQ column.
Table I.
Purification of POMT from petals of R. chinensis var. spontanea
| Purification Step | Total Protein | Total Activity | Specific Activity | Purification Ratio | Recovery |
|---|---|---|---|---|---|
| mg | pkat | pkat/mg protein | % | ||
| Crude extract Sephadex (G-25) | 31.06 | 72.00 | 2.32 | 1.00 | 100.00 |
| (NH4)2SO4 (30%–80%) | 10.78 | 24.80 | 2.30 | 0.99 | 34.44 |
| Poros HQ | 0.34 | 16.40 | 47.81 | 20.63 | 22.78 |
| Poros HQ | 0.19 | 13.00 | 67.71 | 29.21 | 18.06 |
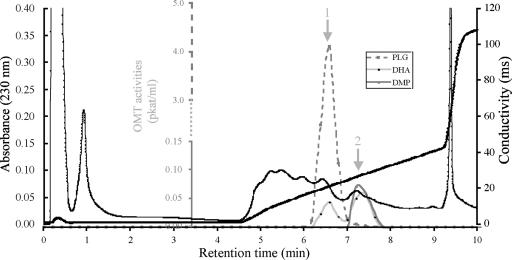
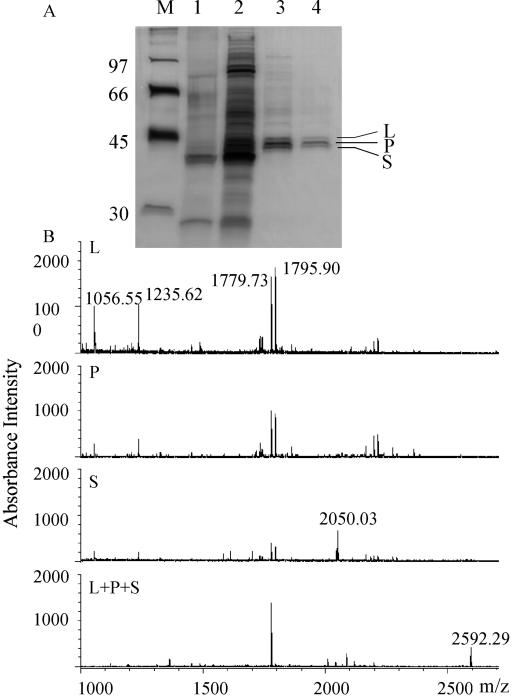
We monitored OMT activities acting on the three TMB precursors (PLG, DHA, and DMP; Fig. 1). Two classes of OMT activity were detected (Fig. 2). The first one (marked by arrow 1 in Fig. 2) showed a high specificity for PLG (4.1 pkat/mL) and a much smaller DHA-directed activity (0.066 pkat/mL). The second one (arrow 2) did not act on PLG, but on DHA and DMP (0.066 and 0.076 pkat/mL, respectively). We designated the PLG-methylating OMT activity, which produced DHA as POMT. SDS-PAGE of the purified POMT protein yielded one major (designated as P) and two weak bands (L for larger size band and S for smaller size band; Fig. 3A). We attempted further purification using S-adenosyl-l-Met (SAM) and PLG substrate affinity chromatography but were unable to obtain POMT as a single band.
Figure 2.
Elution of POMT from a Poros HQ column used for anion-exchange chromatography. Bound proteins were eluted in a 0- to 500-mm and 500- to 1,500-mm two-step linear NaCl gradient. The eluate was collected in 1-mL fractions; the flow rate was 6 mL min−1. OMT activities were assayed in each fraction using three substrates (PLG, DHA, and DMP); they are shown as gray lines (see legend in the inset). Note that activities are given at different scales for the substrates (the lower, solid part of the axis is valid for the substrates DHA and DMP, while the upper, dotted part refers to the substrate PLG). Total protein contents were monitored by measuring the A230. Two activity peaks are marked (arrows 1 and 2), one of which is highly specific for PLG (arrow 1).
Figure 3.
A, SDS-PAGE of POMT-active fractions after successive steps of purification. The gel was silver stained. M, Molecular mass markers (numbers on the left indicate molecular mass in in kD); 1, Protein after G-25 Sephadex filtration (approximately 150 ng); 2, Protein after ammonium sulfate precipitation (approximately 1,500 ng); 3, Protein after first Poros HQ fractionation (approximately 150 ng); 4, Protein after second Poros HQ fractionation (approximately 75 ng). Three bands designated L (44 kD), P (43 kD), and S (42 kD) remain after the completed purification procedure. B, MALDI reflector mass spectra of tryptic peptides obtained from either of three gel-purified putative POMT proteins (L, P, and S) or from a mixture (L + P + S).
The major POMT band (P) identified by SDS-PAGE had a molecular mass of about 43 kD (Fig. 3A). On the other hand, molecular mass determination of the native protein by HPLC gel filtration suggested a molecular mass of 86 kD (data not shown), indicating that native POMT is a dimeric enzyme.
We gel-purified the three bands obtained from SDS-PAGE and subjected them to tryptic digestion prior to matrix-assisted laser-desorption ionization time of flight mass spectrometry (MALDI-TOF-MS) analysis. Interestingly, digestion products of all bands gave very similar spectra (Fig. 3B). The spectra of band L and P were almost identical with major ion peaks at m/z 1,056.55, m/z 1,235.62, m/z 1,779.73, and m/z 1,795.90. Band S gave these peaks as well as an additional one at m/z 2,050.03. A mixture of all three bands yielded similar results, but m/z 1,779.73 became predominant while another major peak occurred at m/z 2,592.29. The similarity of the spectra suggested that the proteins of the L, P, and S bands were probably derived from one protein and differed only slightly in their degrees of hydrolysis or posttranslational modification.
Determination of Internal Amino Acid Sequences
The major fragments identified by MALDI-TOF-MS were subjected to de novo sequence determination. Three peptide sequences (Pep1, corresponding to m/z 1,056.55, was obtained from band L; Pep2 and Pep3, corresponding to m/z 1,779.73 and m/z 2,592.29, respectively, were obtained from the mixture of all bands) could be determined (Table II).
Table II.
Partial amino acid sequences from tryptic fragments of purified POMT
| Molecular Mass | Amino Acid Sequence | |
|---|---|---|
| D | ||
| Pep1 | 1,056 | NSNAPAVLDR |
| Pep2 | 1,778 | AYGMTAFEYPETDER |
| Pep3 | 2,592 | WFHL(I)NDAL(I)L(I)ENR??R |
Isolation of cDNA Encoding POMT
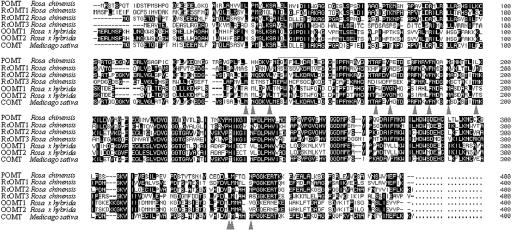
We designed a degenerate primer based on the sequence of Pep2 (Table II) for cDNA cloning, because this peptide was represented by a major peak in the MALDI-TOF-MS spectra of all three bands (Fig. 3B). The first partial clones were obtained by reverse transcription (RT)-PCR using this primer together with an oligo(dT) primer. The full-length cDNA was completed by 5′-RACE using specific primers designed on the basis of the obtained partial sequences. As a result, a sequence of 1,393 bp was determined that predicted 371 amino acids. All three partial sequences derived from de novo sequence determination (Table II) were included in the predicted protein sequence (Fig. 4).
Figure 4.
Sequence alignment of POMT with five other rose OMTs and one COMT from M. sativa (access codes: POMT, AB121046; RcOMT1, AB086103; RcOMT2, AB086104; RcOMT3, AB086105; OOMT1, AF502433; OOMT2, AF502434; and COMT, M63853). Squares highlight the three peptide sequences determined by MALDI-TOF-MS (compare Table II). Triangles indicate amino acids forming the substrate-binding site of the M. sativa COMT.
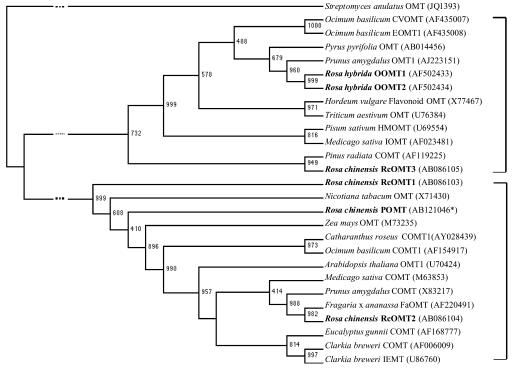
A database search revealed that POMT had 61% identity with caffeic acid 3-O-methyltransferase (COMT) of Prunus amygdalus (Suelves and Puigdomenech, 1998). An amino acid sequence-based phylogenetic tree of POMT and related OMTs showed a division into two major groups (Fig. 5). Group I mainly included flavonoid OMTs, while group II consisted mostly of COMTs. POMT was classified into the latter group.
Figure 5.
Neighbor-joining tree of POMT and other related OMTs obtained by the bootstrap method at the protein level. The numbers at the branching points are the bootstrap values indicating the confidence level for each branch based on 1,000 repeats. The Streptomyces anulatus OMT served as outgroup. OMT data were obtained from GenBank; access codes are given in parentheses. *, Nucleotide sequence data of the newly, to our knowledge, described POMT will appear in the DDBJ/EMBL/GenBank nucleotide sequence databases with the accession number shown.
RT-PCR analysis showed that POMT was specifically expressed in the floral organs, particularly in the petals. POMT transcripts were barely detectable in stamina and sepals and seemed absent from leaves (Fig. 6).
Figure 6.
RT-PCR analysis of the expression pattern of rose POMT. 26S rRNA was analyzed as a control. S4, S5, S6, and S7, Petals from flowering stages 4 to 7, respectively; ST, stamina at stage 6; SE, sepals at stage 6; LF, leaves; 10, 15, 20, and 25, number of PCR cycles. cDNAs of POMT (petals in stage 7) and 26S rRNA from stamina were used as templates.
Functional Analysis of POMT
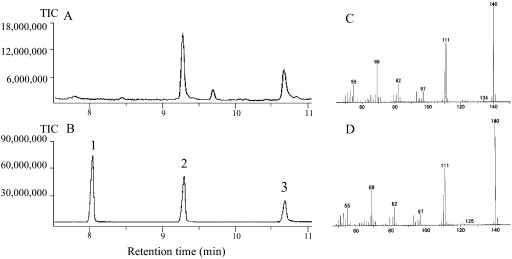
The POMT coding region was inserted into pET-32 and overexpressed in Escherichia coli. The fusion POMT purified on a nickel His-binding affinity column gave a single band with a molecular mass of about 60 kD (data not shown). After removing the 109-amino acid Trix-Tag by partial digestion with enterokinase, two bands with molecular masses of approximately 44 and 60 kD were obtained (data not shown). Further digestion caused hydrolysis of POMT. We therefore used the fusion POMT to investigate OMT activity. As shown in Figure 7, POMT specifically methylated PLG to yield DHA. Further methylation to form DMP was not observed.
Figure 7.
GC-MS analysis of products from the reactions catalyzed by recombinant POMT. A, Reaction using PLG as substrate. Reactions were allowed to proceed for 2 h in the presence of 2 μg purified POMT. B, Authentic chemicals. 1, DMP; 2, DHA; 3, PLG. C, Mass spectrum of the substance responsible for the peak in A which corresponds to peak 2 in B. D, Mass spectrum of authentic DHA (peak 2 in B).
Recombinant and native POMTs had similar substrate preferences (Table III). Both methylated only the meta-position hydroxyl group of polyphenol compounds. POMT specifically methylated PLG to produce DHA, while methylation rates of DHA and DMP were negligible and not detectable, respectively. POMT also methylated resorcinol and, to a lesser extent, orcinol, which is the precursor of the rose volatile dimethoxytoluene (Lavid et al., 2002; Scalliet et al., 2002). Nevertheless, the Km values of recombinant POMT with respect to PLG and SAM (94.5 and 16.2 μm, respectively) were significantly higher than those of the native POMT (14.4 and 1.9 μm, respectively; Table IV).
Table III.
Relative activity of purified native and recombinant POMTs with various substrates
The activity with PLG as a substrate was set to 100.
Table IV.
Kinetic parameters of purified native and recombinant POMT with PLG or SAM as substrate
| POMT (origin)
|
Km
|
Kcat
|
Kcat/Km
|
|||
|---|---|---|---|---|---|---|
|
μm
|
S−1 × 10⁻³
|
mm−1 × S−1
|
||||
| PLG | SAM | PLG | SAM | PLG | SAM | |
| Native | 14.40 ± 0.28 | 1.93 ± 0.16 | 4.49 ± 0.18 | 11.21 ± 0.54 | 0.31 | 5.81 |
| Cloned | 94.50 ± 3.78 | 16.15 ± 0.65 | 2.01 ± 0.08 | 5.46 ± 0.22 | 0.02 | 0.34 |
Analysis of the Intracellular Contents of TMB Precursors
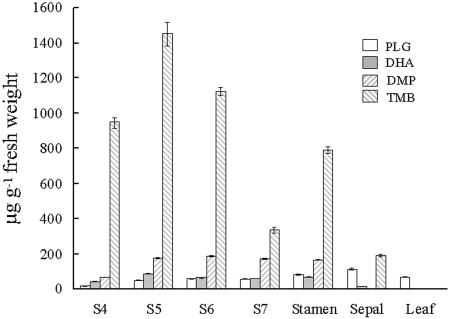
We determined the intracellular contents of volatile TMB and its precursors (PLG, DHA, and DMP) in petals at different flowering stages (S4–7), and in different organs at flowering stage 5 (Fig. 8). TMB was detected at high levels (up to a maximum of 1,451.5 μg g−1 fresh weight in petals at stage 5) in flower organs at all flowering stages examined. The three precursors were present at much lower levels. In petals, their variation with flowering stages showed no obvious correlation with the changes of TMB content (Fig. 8).
Figure 8.
Intracellular contents of TMB and its three precursors (PLG, DHA, and DMP) in petals at different flowering stages and in different floral organs during flowering stage 5. S4, S5, S6, and S7, petals at stages 4 to 7, respectively.
TMB and its immediate precursor DMP reached similar concentrations in stamina as in petals, while sepals contained much lower levels; only traces could be detected in leaves. DHA showed a similar pattern: relatively high levels in stamina and petals, but much lower concentrations in leaves and sepals. In contrast, the PLG contents of sepals and leaves were slightly higher than in petals; sepals actually contained the highest amounts of PLG per tissue fresh weight found in all organs tested.
DISCUSSION
Genomic approaches have facilitated the discovery of novel floral fragrance-related genes in rose (Guterman et al., 2002). For example, several homologous OOMTs involved in the biosynthesis of 3,5-dimethoxytoluene, a common volatile compound in rose, have been isolated and characterized (Lavid et al., 2002; Scalliet et al., 2002). OOMTs were also implicated in the final two methylation steps of the biosynthesis of TMB. However, the OMT responsible for the first methylation in this pathway remained unknown (Wu et al., 2003). We here describe the purification of this enzyme (POMT) and the isolation of the cDNA of its gene. This represents the first, to our knowledge, identification of an enzyme involved in the biosynthesis of rose floral scent compounds using protein purification methods.
POMT specifically methylated PLG to produce DHA (Table III; Fig. 7). Thus, two functionally distinct classes of OMTs cooperate in the synthesis of TMB: POMT methylates the initial precursor PLG to form the intermediate DHA, while the two previously known OOMTs catalyze the subsequent methylation steps. The origin of PLG in rose flower organs is not yet clear. It may be derived from cyclic polyketides (Bangera and Thomashow, 1999; Dewick, 2001), or might be formed through the decarboxylation of gallic acid (Haddock and Ferry, 1989; Laempe et al., 2001). Interestingly, significant levels of PLG were detected in all organs tested including leaves (Fig. 8). This indicates that a substantial PLG pool exists in vegetative tissues. PLG synthesis is probably further stimulated during flower development, as highest PLG contents were found in sepals (Fig. 8). In petals, this increased rate of PLG synthesis appears compensated for by extremely high POMT activities (Fig. 6), leading to lower PLG levels as compared to sepals (Fig. 8), which show negligible POMT activity (Fig. 6).
We found the highest levels of TMB in petals (Fig. 8), which are the main source of volatile fragrance compounds in rose (Dobson et al., 1990; Vainstein et al., 2001). Tissue TMB contents in different organs (Fig. 8) correlated roughly with the levels of POMT mRNA transcripts (Fig. 6). The slight deviations (TMB concentrations in petals were highest at flowering stage 5, while the highest transcript levels were detected at stages 6 and 7) are likely due to the rapid increase in volatile emission at stages 6 and 7 when petals unfold and expand. These findings support the idea that the POMT-catalyzed methylation of PLG is the rate-limiting key step in the biosynthesis of TMB.
POMT shares approximately 60% identity with COMT from P. amygdalus. Both enzymes catalyze the methylation of meta-position hydroxyl groups (Table III). However, POMT does not act on substrates such as ortho-catechol and 2-methoxyphenol whereas COMT does. Thus, the activity of POMT appears to be limited to the methylation of very small molecules such as PLG. Comparison of the amino acid sequences of rose POMT and Medicago sativa COMT, the crystal structure of which is known (Zubieta et al., 2001, 2002), indicates that 6 of the 11 amino acid positions involved in substrate binding in COMT are modified in POMT. An elucidation of the POMT molecular structure will reveal how these amino acid changes cause the shift in substrate specificity between COMT and POMT.
Native and recombinant POMTs showed similar relative activities with a variety of substrates (Table III). This indicated that we had cloned the genuine POMT gene. Intriguingly, the recombinant POMT had a 6-fold higher Km with respect to the substrate PLG than native POMT (Table IV). Since the recombinant fusion POMT was used in the kinetic assays, we suspect that the fused 109-amino acid Trix-Tag may have affected POMT structure and reduced its activity. Another ambiguity comes from the fact that the purified POMT activity appeared as three protein bands on SDS-PAGE gels (Fig. 3A), while the MS analysis suggested that all three bands represented the same protein. It is unclear whether the native POMT protein exists in several differentially modified versions, or whether there are three highly homologous isoenzymes. Our finding of only one single POMT cDNA clone supports the former explanation.
MATERIALS AND METHODS
Plant Material
Rosa chinensis Jacq. var. spontanea (Rehd. & Wils.) Yu & Ku red was grown at the experimental farm of Keisei Rose Nursery (Chiba, Japan) under natural conditions. R. chinensis var. spontanea produces flowers from mid-April until mid-May in Chiba. Flower stages were defined as described before (Wu et al., 2003).
Enzyme Extraction
Extraction and purification procedures were carried out at 4°C, except as noted. Ten grams of rose petals in stage 5 were frozen in liquid nitrogen and ground using a mortar and pestle. The ground powder was mixed with 50 mL buffer A (100 mm potassium-phosphate buffer, pH 7.0, 10% (w/v) glycerol, 1 mm dithiothreitol) and 0.1% (v/v) mercaptoethanol containing 200 mg sodium ascorbate and 2 g polyvinylpyrrolidone (PVP-40). The resulting slurry was mixed and then centrifuged at 20,000g for 20 min. The pellet was discarded, and the supernatant was used as a crude enzyme extract.
POMT Enzyme Activity
Enzyme assays were performed in order to monitor POMT elution during purification. The standard reaction mixture consisted of 30 μL of any given fraction, 5 μL of 1 m Tris-HCl (pH 7.4), 0.5 μL of 1 m DTT, 5 μL glycerol, 1 μL S-adenosyl-l-[methyl-14C]Met (40–60 mCi/mmol), 2 μL of 5 mm substrate (each of PLG, DHA, or DMP), and 6.5 μL water to bring the assay volume to 50 μL.
The reaction mixture was incubated at 30°C for 30 min, and 5 μL of 50% acetic acid were added to stop the reaction. The radiolabeled product was extracted by addition of 80 μL of ethyl acetate. A 40-μL aliquot of the organic phase was applied to a thin-layer chromatography plate precoated with silica gel 60 F254 (Merck, Darmstadt, Germany), and the chromatography was run with 1:1 (v/v) CHCl3:EtOAc. An x-ray imaging plate (BAS-MS2025, Fuji Photo Film, Tokyo) was exposed to the thin-layer chromatography plate, and the radioactive products were visualized using a molecular imaging FX system (Bio-Rad Laboratories, Hercules, CA). Enzyme activities were independently checked by gas chromatography (GC)-MS; reaction conditions were as described except that 5 μL of 5 mm nonlabeled SAM was used instead of the 14C-labeled compound. The extracted organic phase was concentrated to a volume of 20 μL under a stream of nitrogen before being analyzed by a QP5000 GC-MS system (Shimadzu, Kyoto).
Protein Purification
Fifty milliliters of crude extract were loaded onto a Sephadex column (G-25, 30 cm × 5 cm) equilibrated with buffer B (buffer A with 0.15 m NaCl) and were eluted with buffer B. In total, 50 elution fractions of 2 mL each were collected. All fractions with significant PLG-methylation OMT activity (approximately 75 mL in total) were combined and subjected to ammonium sulfate precipitation (between 30% and 80% saturation). The precipitate was collected by centrifugation. The pellet was resuspended in buffer C (20 mm Tris-HCl, pH 7.4, 10% glycerol, 1 mm DTT), dialyzed in buffer C and concentrated to a volume of 3 mL. The samples (1 mL for each chromatography run; three runs in total) were applied to a Poros HQ column (1.7 mL bed volume; PerSeptive Biosystems, Tokyo) preequilibrated with buffer C, which was attached to an FPLC apparatus (Perseptive Biosystems, Tokyo). The flow rate was set to 6 mL min−1. After washing with 15 bed volumes (25.5 mL) of buffer D (20 mm Tris HCl, pH 7.4), bound proteins were eluted with an NaCl concentration gradient (0–500 mm) in 15 bed volumes of buffer D. The column was finally washed with 1.5 m NaCl in 5 bed volumes of buffer D. One-milliliter elution fractions were collected, and a total of 51 fractions were obtained. Each fraction was analyzed for OMT activity with three different substrates (PLG, DHA, and DMP). Three fractions with particularly high PLG-methylation activity were combined and dialyzed in buffer C and were then subjected to another round of Poros HQ column chromatography as described above. The resulting active fractions were dialyzed in buffer C and concentrated to a volume of 1 mL.
Molecular Mass Determination
The molecular mass of the native POMT protein was determined by HPLC gel filtration on a TSK-gel G3000SW column (TOSOH, Tokyo). Glutamate dehydroxygenase (290 kD), lactate dehydroxygenase (142 kD), enolase (67 kD), myokinase (32 kD), and cytochrome c (12.4 kD; Oriental Yeast, Tokyo) were used as markers.
Partial Amino Acid Sequence Determination
HQ-column-purified fractions were subjected to 10% SDS-PAGE. Three silver-stained bands were excised for TOF-MS analysis. In-gel purification and digestion with trypsin (Roche Diagnostics, Mannheim, Germany) were carried out using the protocols of Shevchenko et al. (1996). The trypsin-treated extractions were analyzed by MALDI-TOF-MS, and the major peaks were further analyzed by de novo sequencing (Autoflex ultra TOF/TOF, Bruker Daltonics K.K., Tokyo).
cDNA Cloning
RNA extraction and cDNA amplification were conducted using rose petals in flower stage 5, as previously described (Wu et al., 2003). First-strand cDNA was prepared by Reverse Transcriptase (Invitrogen, Carlsbad, CA) with the oligo(dT) primer RACE32 (5′-GGCCACGCGTCGACTAGTACTTTTTTTTTTTTTTTTT-3′; Frohman et al., 1988). PCR of the POMT sequence was carried out with a degenerate primer (5′-TTYGARTAYCCNGARACNGAYGA-3′) based on the Pep2 sequence (Table II) and RACE17 (5′-GGCCACGCGTCGACTAGTAC-3′). Full-length POMT cDNA was obtained by the 5′-RACE method (Frohman et al., 1988).
Expression and Purification of Recombinant Protein
For expression in Escherichia coli, the protein coding regions were amplified with primers corresponding to the N and C termini in which a restriction enzyme site was included. These primers were: POMT-N (5′AGTCGTGGATCCAGGAGCACAAGTCCCCAGA-3′, sense primer; BamHI site in italics) and POMT-C (5′-AGGATTAAGCTTTTTGTGGAACTCCATGAC-3′, anti-sense primer; HindIII site in italics). The BamHI/HindIII fragments were inserted into a pET-32 (a) vector (Invitrogen) and transformed into E. coli BL21(DE3). The crude overexpressed proteins were extracted from cells with an ultrasonic disruptor (UD-201, Tomy, Tokyo) and were purified with a Chelating Sepharose Fast Flow column (Amersham Biosciences, Piscataway, NJ). The protein concentration was determined by the Bradford method using bovine serum albumin as a standard (Bradford, 1976).
Functional Identification of Native and Recombinant POMTs
Substrate preference and relative activity toward various phenolic compounds including the three TMB precursors (PLG, DHA, and DMP) was investigated for both native and recombinant POMTs (Table III). Conditions were as described above except that the enzyme concentration and incubation time were adjusted to ensure a linear reaction velocity during the reaction period. Three independent experiments were performed. Km and Kcat/Km were determined as described previously (Wu et al., 2003). To determine Km for the substrate PLG, PLG concentrations were varied between 20 μm and 0.5 mm, while SAM was kept at a saturated level. To determine the Km for the substrate SAM, the concentration of SAM was varied from 0.5 to 50 μm, while PLG was kept at 0.5 mm. Km and Kcat values were calculated from Lineweaver-Burk plots. All data shown are from three independent experiments.
Quantitative Analysis of mRNA Transcripts
The nonradioisotopic quantitative RT-PCR method was used to determine mRNA levels in different rose organs (Yokoi et al., 1993). mRNA was prepared from various floral organs and leaves as described previously (Wu et al., 2003). The primers 3UT-S (AGA GTA CGA GGC ATT GGC ACT) and 3UT-A (ATC AAA CAA GGA GAA ACA GAC G) were used for the amplification of the 3′-untranscribed region of the POMT cDNA. 26S rRNA served as a control. PCR amplification was carried out in 20 cycles, each consisting of denaturation at 94°C for 60 s, annealing at 60°C for 30 s, and extension at 72°C for 30 s. The amount of cDNA used as a template was adjusted so that the final products were in the phase of logarithmic linear increase after 20 cycles. PCR products were separated on an agarose gel, stained with ethidium bromide, and scanned on a molecular imaging FX system (Bio-Rad Laboratories).
Analysis of Volatiles
Petals (100 mg) at different flowering stages and of different organs at flowering stage 5 were ground in liquid nitrogen and extracted with EtOAc. The extracts were concentrated and analyzed as previously described (Oka et al., 1999).
Sequence data from this article have been deposited with the EMBL/GenBank data libraries under accession number AB121046.
Acknowledgments
We thank Satoi Kasai of Bruker Daltonics K.K. (Tokyo) for amino acid sequence determination. We also thank Prof. Eran Pichersky of the University of Michigan (Ann Arbor, MI) for discussion and for providing 3-methoxy, 5-hydroxytoluene. We are grateful to Shunsuke Takeuchi of Keisei Rose Nursery for providing the plant materials used in this study.
This work was supported by the Japan Society for the Promotion of Science (JSPS) and a Grant-in-Aid for Scientific Research (grant no. 14360016).
Article, publication date, and citation information can be found at www.plantphysiol.org/cgi/doi/10.1104/pp.103.037051.
References
- Bangera MG, Thomashow LS (1999) Identification and characterization of a gene cluster for synthesis of the polyketide antibiotic 2,4-diacetylphloroglucinol from Pseudomonas fluorescens Q2-87. J Bacteriol 181: 3155–3163 [DOI] [PMC free article] [PubMed] [Google Scholar]
- Bradford MM (1976) A rapid and sensitive method for the quantitation of microgram quantities of protein utilizing the principle of protein-dye binding. Anal Biochem 72: 248–254 [DOI] [PubMed] [Google Scholar]
- Cairns T (2000) Modern Roses XI. Academic Press, San Diego
- Channeliere S, Riviere S, Scalliet G, Jullien F, Szecsi J, Dolle C, Vergne P, Dumas C, Bendahmane M, Hugueney P, et al. (2002) Analysis of gene expression in rose petals using expressed sequence tags. FEBS Lett 515: 35–38 [DOI] [PubMed] [Google Scholar]
- Dewick PM (2001) Aromatic polyketides. In Medicinal Natural Products. A Biosynthetic Approach. John Wiley & Sons, Chichester, UK, pp 61–62
- Dobson HEM, Bergstroem G, Groth I (1990) Differences in fragrance chemistry between flower parts of Rosa rugosa Thunb. (Rosaceae). Isr J Bot 39: 143–156 [Google Scholar]
- Dobson HEM, Groth I, Bergstrom G (1996) Pollen advertisement: chemical contrasts between whole flower and pollen odors. Am J Bot 83: 877–885 [Google Scholar]
- Flament I Debonneville C, Furrer A (1993) Volatile constituents of roses: characterization of cultivars based on the headspace analysis of living flower emissions. In R Teranishi, RG Buttery, H Sugisawa, eds, Bioactive Volatile Compounds from Plants. American Chemical Society, Washington, DC, pp 269–281
- Frohman MA, Dush MK, Martin GR (1988) Rapid production of full-length cDNAs from rare transcripts: Amplification using a single gene-specific oligonucleotide primer. Proc Natl Acad Sci USA 85: 8998–9002 [DOI] [PMC free article] [PubMed] [Google Scholar]
- Guterman I, Shalit M, Menda N, Piestun D, Dafny-Yelin M, Shalev G, Bar E, Davydov O, Ovadis M, Emanuel M, et al. (2002) Rose scent: genomics approach to discovering novel floral fragrance-related genes. Plant Cell 14: 2325–2338 [DOI] [PMC free article] [PubMed] [Google Scholar]
- Haddock JD, Ferry JG (1989) Purification and properties of phloroglucinol reductase from Eubacterium oxidoreducens G-41. J Biol Chem 264: 4423–4427 [PubMed] [Google Scholar]
- Krussmann G (1981) The history of the modern garden rose. In The Complete Book of Roses. Timber Press, Portland, OR, pp 67–105
- Laempe D, Jahn M, Breese K, Schagger H, Fuchs G (2001) Anaerobic metabolism of 3-hydroxybenzoate by the denitrifying bacterium Thauera aromatica. J Bacteriol 183: 968–969 [DOI] [PMC free article] [PubMed] [Google Scholar]
- Lavid N, Wang J, Shalit M, Guterman I, Bar E, Beuerle T, Menda N, Shafir S, Zamir D, Adam Z, et al. (2002) O-methyltransferases involved in the biosynthesis of volatile phenolic derivatives in rose petals. Plant Physiol 129: 1899–1907 [DOI] [PMC free article] [PubMed] [Google Scholar]
- Oka N, Ohishi H, Hatano T, Hornberger M, Sakata K, Watanabe N (1999) Aroma evolution during flower opening in Rosa damascena Mill. Z Naturforsch Sect C Biosci 54c: 889–895 [Google Scholar]
- Rougetel HL (1988) Chinese ancestors and their descendants. In A Heritage of Roses. Unwin Hyman, London, pp 42–50
- Scalliet G, Journot N, Jullien F, Baudino S, Magnard JL, Channeliere S, Vergne P, Durmas C, Bendahmane M, Cock JM, et al. (2002) Biosynthesis of the major scent components 3,5-dimethoxytoluene and 1,3,5-trimethoxybenzene by novel rose O-methyltransferases. FEBS Lett 523: 113–118 [DOI] [PubMed] [Google Scholar]
- Shalit M, Guterman I, Volpin H, Bar E, Tamari T, Menda N, Adama Z, Zamir D, Adam Z, Vainstein A, et al. (2003) Volatile ester formation in roses. Identification of an acetyl-coenzyme A. Geraniol/citronellol acetyltransferase in developing rose petals. Plant Physiol 131: 1868–1876 [DOI] [PMC free article] [PubMed] [Google Scholar]
- Shevchenko A, Wilm M, Vorm O, Mann M (1996) Mass spectrometric sequencing of proteins from silver-stained polyacrylamide gels. Anal Chem 68: 850–858 [DOI] [PubMed] [Google Scholar]
- Shoji K, Takeshi M, Joichi A, Yomogida K (2000) Sedative for vaporizing inhalation and sedative perfume composition containing the same as active ingredient. Japan Patent Gazette, JP,2000-086478,A. Japan Patent Office, Tokyo
- Suelves M, Puigdomenech P (1998) Specific mRNA accumulation of a gene coding for an O-methyltransferase in almond (Prunus amygdalus, Batsch) flower tissues. Plant Sci 134: 79–88 [Google Scholar]
- Vainstein A, Lewinsohn E, Pichersky E, Weiss D (2001) Floral fragrance: new inroads into an old commodity. Plant Physiol 127: 1383–1389 [PMC free article] [PubMed] [Google Scholar]
- Watanabe N, Washio H, Straubinger M, Knapp H, Winterhalter P (1998) Occurrence of a glucosidic progenitor of rose oxide in rose flowers, Rosa damascena Mill. Nat Prod Lett 12: 5–10 [Google Scholar]
- Wu S, Ueda Y, He H, Nishihara S, Matsumoto S (2000) Phylogenetic analysis of Japanese Rosa species using matK sequences. Breed Sci 50: 275–281 [Google Scholar]
- Wu S, Watanabe N, Mita S, Ueda Y, Shibuya M, Ebizuka Y (2003) Two O-methyltransferases isolated from flower petals of Rosa chinensis var. spontanea involved in scent biosynthesis. J Biosci Bioeng 96: 119–128 [PubMed] [Google Scholar]
- Wylie AP (1954) The history of garden roses (Part I). J R Hortic Soc 79: 555–571 [Google Scholar]
- Yokoi H, Natsuyama S, Iwai M, Noda Y, Mori T, Mori KJ, Fujita K, Nakayama H, Fujita J (1993) Non-radioisotopic quantitative RT-PCR to detect changes in mRNA levels during early mouse embryo development. Biochem Biophys Res Commun 195: 769–775 [DOI] [PubMed] [Google Scholar]
- Yokoya K, Roberts AV, Mottley J, Lewis R, Brandham PE (2000) Nuclear DNA amounts in roses. Ann Bot (Lond) 85: 557–561 [Google Scholar]
- Yomogida K (1992) Scent of modern roses. Koryo 175: 65–89 [Google Scholar]
- Zubieta C, He XZ, Dixon RA, Noel JP (2001) Structures of two natural product methyltransferases reveal the basis for substrate specificity in plant O-methyltransferase. Nat Struct Biol 8: 271–279 [DOI] [PubMed] [Google Scholar]
- Zubieta C, Kota P, Ferrer J, Dixon RA, Noel JP (2002) Structural basis for the modulation of lignin monomer methylation by caffeic acid/5-hydroxyferulic acid 3/5-O-methyltransferase. Plant Cell 14: 1265–1277 [DOI] [PMC free article] [PubMed] [Google Scholar]
- Zuker A, Tzfira T, Vainstein A (1998) Cut-flower improvement using genetic engineering. Biotechnol Adv 16: 33–79 [DOI] [PubMed] [Google Scholar]


