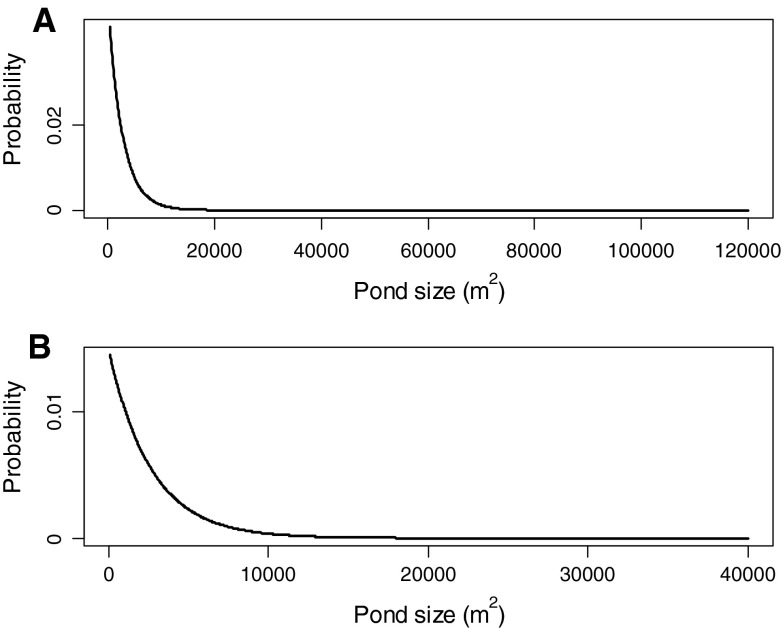
Fig. 1.
Distributions of pond sizes associated with the populations in the southern hemisphere (a) and northern hemisphere (b) used in this analysis. Minimum pond sizes were 300 and 50 m2, respectively, while the upper limit of pond size for each distribution is denoted by the largest tick mark (see text)

