

Abstract
In conscious mammals, hypoxia or hypercapnia stimulates breathing while theoretically exerting opposite effects on central respiratory chemoreceptors (CRCs). We tested this theory by examining how hypoxia and hypercapnia change the activity of the retrotrapezoid nucleus (RTN), a putative CRC and chemoreflex integrator. Archaerhodopsin-(Arch)-transduced RTN neurons were reversibly silenced by light in anesthetized rats. We bilaterally transduced RTN and nearby C1 neurons with Arch (PRSx8-ArchT-EYFP-LVV) and measured the cardiorespiratory consequences of Arch activation (10 s) in conscious rats during normoxia, hypoxia, or hyperoxia. RTN photoinhibition reduced breathing equally during non-REM sleep and quiet wake. Compared with normoxia, the breathing frequency reduction (ΔfR) was larger in hyperoxia (65% FiO2), smaller in 15% FiO2, and absent in 12% FiO2. Tidal volume changes (ΔVT) followed the same trend. The effect of hypoxia on ΔfR was not arousal-dependent but was reversed by reacidifying the blood (acetazolamide; 3% FiCO2). ΔfR was highly correlated with arterial pH up to arterial pH (pHa) 7.5 with no frequency inhibition occurring above pHa 7.53. Blood pressure was minimally reduced suggesting that C1 neurons were very modestly inhibited. In conclusion, RTN neurons regulate eupneic breathing about equally during both sleep and wake. RTN neurons are the first putative CRCs demonstrably silenced by hypocapnic hypoxia in conscious mammals. RTN neurons are silent above pHa 7.5 and increasingly active below this value. During hyperoxia, RTN activation maintains breathing despite the inactivity of the carotid bodies. Finally, during hypocapnic hypoxia, carotid body stimulation increases breathing frequency via pathways that bypass RTN.
Keywords: Archaerhodopsin, chemoreflex, medulla oblongata, optogenetics, Phox2b, ventrolateral medulla
Introduction
Feedback regulation of breathing by CO2 and O2 operates via the carotid bodies (CBs), which respond to hypoxia in an acid-dependent manner and via central respiratory chemoreceptors (CRCs) that detect brain PCO2/pH (Takakura et al., 2006; Guyenet et al., 2010; Smith et al., 2010; Huckstepp and Dale, 2011; Kumar and Prabhakar, 2012). Usually, CBs and CRCs work in concert to either stimulate or inhibit breathing because arterial PO2 and brain PCO2 vary in opposite directions when lung ventilation changes. In a hypoxic environment, however, the CBs are selectively activated and the resulting hyperventilation causes respiratory alkalosis and CRCs are thought to be inhibited (Gesell et al., 1940). In reality, however, no CRC candidate (e.g., astrocytes, retrotrapezoid nucleus [RTN], serotonergic, orexinergic, and/or locus ceruleus neurons) has ever been shown to be inhibited by hypocapnic hypoxia. Hypocapnic hypoxia commonly produces sleep-disrupted breathing, a condition that improves with CO2 supplementation or acetazolamide administration (Peña and García, 2006; Bell and Haouzi, 2010; Ainslie et al., 2013; Javaheri and Dempsey, 2013).
Hyperoxia, widely used therapeutically, reduces CB activity, which causes an immediate but transient breathing reduction (Dejours et al., 1955). At steady state, hyperoxia causes a small hypoventilation in rodents or slight hyperventilation in humans, the latter being tentatively attributed to excess CRC activation via cerebral blood flow reduction and other mechanisms (Olson et al., 1988; Becker et al., 1996; Ainslie and Duffin, 2009; Chowdhuri et al., 2010). The notion that CRCs are activated by hyperoxia also remains unsubstantiated.
RTN is a prominent CRC candidate (Smith et al., 1989; Guyenet et al., 2010; Nattie, 2011). Although RTN neurons are intrinsically pH-sensitive, they also respond to acidification via surrounding astrocytes and receive synaptic inputs from additional presumptive CRCs (Mulkey et al., 2004; Gourine et al., 2010; Wang et al., 2013a, b). RTN innervates the respiratory pattern generator, and its selective stimulation activates breathing massively (Abbott et al., 2009b, 2011). RTN therefore may operate both as a CRC and central respiratory chemoreflex integrator.
The present experiments had three objectives: (1) to determine whether RTN regulates breathing at rest; (2) to test whether RTN neurons are silenced during hypocapnic hypoxia in conscious rats (i.e., whether RTN conforms to existing predictions regarding how CRCs should behave under hypoxic conditions); and (3) to determine how RTN neurons regulate breathing during hyperoxia. RTN neurons are located close to the ventral medullary surface and are thinly distributed (Stornetta et al., 2006), which precludes unit recording in conscious animals. Fos can be used to gauge RTN activity, but this approach is insensitive and restricted to long-lasting perturbations (Sato et al., 1992; Teppema et al., 1997; Fortuna et al., 2009). To assess RTN neuron activity, we monitored the degree of hypoventilation elicited by briefly inhibiting these neurons using Archaerhodopsin (Arch)-based optogenetics (Chow et al., 2010). This method allowed us to quantify the instantaneous contribution of RTN neurons to ventilation with minimal interference from homeostatic regulations because of the slow time constant of the chemoreflexes.
Materials and Methods
Animals.
Experiments were performed on male Sprague Dawley rats (N = 27; 400–550 g, Taconic). All procedures conformed to the National Institutes of Health Guide for the Care and Use of Laboratory Animals and were approved by the University of Virginia Animal Care and Use Committee. Animals were housed under standard 12 h light/dark cycle with ad libitum access to food and water.
Viral constructs and virus preparation.
For single-unit experiments in anesthetized rats, we used an adeno-associated viral vector (AAV) that expresses the photoactivatable proton pump Arch-3 fused to EYFP under the control of the pan-neuronal synapsin promoter (AAV-hSyn-eArch3.0-EYFP serotype 2) (Chow et al., 2010). For the experiments on conscious rats, we used a lentiviral vector (LVV) that expresses ArchT3.0, a more light-sensitive version of Arch-3 (Han et al., 2011; Mattis et al., 2012) under the Phox2-responsive promoter PRSx8 (pLenti-PRSX8 eArchT3.0-EYFP) (Hwang et al., 2001). We synthesized the PRSx8-ArchT3.0-EYFP construct by substituting the PRSx8 promoter (kindly provided by M. Raizada, University of Florida, Gainesville, Florida) for the CaMKIIα promoter present in the pLenti CaMKIIα eArchT 3.0 EYFP construct (courtesy of K. Deisseroth via Addgene). In a few experiments on conscious rats, we also used an already described LVV encoding the photoactivatable cation channel channelrhodopsin-2 (ChR2, H134R) fused to mCherry (PRSx8-ChR2-mCherry) (Abbott et al., 2009a, b). Viral vectors (AAV2 and LVV) were produced by the University of North Carolina virus core. The AAV2 was used at a concentration of 3.0 × 10¹² viral particles per milliliter. Both LVVs were used at a concentration of 3.0 × 10⁸ viral particles per milliliter.
Injections of vectors and animal instrumentation.
Rats were anesthetized with a mixture of ketamine (75 mg/kg), xylazine (5 mg/kg), and acepromazine (1 mg/kg) given intraperitoneally. Depth of anesthesia was assessed by an absence of the corneal and hind-paw withdrawal reflexes. Additional anesthetic was administered when necessary (25% of the original dose, i.p. or i.m. during surgery). Body temperature was kept close to 37°C with a servo-controlled heating pad and a blanket. All surgical procedures were performed under aseptic conditions.
The vectors were injected into RTN using electrophysiological landmarks as follows. The mandibular branch of the facial nerve was exposed on the left side or on both sides as needed. The rat was then placed prone on a stereotaxic apparatus (bite bar set at −3.0 mm for flat skull; David Kopf Instruments). A 1.5-mm-diameter hole was drilled into the occipital plate on the left side or both sides caudal to the parieto-occipital suture. Viral vectors were loaded into a 1.2 mm internal diameter glass pipette broken to a 25 μm tip (external diameter). The lower edge of the facial motor nucleus was identified using antidromic field potentials evoked by facial nerve stimulation (0.1 ms, 0.2–0.8 mA) (Brown and Guyenet, 1985), and the vector was ejected by pressure 100–200 μm below this level where RTN neurons reside.
ArchT3.0 LVV was injected bilaterally into three rostrocaudally aligned sites separated by 200 μm (total volume 400–600 nl/side). Mean stereotaxic coordinates were 2.1–2.7 mm caudal to lambda, 2 mm lateral to the midline, and 8.6 mm below the cerebellar surface. The most caudal site was located under the caudal end of the facial motor nucleus. We then implanted optical fibers for light stimulation plus electrodes to record the EEG and neck EMG. For EEG recordings, stainless steel jeweler screws (Plastics One) were implanted extradurally (0.5–1 mm anterior, 1 mm lateral to bregma and 3 mm posterior, 2–2.5 mm lateral to bregma above the contralateral hemisphere). One additional screw was implanted for structural support of the head stage and for grounding. Teflon-coated braided stainless steel wire (A-M Systems) was stripped at the tip and wrapped around the implanted screws. Two additional wires were stripped at the tips and implanted in the superficial muscles of the neck for EMG recordings of postural activity. All wires were crimped to amphenol pins (A-M Systems) and inserted into a plastic head stage (Plastics One). Optical fibers (200 μm, numerical aperture-0.39; Thorlabs) were fitted with ferrules as described previously (Sparta et al., 2012) and implanted into the ventrolateral medulla (tips 0.5–0.8 mm dorsal to the vector injection site). The head stage and optic fiber-ferrule assemblies were secured to the skull using a two part epoxy (Loctite). Incisions were then closed in two layers (muscle and skin) with absorbable sutures and vet bond adhesive. Rats received postoperative ampicillin (125 mg/kg, i.p.) and ketoprofen (3–5 mg/kg, subcutaneously) and were monitored daily. Rats recovered for a minimum of 4 weeks for functional expression of the opsins. A subset of animals were then implanted with radio-telemetry probes (PA-C10, Data Sciences International) to record blood pressure (BP) from the descending aorta via the right femoral artery. These rats recovered for yet another week before physiological experiments began. A second cohort of rats (N = 6) were catheterized for arterial blood gas measurements in conscious whole-body plethysmography (for detailed methods, see Jespersen et al., 2012).
In six rats, ChR2-expressing LVV was injected unilaterally on the left side (two 100–140 nl injections separated by 200 μm). These rats were then instrumented in the same way as those that had received injections of ArchT-expressing vector (EMG, EEG, fiber optic), except that a single optical fiber was implanted, on the left side. Four rats received a left side only injection of AAV2-hSyn-eArch3.0-EYFP into RTN (two 100–140 nl injections separated by 200 μm). These rats had no additional surgical procedure. Postsurgical treatment for these two groups was as described above.
RTN unit recordings in anesthetized rats.
These experiments were designed to ascertain that Arch-transduced RTN neurons were inhibited by 532 nm wavelength (green) light from a laser delivered through an optical fiber in vivo in their vicinity. These optogenetic experiments were modeled after prior ones in which we tested the light sensitivity of ChR2-transduced RTN neurons (Abbott et al., 2009b). Briefly, 4 rats received injections of AAV-hSyn-eArch3.0-EYFP serotype 2 into the left RTN. Five weeks later, rats were anesthetized with isoflurane (5% for induction, 3% thereafter) in 100% oxygen, the trachea was cannulated to permit artificial ventilation, and one femoral artery and vein were cannulated to record arterial BP and administer fluids, respectively. RTN units were recorded below the facial motor nucleus as described previously (Guyenet et al., 2005). A 200 μm optical fiber was inserted at a 20 degree angle from the vertical in the transverse plane and its tip placed an estimated 500 μm above the left RTN. The light output at the tip of the fiber optic was adjusted to 9 mW with a light meter (Thorlabs) before insertion into the brain. Upon completion of surgical procedures, isoflurane was gradually withdrawn while freshly prepared α-chloralose (dissolved in 2% Na borate; initial dose of 60 mg/kg; maintenance at 30 mg/kg/h) and urethane (10% weight by volume in physiological saline; initial dose: 0.7 g/kg) were slowly infused intravenously, and ventilation with 100% O2 was continued. The adequacy of the anesthesia was assessed by the lack of arterial pressure change and limb withdrawal following a firm paw pinch. Paralysis was induced with vecuronium bromide before the recordings (induction dose 0.1 mg/kg, i.v., plus additional 0.05 mg/kg/h infusion for maintenance). End-expiratory CO2 (eeCO2) was continuously monitored with a micro-capnometer (Columbus Instruments) and maintained between 3.5% and 4.5%. Neurons were recorded extracellularly using glass pipettes filled with 2 m NaCl (5–10 mΩ). RTN neurons were characterized as described previously (Guyenet et al., 2005). Their CO2 sensitivity was determined by adding CO2 to the inspired gas in a stepwise manner to increase eeCO2 up to 10% (for further details, see Guyenet et al., 2005). Phenylephrine (boluses of 10 μg/kg, i.v.) was administered to raise BP. Briefly, RTN neurons were located 100–300 μm below the facial motor nucleus, they were activated by hypercapnia (up to 8–12 Hz at 10% eeCO2), they were silenced by lowering eeCO2 <4%, and they were unresponsive to BP elevation. RTN cells discharged tonically or exhibited a mild respiratory modulation at high FiCO2 (fraction of inspired CO2). To test their response to Arch activation, green light was applied continuously using the laser in 5–20 s episodes. All analog data were acquired on a computer via a micro 1401 digitizer (Cambridge Electronics), and were processed off-line using Spike software (Cambridge Electronics) (for details, see Guyenet et al., 2005). The spontaneous activity of all recorded units was determined at rest, during the photostimulation period, and in recovery.
Physiological experiments in freely behaving rats.
Rats were tested in a plethysmography chamber (EMKA Technologies) custom-modified to allow tethered EEG/EMG recordings and optical stimulation. Rats were repeatedly habituated to these surroundings, which were visually isolated and with low ambient noise before the actual experiments were run. On the day of the experiment, rats were lightly anesthetized with isoflurane (induction with 5%, maintenance with 2% in 100% oxygen for <1 min) to permit cleaning of hardware and connection to the ferrule and EEG/EMG recording assembly. A 200-μm-thick multimode optical fiber terminated with a ferrule was mated to the implanted ferrule with a zirconia sleeve. Optical matching gel (Fiber Instrument Sales) was applied at the ferrule junction to reduce light loss. A minimum of 1 h was allowed for recovery from anesthesia and the emergence of stable sleep/wake patterns. Recordings were made between 10:00 A.M. to 6:00 P.M., over multiple days, with a minimum of 3 d rest between tests. The ventilatory response to RTN inhibition was assessed using barometric, unrestrained whole-body plethysmography (EMKA Technologies). The plethysmography chamber was continuously flushed with 1.5 L/min of 21% O2 balanced with N2 regulated by computer-driven mass flow controllers for O2, N2, and CO2 (Alicat). Temperature and humidity within the plethysmography chamber were kept stable within experiments (±0.5°C, ±5% relative humidity) and between experiments (23°C–25°C ambient room temperature, 40%–60% relative humidity).
Photoinhibition of Arch-expressing RTN neurons was achieved with a green laser (532 nm, Shanghai Laser and Optics Century). Photoexcitation of ChR2-expressing RTN neurons was performed using a blue laser (473 nm, CrystaLaser). The lasers were controlled by TTL pulses from a Grass model S88 stimulator (AstroMed). Green light was applied bilaterally using a splitter through 200-μm-thick multimode optical fiber (Thorlabs) in 10 s episodes of continuous illumination with ∼5 mW of light output at the tip of the implanted fibers. Blue light was pulsed (2–5 ms pulse width) for 20 s periods at 20 Hz with ∼9 mW of light output at the tip. The transmission efficiency of each implantable optical fiber was tested before implantation with a light meter (Thorlabs).
Data acquisition and analysis.
Physiological signals were acquired and processed using Spike version 7.03 software (Cambridge Electronics). EEG and EMG were amplified and bandpass filtered (EEG: 0.1–100 Hz, ×1000. EMG: 100–3000 Hz, ×1000) and acquired at a sampling frequency of 1 kHz. The signal generated by the differential pressure transducer connected to the plethysmography chamber was amplified, bandpass filtered (×200, 0.1–20 Hz) and acquired at a sampling frequency of 1 kHz. The signal from the radio telemetry probe (BP) was acquired at a sampling frequency of 0.2 kHz. Mean arterial pressure and heart rate were extracted from pulsatile BP recordings from the descending aorta based on values calibrated before implantation of the telemetry probe. Periods of wake or natural sleep were classified on the basis of EEG, EMG activity, and the patterns of cardiovascular and breathing activity. During non-rapid eye movement sleep (non-REM), EEG spectra were dominated by δactivity (0.5–4 Hz), with little or no EMG activity, and a stable breathing pattern, BP, and heart rate. Quiet wake was characterized by a reduction in total EEG power with EMG tone and an elevated resting heart rate.
A minimum of 6 photoactivation trials were conducted in each rat in each state (non-REM sleep and quiet wake), at each level of FiO2 (65%, 21%, 15%, or 12% with or without the addition of 3% FiCO2) or treatment with acetazolamide (200 mg/kg in 100% DMSO, 0.1 ml i.p., Sigma-Aldrich) or DMSO. Average breathing values were extracted from all trials not contaminated by body movements, as indicated by EMG activity. Respiratory and cardiovascular parameters (BP, heart rate) were averaged during the 10 s photostimulus. Baseline values were measured during the 20 s preceding light delivery. Respiratory frequency (fR, breaths/min) and tidal volume (VT, area under the curve during the inspiratory period calibrated to waveforms generated by injecting 5 ml of dry air from a syringe during the experiment, expressed in milliliters per 100 g body weight) were calculated using Spike software version 7.3 (Cambridge Electronics). These values were used to calculate minute ventilation (VE = fR × VT, expressed as ml/100 g body weight/ min).
Arterial blood values (pH, PCO2, bicarbonate, PO2) were measured at each level of FiO2 (65%, 21%, 15%, or 12%, no CO2 added), at 12% FiO2 with 3% FiCO2 supplementation (isocapnic hypoxia) and with acetazolamide treatment at 65%, 21%, 15%, and 12% FiO2. Arterial blood samples were analyzed immediately with an iStat handheld monitor configured with a CG8+ cartridge (Abbott Laboratories).
All datasets were tested for normality; then differences within and between groups were determined using either paired Student's t test, one-way repeated measures ANOVA, or two-way repeated-measures ANOVA with Sidak or Bonferroni multiple comparisons using PRISM software (version 6, GraphPad Software). If data were not normally distributed, Friedman's nonparametric repeated-measures ANOVA was conducted with Dunn's post hoc multiple comparisons. Two-tailed Pearson's correlation was used to test for a relationship between Arch-induced reductions in breathing frequency (ΔfR), tidal volume (ΔVT), and minute ventilation (ΔVE) and arterial pH (pHa) or arterial PCO2 (PaCO2). The same test was also used to test for correlations between resting fR, VT, and VE and pHa or PaCO2. Linear regression analysis was used to examine the relationship between pHa or PaCO2 and Arch-induced ΔfR, ΔVT, and ΔVE and to calculate the pHa and PaCO2 at which RTN neurons start to be active (the recruitment threshold; methodological details in Results). All values are expressed as means ± SEM.
Histology.
Animals were deeply anesthetized with sodium pentobarbital and perfused transcardially with 4% PFA, brains removed, and processed as described previously (Abbott et al., 2012). Immunohistochemistry with antibodies against tyrosine hydroxylase (sheep anti-TH, 1:2000, Millipore), EYFP (chicken anti-GFP, 1:1000, AVES Labs), or mCherry (rabbit anti-dsRed, 1:500, Clontech #632496, Clontech Laboratories), Phox2b (rabbit anti-Phox2b, 1:8000, a gift from J.F. Brunet, Ecole Normale Superieure, Paris), and GFAP (rat anti-GFAP, 1:1000, Invitrogen) was performed as previously described (Abbott et al., 2009b). Cell mapping, counting, and photography were done using the Neurolucida system (MicroBrightfield) with a Zeiss Axioskop microscope with computer-driven stage and Zeiss MRc camera. Cell counts were taken from a 1 in 6 series of sections, and only profiles containing a nucleus were counted.
Results
Histology
The location and phenotype of Arch-transduced neurons (positive for EYFP) were examined by immunohistochemistry in 12 rats (Fig. 1). Consistent with prior studies using related PRSX8 promoter-containing LVVs (Abbott et al., 2009b), Arch-transduced neurons were limited to Phox2b-ir noncatecholaminergic neurons located just caudal to and under the entire extent of the facial motor nucleus (Fig. 1A1–A3) and to TH-ir neurons (C1, Fig. 1A4) occasionally also located in proximity to RTN but mostly present slightly caudal or medial to it (Fig. 1A3). A few EYFP-labeled neurons, presumably cholinergic, were found in 3 cases within the rostral compact portion of nucleus ambiguus and were not included in the count of RTN cells. The TH-negative transduced neurons located under the facial motor nucleus were virtually all Phox2b-positive and therefore classified as RTN neurons (Abbott et al., 2009b). The rostrocaudal distribution of Arch-transduced RTN and catecholaminergic (CA) neurons is shown in Figure 1B (12 rats). The total number of Arch-transduced RTN neurons counted in a 1 in 6 series of coronal sections was 85.8 ± 11.3 neurons. The number of transduced CA neurons counted was 81.2 ± 9. Figure 1C shows where the tips of optical fibers were located in 10 of these rats (Fig. 1B,C). Two of the 12 rats had a correctly placed optical fiber on one side only and are not represented.
Figure 1.
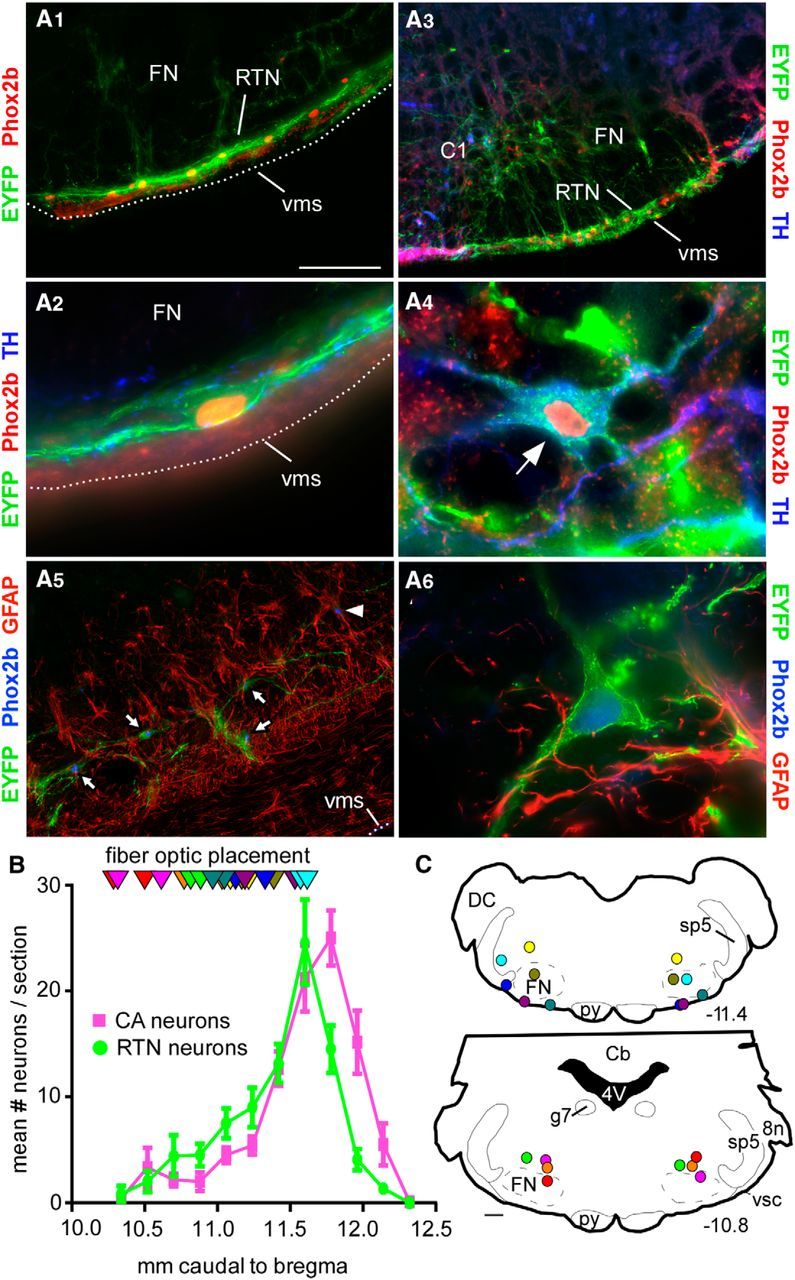
Location of Arch-transduced neurons and fiber optic tips. A1, Coronal section through the medulla (level ∼11.4 mm caudal to bregma) illustrating the selective expression of ArchT-EYFP by RTN neurons. RTN is identified by the line of strongly Phox2b-ir nuclei close to the ventral medullary surface (Takakura et al., 2006). A2, Higher-power photograph of an ArchT-transduced RTN neuron. This neuron had a Phox2b-immunoreactive (ir) nucleus, was negative for TH, but had close appositions from TH-ir synaptic boutons. A3, Coronal section (level ∼11.7 mm caudal to bregma) showing transduced RTN neurons (on the ventral medullary surface) and catecholamine (CA, presumably C1) cells dorsal to the latter. A4, Example of a transduced CA neuron containing EYFP and TH immunoreactivity plus a Phox2b-ir nucleus. A5, GFAP-ir cells (astrocytes, glia) are not ArchT-EYFP-ir. Arrows point to ArchT-EYFP-expressing neurons that are Phox2b-ir. Arrowhead indicates a nontransduced cell with a Phox2b-ir nucleus. A6, Higher-power photograph of an ArchT-transduced neuron. The GFAP-ir cells and processes are in very close proximity and do not contain EYFP. Scale bars: A1, A5, 100 μm; A3, 200 μm; A2, A4, A6, 20 μm. FN, Facial motor nucleus; vms, ventral medullary surface. B, Rostrocaudal distribution of transduced RTN and CA neurons following bilateral injections of PRSx8-ArchT-EYFP lentiviral vector under the caudal end of the facial motor nucleus (30-μm-thick sections, 180 μm apart). 8n, Eighth nerve root; Cb, cerebellum; DC, dorsal cochlear nucleus; FN, facial motor nucleus; g7, genu of the seventh nerve; py, pyramidal tract; sp5, spinal trigeminal tract; vsc, ventral spinocerebellar tract. The FN extends from −12.0 to −10 mm caudal to bregma. C, Location of the bilateral fiber optic tips identified in 10 rats. These sites are plotted on two transverse brain sections closest to their location; unique colors represent unique subjects. The exact transverse plane in which the fiber optic tips were found is also represented in B (triangles, same color code as in C). Stereotaxic coordinates (transverse planes posterior to bregma) correspond to the atlas of Paxinos and Watson (2005).
The distribution of ChR2-transduced neurons was very similar albeit unilateral by design. On average, 67 ± 11 neurons (1 in 6 section counts) expressed EYFP, of which 33 ± 8 also expressed TH (47%). The optical fiber tips were located 0.5–1 mm dorsal to the ventral medullary surface at levels 9.7–11.5 caudal to bregma similar to the placement of optical fibers in the Arch cases shown in Figure 1.
Astrocytes regulate RTN neurons by releasing ATP (Gourine et al., 2010). Although astrocytes are not known to express Phox2b, we tested whether Arch might have been expressed by these cells. In sections from four PRSX8-Arch-EYFP LVV-injected rats, no overlap between GFAP immunoreactivity and EYFP could be detected in the RTN, although glia are located in close proximity to the transduced neurons as reported previously (Fig. 1A5,A6) (Lazarenko et al., 2009).
Photoactivation of the proton pump silences RTN in anesthetized rats
Arch is a light-activated pump that translocates protons from the cytoplasm to the extracellular space, thereby hyperpolarizing and silencing neurons (Chow et al., 2010). Given that RTN neurons are directly activated by acidification in slices (Mulkey et al., 2004; Wang et al., 2013a, b), we wanted to ascertain that Arch activation can indeed silence RTN neurons (i.e., that the protons translocated by the pump do not stimulate these cells in vivo). We identified 9 RTN neurons in 4 rats in which RTN neurons were transduced with Arch. Six of those were silenced by applying green light for 2–10 s (Fig. 2A1). The rest were unaffected. Inhibition was immediate, instantly reversible, and complete, including when the neurons were maximally activated by 10% FiCO2 (Fig. 2A1,A2). The inhibited neurons had the characteristic properties of previously identified Phox2b-positive RTN chemoreceptors (i.e., they were silent at eeCO2 <3.5%–4.5% eeCO2, robustly activated by hypercapnia in a concentration-dependent manner and respiratory-modulated at high levels of eeCO2 only) (Fig. 2A1,B). Thus, despite their intrinsic sensitivity to acid, RTN neurons are inhibited by Arch similar to other previously tested neurons (Chow et al., 2010). Given the uncertainty regarding whether intracellular or extracellular acidification is responsible for the acid-induced depolarization of RTN neurons, several explanations are plausible. First, the Arch-dependent outward current could deliver too few protons to acidify the extracellular space. Second and more likely, the pump generates an outward current that is far greater than the maximal inward current caused by extracellular acidification of RTN neurons (typically 20–30 pA in slices) (Mulkey et al., 2004; Wang et al., 2013a, 2013b). Third, if the potassium conductance responsible for the acid sensitivity of RTN neurons is closed by intracellular rather than extracellular acidification, the intracellular alkalization caused by Arch could actually contribute to inhibiting RTN neurons.
Figure 2.

Arch photoactivation silences RTN neurons in anesthetized rats. A1, Example of one extracellularly recorded RTN neuron. Top, Integrated rate histogram (bin size: 1 s). Middle, eeCO2. Bottom, Extracellular action potentials. eeCO2 was changed by adding variable concentrations of CO2 to the breathing mixture; 532 nm continuous laser light was delivered in the vicinity of the neuron via a fiberoptic (green bars). The light produced immediate and complete inhibition of the neuron. A2, Expanded scale excerpts showing that the neuron was instantly and reversibly silenced by the light under lower (top) or higher eeCO2 (bottom). B, relationship between unit discharge rate and eeCO2 for 6 RTN units that were silenced by green light (the cell shown in A1 and A2 is represented in red).
Arch-triggered hypoventilation is attenuated by hypoxia
These physiological experiments were designed to test several consequences of the theory that RTN neurons are CRCs and/or function as a central respiratory chemoreflex integrator, namely: (1) RTN neuron inhibition should produce hypoventilation at rest; (2) activity of RTN neurons should be reduced by hypoxia because of the associated alkalosis; (3) during hypoxia, RTN neurons should be reactivated by restoring blood acidity to control (normoxic) levels; and (4) RTN neurons should be activated by hyperoxia. Collectively, these four criteria form a reasonably stringent test of whether RTN mediates the effects of brain acidification on breathing with any degree of selectivity. The first test distinguishes between neurons that drive breathing at rest and neurons that do not. The second one distinguishes between neurons that mediate the effect of CNS hypercarbia and neurons that merely contribute to respiratory rhythm and pattern generation. Contrary to the former, the latter should be activated by hypoxia because this stimulus activates the breathing rate and amplitude. The third criterion verifies the expectation that hypoxia inhibits RTN neurons via brain alkalization. The fourth criterion also distinguishes potential CRCs from neurons that contribute to respiratory rhythm and pattern generation. Indeed, because hyperoxia decreases breathing in rats (Olson et al., 1988), the activity of the latter should be reduced in a manner commensurate with the reduction in breathing intensity, whereas CRCs should be activated. Criteria 1, 2, and 4 are addressed in this section; the third criterion is examined later on.
Blood gases were measured while rats were quiescent and fully habituated to their surroundings to minimize the confounding effect of stress and physical activity on ventilation. Blood gases during normoxia, hypoxia, and hyperoxia conformed to expectations for rats (Olson et al., 1988) (Table 1). Hyperoxia caused a slight respiratory acidosis (not significant), and hypoxia caused frank respiratory alkalosis at 12% FiO2 (N = 6; one-way repeated-measures ANOVA across four levels of FiO2 for pH, PaCO2, PaO2, and HCO3; effect on pH: Friedman statistic = 18.00, p < 0.001; Dunn's multiple comparisons for pH: 65% vs 21% FiO2, p > 0. 9; 21% vs 12% FiO2, p = 0.04). Arch photoactivation was administered exclusively during periods of eupneic breathing (i.e., when rats were quietly awake or in non-REM sleep and breathing was regular). Periods of REM sleep or episodes during which rats were actively behaving (grooming, sniffing, ambulating) were deliberately excluded from testing.
Table 1.
Blood gases in conscious rats
| Variable | n | pH | PaCO2 | PaO2 | HCO3 |
|---|---|---|---|---|---|
| 65% FiO2 | 6 | 7.40 ± 0.01 | 49.2 ± 2.3 | 271 ± 8.2 | 30.4 ± 1.2 |
| 21% FiO2 | 6 | 7.44 ± 0.01 | 41.8 ± 1.9 | 78.3 ± 3 | 29.0 ± 1.7 |
| 15% FiO2 | 6 | 7.51 ± 0.01† | 32.6 ± 0.9 | 51.5 ± 2.6 | 26.1 ± 0.8† |
| 12% FiO2 | 6 | 7.59 ± 0.01*,††† | 25.0 ± 0.6*,††† | 43.0 ± 2.4 | 23.9 ± 0.9*,††† |
| 12% FiO2 + 3% FiCO2 | 5 | 7.48 ± 0.02 | 34.5 ± 0.9 | 56.6 ± 3.3 | 25.7 ± 0.3 |
| ACTZ + 65% FiO2 | 4 | 7.36 ± 0.01 | 40.6 ± 2.0 | 287 ± 6.8 | 22.5 ± 0.5 |
| ACTZ + 21% FiO2 | 4 | 7.38 ± 0.01 | 40.3 ± 1.4 | 100 ± 2.2 | 24.0 ± 0.6 |
| ACTZ + 15% FiO2 | 4 | 7.40 ± 0.01 | 32.7 ± 0.6 | 63.8 ± 1.5 | 20.2 ± 0.7 |
| ACTZ + 12% FiO2 | 4 | 7.43 ± 0.01† | 28.0 ± 0.8† | 51.5 ± 2.0 | 18.5 ± 0.8* |
Blood gases were measured in quietly resting rats habituated to the plethysmography chamber during exposure to various breathing mixtures. ACTZ, Acetazolamide.
* The 21% versus 15 or 12% FiO2 (one symbol: p < 0.05; three symbols: p < 0.005).
†The 65% versus 15% or 12% FiO2 (one symbol: p < 0.05; three symbols: p < 0.005).
Hyperoxia reduced resting ventilation slightly, whereas hypoxia produced the expected oxygen concentration-dependent stimulation of breathing rate (Fig. 3A,B). Arch activation consistently reduced breathing rate and amplitude during normoxia (Fig. 3A,B). Arch-induced hypoventilation was increased by hyperoxia (65% FiO2), attenuated by hypoxia (15% FiO2), and dramatically reduced at 12% FiO2 (Fig. 3A–C) (N = 9; two-way repeated-measures ANOVA; effect of FiO2 on fR: F(3,24) = 30.71, p < 0.0001; effect of Arch on fR: F(1,8) = 36.91, p = 0.0003; interaction effect on fR: F(3,24) = 32.04, p < 0.0001; Sidak's multiple comparisons of fR values: 65% FiO2 vs 65% FiO2 + Arch, p < 0.0001; 21% FiO2 vs 21% FiO2 + Arch, p < 0.0001; 15% FiO2 vs 15% FiO2 + Arch, p = 0. 05; 12% FiO2 vs 12% FiO2 + Arch, p > 0. 9; effect of FiO2 on VT: F(3,24) = 0.96, p = 0.43; effect of Arch on VT: F(1,8) = 72.17, p < 0.0001; interaction effect on VT: F(3,24) = 19.67, p < 0.0001; Sidak's multiple comparisons of VT values: 65% FiO2 vs 65% FiO2 + Arch, p < 0.0001; 21% FiO2 vs 21% FiO2 + Arch, p < 0.0001; 15% FiO2 vs 15% FiO2 + Arch, p < 0.0001; 12% FiO2 vs 12% FiO2 + Arch, p < 0.0001; effect of FiO2 on VE: F(3,24) = 23.13, p < 0.0001; effect of Arch on VE: F(1,8) = 77.0, p < 0.0001; interaction effect on VE: F(3,24) = 35.94, p < 0.0001; Sidak's multiple comparisons between VE values: 65% FiO2 vs 65% FiO2 + Arch, p < 0.0001; 21% FiO2 vs 21% FiO2 + Arch, p < 0.0001; 15% FiO2 vs 15% FiO2 + Arch, p < 0.0001; 12% FiO2 vs 12% FiO2 + Arch, p < 0.0001).
Figure 3.

Arch photoactivation reduces breathing rate and amplitude to different extents in conscious rats exposed to normoxia, hyperoxia, or hypoxia. A, Hypoventilation caused by bilateral Arch photoactivation (10 s) in a conscious Sprague Dawley rat under hyperoxia (65% FiO2, A1), normoxia (21% FiO2, A2), mild hypoxia (15% FiO2, A3), and moderate hypoxia (12% FiO2, A4). B, Ventilation parameters at rest and during Arch photostimulation in rats exposed to four levels (percentages) of O2 in the breathing mixture (FiO2): group data (9 rats). B1, fR at rest and during Arch photostimulation. B2, VT at rest and during Arch photostimulation. B3, VE at rest and during Arch photostimulation. C, Change in ventilation parameters elicited by Arch photostimulation across four levels of FiO2: group data (same 9 rats as in B). C1, Effect of FiO2 on ΔfR. C2, Effect of FiO2 on ΔVT . C3, Effect of FiO2 on ΔVE . *p < 0.05. **p < 0.01. ***p < 0.001.
Arch-induced hypoventilation was maximal during the early part of the photostimulus and tended to return toward the prestimulation level thereafter. The tendency for breathing to increase during the latter part of the photostimulus period can be better appreciated by examining event-triggered averaged responses (Fig. 4). These graphs show that the hypoventilation was better sustained throughout the light stimulus during hyperoxia than during hypoxia. This in turn suggests that, during normoxia and especially so during hypoxia, the hypoventilation elicited by the photostimulus was rapidly attenuated by an increase in CB activity rather than by an increase in CRC activity. This interpretation is based on the peripheral chemoreflex having a much shorter time constant than the central chemoreflex (Smith et al., 2006). The relaxation of the hypoventilation during the latter part of the photostimulus indicates that we slightly underestimated the instantaneous contribution of RTN neurons to resting ventilation by averaging breathing frequency and tidal volume throughout the 10 s stimulus period.
Figure 4.

Kinetics of the hypoventilatory response at four different levels of FiO2. Event-triggered averaged ventilatory responses to bilateral activation of Arch. Five or six responses were collected at each FiO2 in every rat (N = 5) to generate a single average response per rat. Five such responses were averaged. The mean and 5% confidence intervals are shown.
Arterial pressure (BP) was recorded by telemetry in 4 rats. Resting BP was unaffected by the level of inhaled oxygen except for a slight reduction at 12% FiO2 (Fig. 5). Arch photoactivation (10 s) produced a small hypotension under all levels of FiO2 (Fig. 5) (N = 4; two-way repeated-measures ANOVA; effect of FiO2 on BP: F(3,9) = 4.440, p = 0.03; effect of Arch on BP: F(1,3) = 19.14, p = 0.02; interaction effect on BP: F(3,9) = 14.73, p = 0.0008; Sidak's multiple comparisons for effect of FiO2 on resting BP: comparisons between every level of FiO2, except those for 12% FiO2, p > 0.3; for all FiO2 levels vs 12%, p < 0.0001; Sidak's multiple comparisons for BP before and after Arch photoactivation at 65% FiO2, p = 0.05; 21% FiO2, p = 0.002; 15% FiO2, p = 0.0002; 12% FiO2, p < 0.0001). The rostral C1 cells innervate and drive vasomotor sympathetic preganglionic neurons. Their activity is increased by hypoxia and helps maintain BP during hypoxia (Sun and Reis, 1994; Hirooka et al., 1997; Madden and Sved, 2003). Hypoxia-dependent hypotension was therefore an expected consequence of inhibiting a subset of C1 neurons transduced with Arch. The hypotension was very small, however, suggesting that few C1 cells were inhibited or that the baroreflex strongly buffered the response by activating the nontransduced C1 neurons.
Figure 5.

Effect of hypoxia on resting BP and on the BP response to Arch stimulation. BP measurements at rest (black bars) and during Arch stimulation (gray bars) in 4 Sprague Dawley rats under hyperoxia (65% FiO2), normoxia (21% FiO2), mild hypoxia (15% FiO2), and moderate hypoxia (12% FiO2). *p < 0.05. **p < 0.01. ***p < 0.001.
The hypoventilation elicited by activating Arch was correlated with the number of transduced RTN neurons (N = 10; correlation with fR: Pearson r = 0.64, one-tailed p = 0.03; correlation with VT: Pearson r = 0.66, p = 0.02; correlation with VE: Pearson r = 0.59, p = 0.04) and exhibited only a weak correlation with the number of transduced CA cells (correlation with fR: Pearson r = 0.52, one-tailed p = 0.06; correlation with VT: Pearson r = 0.55, p = 0.05; correlation with VE: Pearson r = 0.60, p = 0.03) (Fig. 6A,B). A total of 10 mW of blue light delivered by a 200 μm optical fiber delivers ≥1 mW, the power necessary to activate ChR2, only through 0.5 mm3 of tissue (a sphere of ∼500 μm radius) (Aravanis et al., 2007). When we considered only the transduced neurons located within 500 μm of the coronal plane of optical fibers (10 rats; Fig. 6C), the correlation between hypoventilation and transduced RTN neurons became much tighter (correlation with fR: Pearson r = 0.74, p = 0.008; correlation with VT: Pearson r = 0.86, p = 0.0008; correlation with VE: Pearson r = 0.86, p = 0.0007), whereas there was even less correlation with the number of transduced CA cells located in the same domain (correlation with fR: Pearson r = 0.48, p = 0.08; correlation with VT: Pearson r = 0.43, p = 0.1; correlation with VE: Pearson r = 0.63, p = 0.03) (Fig. 6D). Linear regression analysis further revealed that the relationship between the number of transduced RTN neurons and the respiratory effects produced during Arch photoinhibition was more robust than that between numbers of CA neurons transduced particularly when distance from the fiber optic tip was taken into consideration (Fig. 6) (percentage decrease in fR and number of RTN neurons: r2 = 0.54, p = 0.02; percentage decrease in VT: r2 = 0.73, p = 0.002; percentage decrease in VE: r2 = 0.74, p = 0.001). Thus, the hypoventilation elicited by the light was likely caused by inhibition of Arch-transduced RTN neurons as opposed to catecholaminergic neurons. The results also suggest that the light may not have been able to reach the entire population of transduced RTN neurons. In this cohort of 10 rats, the number of Arch-transduced RTN neurons located within 500 μm of the tip of optical fibers varied from a low of 120 to a high of 480 (the number of counted neurons in a 1 in 6 series of sections multiplied by 6) and the total number of transduced RTN neurons was between 240 and 980. Because the rat has ∼2000 RTN neurons, we estimate that the maximum percentage of RTN neurons that were directly photoinhibited could not have exceeded 50%; yet, in hyperoxia, VE could be reduced by up to 80%.
Figure 6.

Relationship determined by linear regression between Arch-induced hypoventilation and the number of Arch-transduced neurons. A, Relationship between number of all RTN neurons transduced (counted in a 1:6 coronal series) and percentage decrease of fR, VT, and VE elicited by Arch photostimulation for 10 Sprague Dawley rats. B, Relationship between number of all catecholaminergic (CA) neurons transduced and percentage decrease of fR, VT, and VE (for the same 10 Sprague Dawley rats as in A) elicited by Arch photostimulation. C, Relationship between numbers of RTN neurons within 0.5 mm of the coronal plane containing the fiber optic tip. D, Relationship between numbers of CA neurons within 0.5 mm of the coronal plane containing the fiber optic tip. *p < 0.05. **p < 0.01.
Does arousal account for the loss of Arch-triggered hypoventilation during hypoxia?
Hypoxia causes arousal (Pappenheimer, 1977; Phillipson et al., 1978), and the contribution of RTN neurons to breathing has been previously described as state-dependent (Li et al., 1999). To test whether the loss of Arch-triggered hypoventilation during hypoxia was caused by arousal, we compared the responses elicited under the following three conditions: normoxia when rats were in non-REM sleep, normoxia during wake, and 12% FiO2 while the animals were quietly awake. The state of vigilance was determined by video recording of the animal's immobility and posture and by examining the δpower (0.5–4 Hz) of the EEG. The hypoventilation elicited under normoxic conditions during non-REM sleep was about the same as when rats were quietly awake (Fig. 7). The hypoventilation observed during hypoxia in quiet awake rats was still significantly smaller than when rats were quietly awake under normoxia (Fig. 7B) (N = 5; one-way repeated-measures ANOVA; main effect of laser light on ΔfR: F(2,12) = 11.79, p = 0.002. Bonferroni multiple comparisons: 21% FiO2 quiet awake vs 21% FiO2 non-REM sleep, p > 0.9; 21% FiO2 quiet awake vs 12% FiO2 quiet awake, p = 0.002; 21%FiO2 non-REM sleep vs 12% FiO2 quiet awake, p = 0.007; effect of laser light on ΔVT: F(2,12) = 1. 556, p = 0.3; effect of light on ΔVE: F(2,12) = 9.136, p = 0.004; Bonferroni multiple comparison: 21% FiO2 quiet awake vs 12% FiO2 quiet awake, p = 0.01; 21% FiO2 non-REM sleep vs 12% FiO2 quiet awake, p = 0.008; 21% FiO2 quiet awake vs 21% FiO2 non-REM sleep, p > 0.9). FFT analysis of the EEG (with values normalized to non-REM sleep) showed that the δpower (0.5–4 Hz) was the same during quiet awake and hypoxia and that the δpower under both conditions was significantly less than during non-REM sleep (Fig. 7C) (N = 5; one-way repeated-measures ANOVA; F(2,8) = 15.08, p = 0.002; Bonferroni's multiple comparisons: 21% FiO2 non-REM sleep vs 21% FiO2 quiet awake, p = 0.003; 21% FiO2 non-REM sleep vs 12% FiO2 quiet awake, p = 0.006; 21% FiO2 quiet awake vs 12% FiO2 quiet awake, p > 0.9).
Figure 7.

Arousal does not account for the reduction of Arch-triggered hypoventilation during hypoxia. A, Hypoventilation caused by bilateral Arch photoactivation (10 s, gray shaded bars) in one Sprague Dawley rat during non-REM sleep (A1), quiet wake (A2), and hypoxia (12% FiO2, A3). Each panel also depicts the EEG power (FFT, 0–40 Hz) recorded during a 30 s window that included the photostimulus period and the preceding 20 s. B, Group data (5 rats). B1, Light-evoked fR reduction during non-REM sleep, quiet wake, and hypoxia (12% FiO2). B2, VT reduction during non-REM sleep, quiet wake, and hypoxia (12% FiO2). B3, VE reduction during non-REM sleep, quiet wake, and hypoxia (12% FiO2). C, EEG power (0.5–4 Hz only) during periods of quiet wake in normoxia or during hypoxia expressed as a fraction of the power recorded during periods of non-REM sleep (same 5 rats). *p < 0.05. **p < 0.01.
In summary, RTN neurons drive eupneic breathing equally during non-REM sleep and quiet waking in rats. Second, arousal does not account for the reduction of Arch-triggered hypoventilation during hypocapnic hypoxia.
Does hypoxia attenuate the breathing stimulation elicited by RTN stimulation?
A possible reason why hypoxia attenuates Arch-triggered hypoventilation could be that the respiratory network is unable to respond to RTN neuronal input under this condition. To address this question, we stimulated RTN neurons optogenetically using a previously described ChR2-expressing lentiviral vector (PRSx8-ChR2-EYFP-LVV) (Abbott et al., 2009b) with the same cell specificity as the Arch-delivering vector. ChR2 stimulation increased ventilation at all levels of FiO2 (N = 6; two-way repeated-measures ANOVA; effect of ChR2 stimulation on fR: F(1,5) = 37.39, p = 0.002; Sidak's multiple comparisons: before and after ChR2 stimulation at 21%, 15%, and 12% FiO2, p < 0.0001; effect of ChR2 stimulation on VT: F(1,5) = 15.87, p = 0.01; Sidak's multiple comparisons: before and after ChR2 at 21% FiO2, p < 0.0001; at 15% FiO2, p = 0.0002; at 12% FiO2, p = 0.002; effect of ChR2 stimulation on VE: F(1,5) = 28.61, p = 0.003; Sidak's multiple comparisons: before and after ChR2 stimulation at 21%, 15%, and 12% FiO2, p < 0.0001). The increase in breathing frequency elicited by photostimulation of the ChR2-transduced neurons was slightly reduced by hypoxia (25% decrease at 12% FiO2; Fig. 8A,B) (N = 6; Friedman one-way repeated-measures ANOVA; effect of photostimulation on ΔfR at different FiO2: Friedman statistic = 9.333, p = 0.006; Dunn's multiple comparisons: ChR2 stimulation at 21% vs 12% FiO2, p = 0.01; all other comparisons, p > 0.06). The increase in tidal volume elicited by ChR2 stimulation of RTN was also reduced by hypoxia (50% on average at 12% FiO2; Fig. 8A,C) (N = 6; Friedman one-way repeated-measures ANOVA; effect of photostimulation on ΔVT at different FiO2: Friedman statistic = 9.333, p = 0.006; Dunn's multiple comparisons: ChR2 stimulation at 21% vs 12% FiO2, p = 0.01; all other comparisons, p > 0.06). Thus, although RTN stimulation did increase breathing at all levels of FiO2, this effect was reduced during hypoxia, by 25% for fR and 50% for VT.
Figure 8.

Activation of ChR2-expressing RTN/C1 neurons increases breathing in normoxia and hypoxia. A, Hyperventilation caused by unilateral ChR2 photoactivation (20 s, 20 Hz, 5 ms pulse width) in a conscious Sprague Dawley rat under normoxia (21% FiO2, A1), mild hypoxia (15% FiO2, A2), and moderate hypoxia (12% FiO2, A3). B, Left, Ventilation parameters at rest and during ChR2 photostimulation in rats exposed to three different amounts of O2 in the breathing mixture (FiO2). Right, Change in ventilation parameters evoked by ChR2 activation (6 rats). B1, fR. B2, VT at rest and during ChR2 photostimulation. B3, VE at rest and during photostimulation *p < 0.05. **p < 0.01. ***p < 0.001.
Reacidifying the blood restores Arch-triggered hypoventilation during hypoxia
If RTN neurons are silenced by hypoxia because of respiratory alkalosis, these neurons should be reactivated by blood acidification. This test requires no assumption as to where acidification might ultimately work (RTN, carotid bodies, or other CRCs). Reacidification was achieved by exposing rats to 3% FiCO2 or by administering the carbonic anhydrase inhibitor acetazolamide, a drug used clinically to stimulate breathing at altitude (Swenson, 2014).
The addition of 3% FiCO2 to the 12% hypoxic breathing mixture restored arterial pH and PCO2 toward the values observed under normoxia, although a very slight respiratory alkalosis persisted (pH 7.48 vs 7.44; PaCO2 34.5 vs 41.8; Table 1). The addition of CO2 also restored Arch-induced bradypnea (Fig. 9A). However, contrary to expectations, 3% FiCO2 had no effect on the VT reduction elicited by RTN inhibition under any of the oxygen concentrations tested (Fig. 9A,B2) (N = 5; two-way repeated-measures ANOVA; interaction effect [Arch inhibition × inhaled gas mixture] on fR: F(3,12) = 6.781, p = 0.006; Sidak's multiple comparisons for effects of Arch inhibition on fR during 21% FiO2 vs 21% FiO2 + 3% FiCO2, p = 0.001; 15% FiO2 vs 15% FiO2 + 3% FiCO2, p = 0.005; 12% FiO2 vs 12% FiO2 + 3% FiCO2, p = 0.0009; interaction effect [Arch inhibition × inhaled gas mixture] on VT: F(3,12) = 2.413, p = 0.1).
Figure 9.

Hypercapnia restores Arch-induced hypoventilation under hypoxia. A, Sprague Dawley rat in normoxia (A1, 21% FiO2), hypoxia (A2, 12% FiO2), and during combined hypoxia and hypercapnia (A3, 12% FiO2 + 3% FiCO2). Arch stimulation at gray shaded bars. B, Hypoventilation elicited by Arch stimulation as a function of FiO2 and with the addition of 3% FiCO2: group data (5 rats). B1, Change in fR elicited by Arch photostimulation in the absence or presence of 3% FiCO2. B2, Change in VT elicited by Arch photostimulation in the absence or presence of 3% FiCO2. B3, Change in VE elicited by Arch photostimulation in the absence or presence of 3% FiCO2. **p < 0.01. ***p < 0.001.
We compared the ventilatory responses to Arch activation following DMSO administration (vehicle for acetazolamide) alone to the responses following acetazolamide. DMSO and acetazolamide were administered to the same 6 rats in random order at an interval of 3 d. In a different cohort of animals (N = 4), blood gasses and pH were measured both before and after acetazolamide administration. Acetazolamide reduced plasma bicarbonate as expected but had no effect on PCO2 regardless of the level of inspired oxygen, except in 65% FiO2 where there was a slight decrease (Table 1) (N = 4; two-way repeated-measures ANOVA for acetazolamide and FiO2 on HCO3: main effect of FiO2: F(3,9) = 20.08, p = 0.0003; main effect of acetazolamide: F(1,3) = 54.30, p = 0.005; interaction: F(3,9) = 0.9658, p > 0.5; Sidak's multiple comparisons: baseline, 65% FiO2 vs Acet 65% FiO2, p < 0.0001; baseline, 21% FiO2 vs Acet 21% FiO2, p = 0.0007; baseline, 15% FiO2 and 12% FiO2 vs Acet, p = 0.0004; two-way repeated-measures ANOVA for acetazolamide and FiO2 on PaCO2; main effect of FiO2, F(3,9) = 45.06, p < 0.0001; main effect of acetazolamide, F(1,3) = 1.398, p = 0.3; interaction, F(3,9) = 5.767, p = 0.02; Sidak's multiple comparisons: baseline, 65% FiO2 vs Acet 65% O2, p = 0.002; baseline, 21% FiO2, 15% FiO2, and 12% FiO2 vs Acet 21% FiO2, 15% FiO2, and 12% FiO2, p > 0.2). Acetazolamide lowered pHa significantly at all levels of FiO2, except 65%, and greatly reduced the alkalization resulting from hypoxia (two-way repeated-measures ANOVA for acetazolamide and FiO2 on pH; main effect of FiO2: F(3,9) = 285.1, p < 0.0001; main effect of acetazolamide: F(1,3) = 77.84, p = 0.003; interaction: F(3,9) = 17.39, p = 0.0004; Sidak's multiple comparisons: baseline, 65% FiO2 vs Acet 65% FiO2, p = 0.09; baseline, 21% FiO2 vs Acet 21% FiO2, p = 0.004; baseline, 15% FiO2 and 12% FiO2 vs Acet 15% FiO2 and 12% FiO2, p < 0.0001).
Arch-induced bradypnea (ΔfR) was strongly dependent on FiO2 in the control group (DMSO, Fig. 10; N = 6; one-way repeated-measures ANOVA; effect of FiO2 on fR: F(1,5) = 34.12, p = 0.0005). Acetazolamide increased resting ventilation under all oxygen conditions (not illustrated; N = 6; two-way repeated-measures ANOVA for fR; main effect of acetazolamide: F(1,5) = 364.7, p < 0.0001). After administration of acetazolamide, Arch-induced bradypnea was observed under all oxygen conditions tested (Fig. 10A,B) (N = 6; two-way repeated-measures ANOVA; main effect of Arch on fR: F(1,5) = 87.07, p = 0.0002. Sidak's multiple comparisons: baseline vs Arch for 65%, 21%, 15% FiO2, and 12% FiO2, p < 0.0001). However, as in the CO2 supplementation experiments, acetazolamide restored only the decrease in frequency evoked by inhibiting RTN (Fig. 10A4,B1) (N = 6; two-way repeated-measures ANOVA; main effect of acetazolamide on fR: F(1,5) = 93.01, p = 0.0002) but had no effect on the VT reduction elicited by RTN inhibition under any of the oxygen concentrations tested (Fig. 10A4,B2) (N = 6; two-way repeated-measures ANOVA, main effect of acetazolamide on VT: F(1 5) = 4.08, p = 0.09, Sidak's multiple comparisons: all comparisons, p > 0.1).
Figure 10.

Acetazolamide (ACTZ) restores Arch-induced hypoventilation under hypoxia. A1, A2, Sprague Dawley rat under normoxia (21% FiO2) treated with DMSO (A1, control) or ACTZ (A2). Arch activation with laser light during gray shaded regions. A3, A4, Same rat under hypoxia (12% FiO2) after DMSO (A3) or ACTZ (A4). B, Group data (N = 6, Control = 7). B1, Reduction in fR elicited by Arch activation at different FiO2 in control (DMSO) and ACTZ-treated rats. B2, Reduction in VT elicited by Arch activation at different FiO2 in control (DMSO) and ACTZ-treated rats. B3, Reduction of VE elicited by Arch activation at different FiO2 in control (DMSO) and ACTZ-treated rats. ***p < 0.001.
In summary, during hypoxia, blood reacidification produced by increasing FiCO2 or by injection of acetazolamide restored the ability of RTN inhibition to reduce the respiratory frequency, but acidification had no detectable influence on the concomitant reduction of breathing amplitude elicited by RTN inhibition.
Relationship between pHa, PaCO2, and the breathing stimulation contributed by Arch-transduced RTN neurons
To test the contribution of pHa and PaCO2 to RTN neuron activity in conscious rats, we analyzed the relationship between ΔfR, ΔVT, and ΔVE elicited by inhibiting Arch-transduced RTN neurons and pHa or PaCO2 under the nine conditions examined (65%, 21%, 15%, and 12% FiO2, under control conditions, in the presence of 3% FiCO2, and in the presence of acetazolamide). The pHa and PCO2 values used for the linear regression analysis were the mean blood gas values shown in Table 1, and the mean values of ΔfR, ΔVT and ΔVE recorded for each of the 9 groups.
There was an extremely tight inverse correlation between ΔfR and pHa (N = 9; Pearson r = 0.93, p < 0.0002; Fig. 11A) but no correlation between ΔfR and PaCO2 (Pearson r = − 0.44, p = 0.2; Fig. 11A). Interestingly, the correlations were reversed for ΔVT. This variable was not correlated with pHa (Pearson r = 0.41, p = 0.3; Fig. 11B) but very highly correlated with PaCO2 (Pearson r = −0.91, p = 0.0007; Fig. 11E). ΔVE, which predominantly reflects changes in breathing frequency, was, as expected, highly correlated with pHa (Pearson r = 0.93, p < 0.0003; Fig. 11C), but not with PaCO2 (Pearson r = −0.49, p = 0.2; Fig. 11F). The reason why ΔfR was not correlated with PaCO2 and ΔVT to pHa became clearer when we plotted separately the results obtained with or without acetazolamide treatment. It then became apparent that the relationship between ΔfR and PaCO2 was also linear (due to the limited number of points, no statistical test was applied) but consisted of two parallel regression lines corresponding to the presence or absence of acetazolamide (Fig. 11D). Similarly, the relationship between ΔVT and pHa consisted of two parallel regression lines (Fig. 11B). Acetazolamide increases renal bicarbonate excretion; consequently, this drug lowers plasma bicarbonate considerably (Table 1). Acetazolamide must therefore change the relationship between pH and PCO2 according to the local bicarbonate concentration. This relationship is likely to be different within the environment of the CRCs than in the carotid bodies, which are bathed by the plasma. The existence of two parallel regression lines for the relationship between ΔVT and pHa and ΔfR and PaCO2 could be related to the relative contribution of CRCs and the CBs to RTN neuron activity.
Figure 11.

Relationship between arterial pH or PaCO2 and breathing drive contributed by Arch-transduced RTN neurons. A–C, x-y plots of pHa versus Arch-induced reductions in ΔfR, ΔVT, and ΔVE. Gray-filled circles represent data from acetazolamide-treated rats. Black-filled circles represent data from drug-free rats. D–F, Plots of PaCO2 versus Arch-induced ΔfR, ΔVT, and VE. Note the tight linear relationships between ΔfR and pHa and between ΔVT and PaCO2 across all experimental conditions. The calculated pH recruitment threshold (i.e., pHa below which RTN is active) was 7.53. This value was determined by the intersection of the regression line and the zero horizontal line (A). The data point at 12% FiO2 (no drug) was excluded from the linear regression analysis because ΔfR was zero and pHa (7.6) was clearly beyond the recruitment threshold. The PaCO2 recruitment threshold (i.e., PaCO2 above which RTN becomes active) was 32 mmHg. This value was obtained from E as the intersection between the linear part of the regression curve and the plateau defined by the invariant values of ΔVT measured at PaCO2 values below the estimated recruitment threshold (E). Physiological data: four levels of FiO2 (N = 9), 12% FiO2 with 3% FiCO2 (N = 7), four levels of FiO2 with acetazolamide (N = 6). Arterial blood gas: four levels of FiO2 (N = 6), 12% FiO2 with 3% FiCO2 (N = 4), four levels of FiO2 with acetazolamide (N = 4).
A recruitment threshold (the level at which RTN neurons start to be active) for pHa and PaCO2 was determined from the regression lines by postulating that these neurons were silent when Arch activation no longer changed fR (Fig. 11A) or when Arch activation reduced VT by an amount that was unchanged by further acidification or a further increase in PaCO2 (e.g., Fig. 11E). A pHa recruitment threshold of 7.53 and PaCO2 recruitment threshold of 32 mmHg (∼4.2% CO2) could thus be calculated (Fig. 11A,E, hatched line). These values are virtually identical to the recruitment threshold of RTN neurons recorded in anesthetized animals (present results; Guyenet et al., 2005). The presence of a small pH- and PCO2-independent ΔVT (∼0.07 ml/100 g; Fig. 11B,E) has several potential explanations. VT-regulating RTN neurons may not be completely silenced by alkalization in conscious animals or this residual VT reduction could result from the inhibition of Arch-transduced neurons that are not RTN neurons (e.g., the C1 cells).
In summary, this analysis shows that RTN activity tracks pHa and/or PaCO2 independently of the intensity of breathing over a wide variety of experimental conditions.
Discussion
We report several new findings: inhibiting RTN and nearby C1 neurons reduces ventilation equally during non-REM sleep and quiet waking. The hypoventilation is largest during hyperoxia, virtually eliminated during hypocapnic hypoxia, and reinstated under isocapnic hypoxia. The hypoventilation is highly correlated with pHa or PaCO2. The most plausible interpretation is that, in sleeping or quietly awake rats, RTN neurons stimulate breathing in proportion to the degree of acidification below a threshold of 7.5 pHa. C1 neuron inhibition is unlikely to have contributed to the hypoventilation, but this possibility is not entirely excluded.
Technical and interpretative limitations
Under anesthesia, Arch activation silenced RTN neurons even in the presence of 10% eeCO2. Thus, the proton pump overcame any cell-autonomous or astrocyte-dependent activation of RTN caused by hypercarbia via protons or molecular CO2 (Gourine et al., 2008; Huckstepp et al., 2010; Wang et al., 2013a). Extrapolating this finding to conscious rats seems legitimate because illumination of Arch-transduced versus ChR2-transduced RTN neurons produced opposite effects, both at the single-unit and system levels (Abbott et al., 2009b).
C1 cell activation raises both BP and ventilation (Abbott et al., 2013; Guyenet et al., 2013). Therefore, inhibition of Arch-transduced C1 neurons could have contributed to the light-evoked hypoventilation. However, if this contribution had been substantial, hypoventilation should have been greater during hypoxia, not smaller as observed, because C1 cells are strongly activated by hypoxia (Sun and Reis, 1996). Moreover, there was only a weak correlation between hypoventilation and the number of Arch-transduced catecholaminergic neurons located close to the optical fiber.
Under anesthesia, RTN neurons were silenced regardless of eeCO2 (4%–10%, corresponding to 7.5–7.2 pHa) (Guyenet et al., 2005). A pH-dependent change in proton pump efficacy is therefore unlikely to explain the inability of Arch activation to reduce breathing during hypoxia.
Astrocytes did not express Phox2b and did not contain histologically detectable levels of Arch; therefore, these cells were presumably not directly affected by light. Conceivably, astrocytes could have been depolarized by Arch-induced extracellular acidification (Chow et al., 2010; Mulkey and Wenker, 2011). The ensuing ATP release (Gourine et al., 2010) could possibly have attenuated the light-induced inhibition of RTN neurons.
RTN drives resting breathing
Whether RTN neurons drive breathing in resting conscious mammals is controversial. Li et al. (1999) concluded that RTN stimulation with CO2 increases VT in awake rats only, and Marina et al. (2010) found that RTN inhibition did not change resting ventilation. Yet, muscimol injections into RTN reduce breathing (Li et al., 2006; Takakura et al., 2013) and genetic deletion of RTN produces resting hypoventilation (Ramanantsoa et al., 2011).
Unlike other approaches, the Arch method measures the instantaneous contribution of RTN neurons to breathing with minimal interference from homeostatic compensations (CBs, other CRCs). Our results show that RTN Phox2b-expressing neurons drive resting ventilation equally during non-REM sleep and quiet waking.
Congenital central hypoventilation syndrome is tentatively attributed to Phox2b mutations that abort RTN development (Pattyn et al., 1999; Amiel et al., 2003, 2009; Goridis and Brunet, 2010; Weese-Mayer et al., 2010; Ramanantsoa et al., 2011). Sleep apnea, the defining feature of congenital central hypoventilation syndrome, occurs mostly during non-REM sleep. Our finding that RTN sustains breathing during non-REM sleep supports this theory.
RTN neurons encode pHa/PaCO2
Without acetazolamide, ΔfR and ΔVT were correlated with both pHa and PaCO2. The pHa and PaCO2 levels at which ΔfR was 0 (7.53) or ΔVT was independent of further reduction in PaCO2 (32 mmHg) indicate when RTN neurons are silent (“recruitment threshold”). These values were very close to those measured in anesthetized rats by unit recording (Guyenet et al., 2005; present results). Thus, pH and/or PaCO2 are the principal determinants of RTN activity under hypoxic, normoxic, or hyperoxic conditions in conscious resting rats.
RTN Phox2b neurons are prominent CRC candidates because they are activated by hypercarbia in vivo and are intrinsically acid-sensitive, their activation increases breathing, and deletion of the acid-sensitive channel TASK-2 from these neurons greatly reduces both their pH sensitivity and the hypercapnic chemoreflex (Gestreau et al., 2010; Guyenet et al., 2010; Wang et al., 2013b).
The tight relationship between RTN neuron activity and arterial pH/PCO2 is consistent with their CRC properties, but this pH sensitivity could also derive from surrounding astrocytes and input from other pH-responsive neurons (Deng et al., 2007; Williams et al., 2007; Dias et al., 2009; Gourine et al., 2010; Huckstepp et al., 2010; Corcoran et al., 2013; Iceman et al., 2013; Li et al., 2013).
RTN neurons: first putative CRCs demonstrably silenced by hypocapnic hypoxia
The hypothesis that hypoxia inhibits CRCs via respiratory alkalosis is long-standing (Gesell et al., 1940). Yet, we show here the first example of putative CRCs inhibited by hypocapnic hypoxia. The key evidence is that RTN photoinhibition no longer inhibited fR during hypoxia unless the plasma was reacidified with CO2 or acetazolamide (Peña and García, 2006; Bell and Haouzi, 2010). Importantly, the difference between hypoxia and normoxia was neither related to hypoxia-induced arousal nor caused by the inability of RTN neurons to drive breathing under hypoxia because activation of ChR2-transduced RTN neurons increased fR massively during hypoxia.
CB stimulation can activate fR via pathways that bypass RTN
Convergence between central and peripheral chemoreceptors on a unique set of neurons that ultimately regulate the respiratory pattern generator has long been hypothesized (Gesell et al., 1940; Loeschcke, 1982; Smith et al., 2010). Although RTN receives an excitatory input from the CBs (Takakura et al., 2006), RTN is not an obligatory relay for the peripheral chemoreflex (Fig. 12) because hypocapnic hypoxia increased fR while silencing RTN neurons. The fact that the powerful excitatory input from CBs to RTN is suppressed by alkalization further stresses the importance of pH as a regulator of RTN activity.
Figure 12.

Summary and interpretations. During eupnea (regular involuntary breathing as during non-REM sleep and quiet wake), breathing rate and amplitude are generated by a network of pontomedullary structures called the respiratory pattern generator (RPG). Under normoxia, eupneic breathing is activated by inputs (green arrows) from RTN and from the CBs. The CB pathway relays in the nucleus of the solitary tract (NTS). The CBs activate breathing via RTN and independently of RTN. RTN neurons are subject to several feedback regulations (pink lines). At rest, the most powerful regulation of RPG operates via CO2/pH. Alkalization caused by hyperventilation withdraws the direct and astrocyte-dependent excitatory effect of acid on RTN neurons. Alkalization may also reduce excitatory inputs to RTN from other CNS acid-activated neurons and activate inhibitory inputs from unidentified acid-inhibited CNS neurons. Additional feedback (pink lines) originates from lung stretch receptors (not illustrated) and the RPG (illustrated) and may protect the lungs against hyperinflation. During hypocapnic hypoxia, the CBs are highly active, drive the RPG vigorously, which increases breathing and lowers PaCO2 and arterial [H+]. The increased ventilation further activates the inhibitory feedback to RTN (solid pink lines) causing these cells to become silent. The chemical feedback (via alkalization of RTN) is the most powerful and causes RTN neurons to become silent under hypoxia despite increased excitatory input from the CBs. During hyperoxia, the CBs are inactive, but CNS [H+] and PCO2 increase because ventilation is reduced (in rats only) and because hyperoxia reduces cerebral blood flow and facilitates CO2 dumping from erythrocytes (Haldane effect). The resulting brain acidification activates RTN further; and because of the loss of the respiratory drive that originates from the CBs, RTN contributes a much larger portion of the respiratory drive than under normoxia. Green arrows indicate excitatory pathways or stimulatory effects. Dashed lines indicate weak inputs. Solid lines of increasing thickness indicate stronger input. Pink arrows indicate inhibitory pathways or feedback (intensity also coded with dashes and lines of increasing thickness). Pale green circles or boxes represent moderately active cell groups. Dark green represents high activity. Pink represents inactivity (as in CBs during hyperoxia).
CB second-order neurons and RTN neurons target multiple brainstem regions (Koshiya and Guyenet, 1996; Song et al., 2011; Bochorishvili et al., 2012). Integration between central and peripheral chemoreflexes likely occurs both within and outside RTN.
RTN is activated by hyperoxia
CBs contribute greatly to resting ventilation, even in normoxia (Olson et al., 1988; Forster et al., 2008; Smith et al., 2010). Although hyperoxia silences the CBs, ventilation is barely decreased in rats (present results; Olson et al., 1988) or mildly stimulated in humans (Becker et al., 1996; Ainslie and Duffin, 2009; Chowdhuri et al., 2010). Our results provide a potential explanation for this paradox (Fig. 12): hyperoxia activates RTN and the increased breathing stimulation contributed by this nucleus compensates (rats) or perhaps overcompensates (humans) for the reduced CB activity. This interpretation stems from the observation that, in conscious rats, silencing RTN produced a much larger hypoventilation in hyperoxia than normoxia.
Correlative evidence (Fig. 11) suggests that hyperoxia increases RTN activity largely via respiratory acidosis (reduced pHa and increased PaCO2). However, hyperoxia also acidifies the CNS via the Haldane effect and CNS vasoconstriction (Becker et al., 1996; Ainslie and Duffin, 2009; Chowdhuri et al., 2010). In humans, these alternative mechanisms presumably dominate because breathing is slightly activated by hyperoxia and respiratory alkalosis ensues (Becker et al., 1996).
Differential effect of pHa vs PaCO2 on RTN activity
Without acetazolamide, ΔfR and ΔVT were correlated with both pHa and PaCO2 regardless of the level of FiO2 or FiCO2. Therefore, CO2/pH-responsive RTN neurons regulate both breathing rate and amplitude. This is consistent with prior evidence. Activation of ChR2-transduced Phox2b RTN neurons increases fR and VT, CO2 dialysis into RTN increases VT (Li et al., 1999), and virtually all Phox2b RTN neurons respond to H+/CO2 in vitro (Lazarenko et al., 2009).
When the data collected during metabolic acidosis (acetazolamide) were incorporated, ΔfR remained correlated with pHa but was no longer correlated with PaCO2, whereas the reverse occurred for ΔVT. This could mean that distinct RTN neurons control fR versus VT. Many RTN neurons receive strong polysynaptic excitatory input from the CBs (Takakura et al., 2006). Under metabolic acidosis, the activity of these neurons may remain better correlated with pHa simply because the CBs encode pHa. These particular neurons may regulate fR preferentially because CB stimulation (hypoxia) increases fR selectively. The VT-regulating RTN neurons may respond predominantly to changes in CNS pH and may receive less CB input. If, after acetazolamide, the bicarbonate concentration were to remain higher in brain than in plasma, the activity of these RTN neurons would still track PaCO2 because CO2 is diffusible, but it would no longer correlate with pHa, as observed, because brain pH would be far less acidic. An alternative explanation is that VT-regulating RTN neurons respond preferentially to molecular CO2 (Huckstepp et al., 2010).
Pathophysiological implications
Hypoxia and conditions in which CBs are hyperactive (congestive heart failure, hypertension) cause sleep apnea and/or periodic breathing (McBryde et al., 2013; Schultz et al., 2013; Dempsey et al., 2014). Judging from the present study, CB hyperactivity should reduce RTN contribution to breathing. According to established reasoning, reduced CCR activity should promote apneas or periodic breathing (Ainslie and Duffin, 2009; Cui et al., 2012; Javaheri and Dempsey, 2013). Our results also account for the therapeutic benefits of mild hypercapnia and acetazolamide in hypoxia and congestive heart failure (Sharma et al., 2011).
Footnotes
This work was supported by National Institutes of Health Grants HL28785 and HL74011 to P.G.G.
The authors declare no competing financial interests.
References
- Abbott SB, Stornetta RL, Socolovsky CS, West GH, Guyenet PG. Photostimulation of channelrhodopsin-2 expressing ventrolateral medullary neurons increases sympathetic nerve activity and blood pressure in rats. J Physiol. 2009a;587:5613–5631. doi: 10.1113/jphysiol.2009.177535. [DOI] [PMC free article] [PubMed] [Google Scholar]
- Abbott SB, Stornetta RL, Fortuna MG, Depuy SD, West GH, Harris TE, Guyenet PG. Photostimulation of retrotrapezoid nucleus phox2b-expressing neurons in vivo produces long-lasting activation of breathing in rats. J Neurosci. 2009b;29:5806–5819. doi: 10.1523/JNEUROSCI.1106-09.2009. [DOI] [PMC free article] [PubMed] [Google Scholar]
- Abbott SB, Stornetta RL, Coates MB, Guyenet PG. Phox2b-expressing neurons of the parafacial region regulate breathing rate, inspiration, and expiration in conscious rats. J Neurosci. 2011;31:16410–16422. doi: 10.1523/JNEUROSCI.3280-11.2011. [DOI] [PMC free article] [PubMed] [Google Scholar]
- Abbott SB, Kanbar R, Bochorishvili G, Coates MB, Stornetta RL, Guyenet PG. C1 neurons excite locus coeruleus and A5 noradrenergic neurons along with sympathetic outflow in rats. J Physiol. 2012;590:2897–2915. doi: 10.1113/jphysiol.2012.232157. [DOI] [PMC free article] [PubMed] [Google Scholar]
- Abbott SB, DePuy SD, Nguyen T, Coates MB, Stornetta RL, Guyenet PG. Selective optogenetic activation of rostral ventrolateral medullary catecholaminergic neurons produces cardiorespiratory stimulation in conscious mice. J Neurosci. 2013;33:3164–3177. doi: 10.1523/JNEUROSCI.1046-12.2013. [DOI] [PMC free article] [PubMed] [Google Scholar]
- Ainslie PN, Duffin J. Integration of cerebrovascular CO2 reactivity and chemoreflex control of breathing: mechanisms of regulation, measurement, and interpretation. Am J Physiol Regul Integr Comp Physiol. 2009;296:R1473–R1495. doi: 10.1152/ajpregu.91008.2008. [DOI] [PubMed] [Google Scholar]
- Ainslie PN, Lucas SJ, Burgess KR. Breathing and sleep at high altitude. Respir Physiol Neurobiol. 2013;188:233–256. doi: 10.1016/j.resp.2013.05.020. [DOI] [PubMed] [Google Scholar]
- Amiel J, Laudier B, Attié-Bitach T, Trang H, de Pontual L, Gener B, Trochet D, Etchevers H, Ray P, Simonneau M, Vekemans M, Munnich A, Gaultier C, Lyonnet S. Polyalanine expansion and frameshift mutations of the paired-like homeobox gene PHOX2B in congenital central hypoventilation syndrome. Nat Genet. 2003;33:459–461. doi: 10.1038/ng1130. [DOI] [PubMed] [Google Scholar]
- Amiel J, Dubreuil V, Ramanantsoa N, Fortin G, Gallego J, Brunet JF, Goridis C. PHOX2B in respiratory control: lessons from congenital central hypoventilation syndrome and its mouse models. Respir Physiol Neurobiol. 2009;168:125–132. doi: 10.1016/j.resp.2009.03.005. [DOI] [PubMed] [Google Scholar]
- Aravanis AM, Wang LP, Zhang F, Meltzer LA, Mogri MZ, Schneider MB, Deisseroth K. An optical neural interface: in vivo control of rodent motor cortex with integrated fiberoptic and optogenetic technology. J Neural Eng. 2007;4:S143–S156. doi: 10.1088/1741-2560/4/3/S02. [DOI] [PubMed] [Google Scholar]
- Becker HF, Polo O, McNamara SG, Berthon-Jones M, Sullivan CE. Effect of different levels of hyperoxia on breathing in healthy subjects. J Appl Physiol. 1996;81:1683–1690. doi: 10.1152/jappl.1996.81.4.1683. [DOI] [PubMed] [Google Scholar]
- Bell HJ, Haouzi P. The hypoxia-induced facilitation of augmented breaths is suppressed by the common effect of carbonic anhydrase inhibition. Respir Physiol Neurobiol. 2010;171:201–211. doi: 10.1016/j.resp.2010.04.002. [DOI] [PubMed] [Google Scholar]
- Bochorishvili G, Stornetta RL, Coates MB, Guyenet PG. Pre-Botzinger complex receives glutamatergic innervation from galaninergic and other retrotrapezoid nucleus neurons. J Comp Neurol. 2012;520:1047–1061. doi: 10.1002/cne.22769. [DOI] [PMC free article] [PubMed] [Google Scholar]
- Brown DL, Guyenet PG. Electrophysiological study of cardiovascular neurons in the rostral ventrolateral medulla in rats. Circ Res. 1985;56:359–369. doi: 10.1161/01.RES.56.3.359. [DOI] [PubMed] [Google Scholar]
- Chow BY, Han X, Dobry AS, Qian X, Chuong AS, Li M, Henninger MA, Belfort GM, Lin Y, Monahan PE, Boyden ES. High-performance genetically targetable optical neural silencing by light-driven proton pumps. Nature. 2010;463:98–102. doi: 10.1038/nature08652. [DOI] [PMC free article] [PubMed] [Google Scholar]
- Chowdhuri S, Sinha P, Pranathiageswaran S, Badr MS. Sustained hyperoxia stabilizes breathing in healthy individuals during NREM sleep. J Appl Physiol. 2010;109:1378–1383. doi: 10.1152/japplphysiol.00453.2010. [DOI] [PMC free article] [PubMed] [Google Scholar]
- Corcoran AE, Richerson GB, Harris MB. Serotonergic mechanisms are necessary for central respiratory chemoresponsiveness in situ. Respir Physiol Neurobiol. 2013;186:214–220. doi: 10.1016/j.resp.2013.02.015. [DOI] [PMC free article] [PubMed] [Google Scholar]
- Cui Z, Fisher JA, Duffin J. Central-peripheral respiratory chemoreflex interaction in humans. Respir Physiol Neurobiol. 2012;180:126–131. doi: 10.1016/j.resp.2011.11.002. [DOI] [PubMed] [Google Scholar]
- Dejours P, Raynoud J, Cuenod CL, Labrousse Y. Instantaneous modifications of ventilation at the beginning and at the cessation of muscular exercise; interpretation. J Physiol (Paris) 1955;47:155–159. [PubMed] [Google Scholar]
- Dempsey JA, Powell FL, Bisgard GE, Blain GM, Poulin MJ, Smith CA. Role of chemoreception in cardiorespiratory acclimatization to, and deacclimatization from, hypoxia. J Appl Physiol. 2014;116:858–866. doi: 10.1152/japplphysiol.01126.2013. [DOI] [PMC free article] [PubMed] [Google Scholar]
- Deng BS, Nakamura A, Zhang W, Yanagisawa M, Fukuda Y, Kuwaki T. Contribution of orexin in hypercapnic chemoreflex: evidence from genetic and pharmacological disruption and supplementation studies in mice. J Appl Physiol. 2007;103:1772–1779. doi: 10.1152/japplphysiol.00075.2007. [DOI] [PubMed] [Google Scholar]
- Dias MB, Li A, Nattie EE. Antagonism of orexin receptor 1 (OX1R) in the retrotrapezoid nucleus (RTN) inhibits the ventilatory response to hypercapnia predominantly in wakefulness. J Physiol. 2009;587:2059–2067. doi: 10.1113/jphysiol.2008.168260. [DOI] [PMC free article] [PubMed] [Google Scholar]
- Forster HV, Martino P, Hodges M, Krause K, Bonis J, Davis S, Pan L. The carotid chemoreceptors are a major determinant of ventilatory CO2 sensitivity and of PaCO2 during eupneic breathing. Adv Exp Med Biol. 2008;605:322–326. doi: 10.1007/978-0-387-73693-8_56. [DOI] [PubMed] [Google Scholar]
- Fortuna MG, Stornetta RL, West GH, Guyenet PG. Activation of the retrotrapezoid nucleus by posterior hypothalamic stimulation. J Physiol. 2009;587:5121–5138. doi: 10.1113/jphysiol.2009.176875. [DOI] [PMC free article] [PubMed] [Google Scholar]
- Gesell R, Lapides J, Levin M. The interaction of central and peripheral control of breathing. Am J Physiol. 1940;130:155–170. [Google Scholar]
- Gestreau C, Heitzmann D, Thomas J, Dubreuil V, Bandulik S, Reichold M, Bendahhou S, Pierson P, Sterner C, Peyronnet-Roux J, Benfriha C, Tegtmeier I, Ehnes H, Georgieff M, Lesage F, Brunet JF, Goridis C, Warth R, Barhanin J. Task2 potassium channels set central respiratory CO2 and O2 sensitivity. Proc Natl Acad Sci U S A. 2010;107:2325–2330. doi: 10.1073/pnas.0910059107. [DOI] [PMC free article] [PubMed] [Google Scholar]
- Goridis C, Brunet JF. Central chemoreception: lessons from mouse and human genetics. Respir Physiol Neurobiol. 2010;173:312–321. doi: 10.1016/j.resp.2010.03.014. [DOI] [PubMed] [Google Scholar]
- Gourine AV, Dale N, Korsak A, Llaudet E, Tian F, Huckstepp R, Spyer KM. Release of ATP and glutamate in the nucleus tractus solitarii mediate pulmonary stretch receptor (Breuer-Hering) reflex pathway. J Physiol. 2008;586:3963–3978. doi: 10.1113/jphysiol.2008.154567. [DOI] [PMC free article] [PubMed] [Google Scholar]
- Gourine AV, Kasymov V, Marina N, Tang F, Figueiredo MF, Lane S, Teschemacher AG, Spyer KM, Deisseroth K, Kasparov S. Astrocytes control breathing through pH-dependent release of ATP. Science. 2010;329:571–575. doi: 10.1126/science.1190721. [DOI] [PMC free article] [PubMed] [Google Scholar]
- Guyenet PG, Mulkey DK, Stornetta RL, Bayliss DA. Regulation of ventral surface chemoreceptors by the central respiratory pattern generator. J Neurosci. 2005;25:8938–8947. doi: 10.1523/JNEUROSCI.2415-05.2005. [DOI] [PMC free article] [PubMed] [Google Scholar]
- Guyenet PG, Stornetta RL, Bayliss DA. Central respiratory chemoreception. J Comp Neurol. 2010;518:3883–3906. doi: 10.1002/cne.22435. [DOI] [PMC free article] [PubMed] [Google Scholar]
- Guyenet PG, Stornetta RL, Bochorishvili G, Depuy SD, Burke PG, Abbott SB. Invited review EB 2012: C1 neurons: the body's EMTs. Am J Physiol Regul Integr Comp Physiol. 2013;305:R187–R204. doi: 10.1152/ajpregu.00054.2013. [DOI] [PMC free article] [PubMed] [Google Scholar]
- Han X, Chow BY, Zhou H, Klapoetke NC, Chuong A, Rajimehr R, Yang A, Baratta MV, Winkle J, Desimone R, Boyden ES. A high-light sensitivity optical neural silencer: development and application to optogenetic control of non-human primate cortex. Front Syst Neurosci. 2011;5:18. doi: 10.3389/fnsys.2011.00018. [DOI] [PMC free article] [PubMed] [Google Scholar]
- Hirooka Y, Polson JW, Potts PD, Dampney RAL. Hypoxia-induced Fos expression in neurons projecting to the pressor region in the rostral ventrolateral medulla. Neurosci. 1997;80:1209–1224. doi: 10.1016/S0306-4522(97)00111-5. [DOI] [PubMed] [Google Scholar]
- Huckstepp RT, Dale N. Redefining the components of central CO2 chemosensitivity: towards a better understanding of mechanism. J Physiol. 2011;589:5561–5579. doi: 10.1113/jphysiol.2011.214759. [DOI] [PMC free article] [PubMed] [Google Scholar]
- Huckstepp RT, id Bihi R, Eason R, Spyer KM, Dicke N, Willecke K, Marina N, Gourine AV, Dale N. Connexin hemichannel-mediated CO2-dependent release of ATP in the medulla oblongata contributes to central respiratory chemosensitivity. J Physiol. 2010;588:3901–3920. doi: 10.1113/jphysiol.2010.192088. [DOI] [PMC free article] [PubMed] [Google Scholar]
- Hwang DY, Carlezon WA, Jr, Isacson O, Kim KS. A high-efficiency synthetic promoter that drives transgene expression selectively in noradrenergic neurons. Hum Gene Ther. 2001;12:1731–1740. doi: 10.1089/104303401750476230. [DOI] [PubMed] [Google Scholar]
- Iceman KE, Richerson GB, Harris MB. Medullary serotonin neurons are CO2-sensitive in situ. J Neurophysiol. 2013;110:2536–2544. doi: 10.1152/jn.00288.2013. [DOI] [PMC free article] [PubMed] [Google Scholar]
- Javaheri S, Dempsey JA. Central sleep apnea. Compr Physiol. 2013;3:141–163. doi: 10.1002/cphy.c110057. [DOI] [PubMed] [Google Scholar]
- Jespersen B, Knupp L, Northcott CA. Femoral arterial and venous catheterization for blood sampling, drug administration and conscious blood pressure and heart rate measurements. J Vis Exp. 2012;24:3496. doi: 10.3791/3496. [DOI] [PMC free article] [PubMed] [Google Scholar]
- Koshiya N, Guyenet PG. NTS neurons with carotid chemoreceptor inputs arborize in the rostral ventrolateral medulla. Am J Physiol Regul Integr Comp Physiol. 1996;270:R1273–R1278. doi: 10.1152/ajpregu.1996.270.6.R1273. [DOI] [PubMed] [Google Scholar]
- Kumar P, Prabhakar NR. Peripheral chemoreceptors: function and plasticity of the carotid body. Compr Physiol. 2012;2:141–219. doi: 10.1002/cphy.c100069. [DOI] [PMC free article] [PubMed] [Google Scholar]
- Lazarenko RM, Milner TA, Depuy SD, Stornetta RL, West GH, Kievits JA, Bayliss DA, Guyenet PG. Acid sensitivity and ultrastructure of the retrotrapezoid nucleus in Phox2b-EGFP transgenic mice. J Comp Neurol. 2009;517:69–86. doi: 10.1002/cne.22136. [DOI] [PMC free article] [PubMed] [Google Scholar]
- Li A, Randall M, Nattie EE. CO(2) microdialysis in retrotrapezoid nucleus of the rat increases breathing in wakefulness but not in sleep. J Appl Physiol. 1999;87:910–919. doi: 10.1152/jappl.1999.87.3.910. [DOI] [PubMed] [Google Scholar]
- Li A, Zhou S, Nattie E. Simultaneous inhibition of caudal medullary raphe and retrotrapezoid nucleus decreases breathing and the CO2 response in conscious rats. J Physiol. 2006;577:307–318. doi: 10.1113/jphysiol.2006.114504. [DOI] [PMC free article] [PubMed] [Google Scholar]
- Li N, Li A, Nattie E. Focal microdialysis of CO(2) in the perifornical-hypothalamic area increases ventilation during wakefulness but not NREM sleep. Respir Physiol Neurobiol. 2013;185:349–355. doi: 10.1016/j.resp.2012.09.007. [DOI] [PMC free article] [PubMed] [Google Scholar]
- Loeschcke HH. Central chemosensitivity and the reaction theory. J Physiol. 1982;332:1–24. doi: 10.1113/jphysiol.1982.sp014397. [DOI] [PMC free article] [PubMed] [Google Scholar]
- Madden CJ, Sved AF. Cardiovascular regulation after destruction of the C1 cell group of the rostral ventrolateral medulla in rats. Am J Physiol Heart Circ Physiol. 2003;285:H2734–H2748. doi: 10.1152/ajpheart.00155.2003. [DOI] [PubMed] [Google Scholar]
- Marina N, Abdala AP, Trapp S, Li A, Nattie EE, Hewinson J, Smith JC, Paton JF, Gourine AV. Essential role of Phox2b-expressing ventrolateral brainstem neurons in the chemosensory control of inspiration and expiration. J Neurosci. 2010;30:12466–12473. doi: 10.1523/JNEUROSCI.3141-10.2010. [DOI] [PMC free article] [PubMed] [Google Scholar]
- Mattis J, Tye KM, Ferenczi EA, Ramakrishnan C, O'Shea DJ, Prakash R, Gunaydin LA, Hyun M, Fenno LE, Gradinaru V, Yizhar O, Deisseroth K. Principles for applying optogenetic tools derived from direct comparative analysis of microbial opsins. Nat Methods. 2012;9:159–172. doi: 10.1038/nmeth.1808. [DOI] [PMC free article] [PubMed] [Google Scholar]
- McBryde FD, Abdala AP, Hendy EB, Pijacka W, Marvar P, Moraes DJ, Sobotka PA, Paton JF. The carotid body as a putative therapeutic target for the treatment of neurogenic hypertension. Nat Commun. 2013;4:2395. doi: 10.1038/ncomms3395. [DOI] [PubMed] [Google Scholar]
- Mulkey DK, Wenker IC. Astrocyte chemoreceptors: mechanisms of H+ sensing by astrocytes in the retrotrapezoid nucleus and their possible contribution to respiratory drive. Exp Physiol. 2011;96:400–406. doi: 10.1113/expphysiol.2010.053140. [DOI] [PMC free article] [PubMed] [Google Scholar]
- Mulkey DK, Stornetta RL, Weston MC, Simmons JR, Parker A, Bayliss DA, Guyenet PG. Respiratory control by ventral surface chemoreceptor neurons in rats. Nat Neurosci. 2004;7:1360–1369. doi: 10.1038/nn1357. [DOI] [PubMed] [Google Scholar]
- Nattie E. Julius H. Comroe, Jr., distinguished lecture: central chemoreception: then and now. J Appl Physiol. 2011;110:1–8. doi: 10.1152/japplphysiol.01061.2010. [DOI] [PMC free article] [PubMed] [Google Scholar]
- Olson EB, Jr, Vidruk EH, Dempsey JA. Carotid body excision significantly changes ventilatory control in awake rats. J Appl Physiol. 1988;64:666–671. doi: 10.1063/1.341959. [DOI] [PubMed] [Google Scholar]
- Pappenheimer JR. Sleep and respiration of rats during hypoxia. J Physiol. 1977;266:191–207. doi: 10.1113/jphysiol.1977.sp011763. [DOI] [PMC free article] [PubMed] [Google Scholar]
- Pattyn A, Morin X, Cremer H, Goridis C, Brunet JF. The homeobox gene Phox2b is essential for the development of autonomic neural crest derivatives. Nature. 1999;399:366–370. doi: 10.1038/20700. [DOI] [PubMed] [Google Scholar]
- Paxinos G, Watson C. The rat brain in stereotaxic coordinates. Ed 5. San Diego: Elsevier Academic; 2005. [Google Scholar]
- Peña F, García O. Breathing generation and potential pharmacotherapeutic approaches to central respiratory disorders. Curr Med Chem. 2006;13:2681–2693. doi: 10.2174/092986706778201602. [DOI] [PubMed] [Google Scholar]
- Phillipson EA, Sullivan CE, Read DJ, Murphy E, Kozar LF. Ventilatory and waking responses to hypoxia in sleeping dogs. J Appl Physiol. 1978;44:512–520. doi: 10.1152/jappl.1978.44.4.512. [DOI] [PubMed] [Google Scholar]
- Ramanantsoa N, Hirsch MR, Thoby-Brisson M, Dubreuil V, Bouvier J, Ruffault PL, Matrot B, Fortin G, Brunet JF, Gallego J, Goridis C. Breathing without CO2 chemosensitivity in conditional Phox2b mutants. J Neurosci. 2011;31:12880–12888. doi: 10.1523/JNEUROSCI.1721-11.2011. [DOI] [PMC free article] [PubMed] [Google Scholar]
- Sato M, Severinghaus JW, Basbaum AI. Medullary CO2 chemoreceptor neuron identification by c-fos immunocytochemistry. J Appl Physiol. 1992;73:96–100. doi: 10.1152/jappl.1992.73.1.96. [DOI] [PubMed] [Google Scholar]
- Schultz HD, Marcus NJ, Del Rio R. Role of the carotid body in the pathophysiology of heart failure. Curr Hypertens Rep. 2013;15:356–362. doi: 10.1007/s11906-013-0368-x. [DOI] [PMC free article] [PubMed] [Google Scholar]
- Sharma B, McSharry D, Malhotra A. Sleep disordered breathing in patients with heart failure: pathophysiology and management. Curr Treat Options Cardiovasc Med. 2011;13:506–516. doi: 10.1007/s11936-011-0145-6. [DOI] [PMC free article] [PubMed] [Google Scholar]
- Smith CA, Rodman JR, Chenuel BJ, Henderson KS, Dempsey JA. Response time and sensitivity of the ventilatory response to CO2 in unanesthetized intact dogs: central vs peripheral chemoreceptors. J Appl Physiol. 2006;100:13–19. doi: 10.1152/japplphysiol.00926.2005. [DOI] [PubMed] [Google Scholar]
- Smith CA, Forster HV, Blain GM, Dempsey JA. An interdependent model of central/peripheral chemoreception: evidence and implications for ventilatory control. Respir Physiol Neurobiol. 2010;173:288–297. doi: 10.1016/j.resp.2010.02.015. [DOI] [PMC free article] [PubMed] [Google Scholar]
- Smith JC, Morrison DE, Ellenberger HH, Otto MR, Feldman JL. Brainstem projections to the major respiratory neuron populations in the medulla of the cat. J Comp Neurol. 1989;281:69–96. doi: 10.1002/cne.902810107. [DOI] [PubMed] [Google Scholar]
- Song G, Xu H, Wang H, Macdonald SM, Poon CS. Hypoxia-excited neurons in NTS send axonal projections to Kolliker-Fuse/parabrachial complex in dorsolateral pons. Neuroscience. 2011;175:145–153. doi: 10.1016/j.neuroscience.2010.11.065. [DOI] [PMC free article] [PubMed] [Google Scholar]
- Sparta DR, Stamatakis AM, Phillips JL, Hovelsø N, van Zessen R, Stuber GD. Construction of implantable optical fibers for long-term optogenetic manipulation of neural circuits. Nat Protoc. 2012;7:12–23. doi: 10.1038/nprot.2011.413. [DOI] [PMC free article] [PubMed] [Google Scholar]
- Stornetta RL, Moreira TS, Takakura AC, Kang BJ, Chang DA, West GH, Brunet JF, Mulkey DK, Bayliss DA, Guyenet PG. Expression of Phox2b by brainstem neurons involved in chemosensory integration in the adult rat. J Neurosci. 2006;26:10305–10314. doi: 10.1523/JNEUROSCI.2917-06.2006. [DOI] [PMC free article] [PubMed] [Google Scholar]
- Sun MK, Reis DJ. Hypoxia selectively excites vasomotor neurons of rostral ventrolateral medulla in rats. Am J Physiol Regul Integr Comp Physiol. 1994;266:R245–R256. doi: 10.1152/ajpregu.1994.266.1.R245. [DOI] [PubMed] [Google Scholar]
- Sun MK, Reis DJ. Medullary vasomotor activity and hypoxic sympathoexcitation in pentobarbital-anesthetized rats. Am J Physiol Regul Integr Comp Physiol. 1996;270:R348–R355. doi: 10.1152/ajpregu.1996.270.2.R348. [DOI] [PubMed] [Google Scholar]
- Swenson ER. Carbonic anhydrase inhibitors and high altitude illnesses. Subcell Biochem. 2014;75:361–386. doi: 10.1007/978-94-007-7359-2_18. [DOI] [PubMed] [Google Scholar]
- Takakura AC, Moreira TS, Colombari E, West GH, Stornetta RL, Guyenet PG. Peripheral chemoreceptor inputs to retrotrapezoid nucleus (RTN) CO2-sensitive neurons in rats. J Physiol. 2006;572:503–523. doi: 10.1113/jphysiol.2005.103788. [DOI] [PMC free article] [PubMed] [Google Scholar]
- Takakura AC, Moreira TS, De Paula PM, Menani JV, Colombari E. Control of breathing and blood pressure by parafacial neurons in conscious rats. Exp Physiol. 2013;98:304–315. doi: 10.1113/expphysiol.2012.065128. [DOI] [PubMed] [Google Scholar]
- Teppema LJ, Veening JG, Kranenburg A, Dahan A, Berkenbosch A, Olievier C. Expression of c-fos in the rat brainstem after exposure to hypoxia and to normoxic and hyperoxic hypercapnia. J Comp Neurol. 1997;388:169–190. doi: 10.1002/(SICI)1096-9861(19971117)388:2<169::AID-CNE1>3.0.CO%3B2-%23. [DOI] [PubMed] [Google Scholar]
- Wang S, Shi Y, Shu S, Guyenet PG, Bayliss DA. Phox2b-expressing retrotrapezoid neurons are intrinsically responsive to acidification and CO2. J Neurosci. 2013a;33:7756–7761. doi: 10.1523/JNEUROSCI.5550-12.2013. [DOI] [PMC free article] [PubMed] [Google Scholar]
- Wang S, Benamer N, Zanella S, Kumar NN, Shi Y, Bévengut M, Penton D, Guyenet PG, Lesage F, Gestreau C, Barhanin J, Bayliss DA. TASK-2 channels contribute to pH sensitivity of retrotrapezoid nucleus chemoreceptor neurons. J Neurosci. 2013b;33:16033–16044. doi: 10.1523/JNEUROSCI.2451-13.2013. [DOI] [PMC free article] [PubMed] [Google Scholar]
- Weese-Mayer DE, Berry-Kravis EM, Ceccherini I, Keens TG, Loghmanee DA, Trang H. An official ATS clinical policy statement: congenital central hypoventilation syndrome: genetic basis, diagnosis, and management. Am J Respir Crit Care Med. 2010;181:626–644. doi: 10.1164/rccm.200807-1069ST. [DOI] [PubMed] [Google Scholar]
- Williams RH, Jensen LT, Verkhratsky A, Fugger L, Burdakov D. Control of hypothalamic orexin neurons by acid and CO2. Proc Natl Acad Sci U S A. 2007;104:10685–10690. doi: 10.1073/pnas.0702676104. [DOI] [PMC free article] [PubMed] [Google Scholar]