

Abstract
The modulation of gamma power (25–90 Hz) is associated with attention and has been observed across species and brain areas. However, mechanisms that control these modulations are poorly understood. The midbrain spatial attention network in birds generates high-amplitude gamma oscillations in the local field potential that are thought to represent the highest priority location for attention. Here we explore, in midbrain slices from chickens, mechanisms that regulate the power of these oscillations, using high-resolution techniques including intracellular recordings from neurons targeted by calcium imaging. The results identify a specific subtype of neuron, expressing non-α7 nicotinic acetylcholine receptors, that directly drives inhibition in the gamma-generating circuit and switches the network into a primed state capable of producing high-amplitude oscillations. The special properties of this mechanism enable rapid, persistent changes in gamma power. The brain may employ this mechanism wherever rapid modulations of gamma power are critical to information processing.
Keywords: acetylcholine, attention, gamma oscillations, non-α7 nicotinic receptor, optic tectum, superior colliculus
Introduction
Neural activity that is periodic in the gamma band (25–90 Hz) occurs in multiple regions of the brain (Ainsworth et al., 2011; Sridharan et al., 2011; Goddard et al., 2012; Stitt et al., 2013). In many brain regions, this periodic activity is modulated during attention (Fries et al., 2001; Fries, 2009; Gregoriou et al., 2009; Chalk et al., 2010; Khayat et al., 2010). When animals attend to a stimulus, gamma-band power in neuronal populations encoding the stimulus typically increases, reflecting a local synchronization of neural activity. Increased synchrony at gamma frequencies has been proposed as a mechanism for selectively routing and enhancing the transmission of information to downstream networks and for synchronizing activity within and across networks (Fries, 2005; Deco and Thiele, 2009; Jia and Kohn, 2011; Marín et al., 2012).
Although modulations of gamma power have been widely observed, the mechanisms that regulate gamma power are unclear. However, evidence from multiple systems suggests the involvement of cholinergic signaling (Buhl et al., 1998; Fisahn et al., 1998; Cape et al., 2000; Rodriguez et al., 2004). Furthermore, dysregulation of cholinergic signaling and of gamma oscillations co-occurs in many neurological disorders (Herrmann and Demiralp, 2005; Gotti et al., 2006; Uhlhaas and Singer, 2006, 2010; Lenz et al., 2008), consistent with a causal relationship.
A linkage between cholinergic signaling and the control of attention has also been established (Davidson et al., 1999; Disney et al., 2007; Herrero et al., 2008; Guillem et al., 2011; Hasselmo and Sarter, 2011). In addition, the paired disruption of cholinergic signaling and attention found in many neurological disorders (Gotti et al., 2006; Uhlhaas and Singer, 2006; Sarter et al., 2009) suggests a mechanistic linkage (Deco and Thiele, 2009; Hasselmo and Sarter, 2011; Bloem et al., 2014).
Here, we describe a cholinergic mechanism that directly links cholinergic signaling to the regulation of gamma power in a brain region critical for attention. The midbrain spatial attention network comprises the multilayered optic tectum (OT; SC, in mammals) and interconnected inhibitory and cholinergic nuclei located in the midbrain tegmentum (Knudsen, 2011). The network combines information about the relative strengths of competing sensory stimuli with descending information from the forebrain to compute the highest priority location for attention (Fecteau and Munoz, 2006; Mysore and Knudsen, 2014). The prioritized location is represented by high-power gamma oscillations in the local field potential (LFP) in the OT space map, and by spike-field coherence in activity ascending from the OT to the forebrain (Sridharan et al., 2011; Marín et al., 2012).
Previous research demonstrated that the midbrain network contains its own gamma-generating circuit. In slices of the avian midbrain network, in vitro, electrical microstimulation applied to retinal afferents in the OT evoked high-amplitude gamma oscillations, the properties of which strongly resembled those recorded in vivo (Sridharan et al., 2011, Goddard et al., 2012). Importantly, when antagonists to both nicotinic and muscarinic acetylcholine receptors (AChRs) were added to the bath, the power of these oscillations decreased dramatically. Here, we explore the mechanisms that underlie this cholinergic regulation of gamma power.
Materials and Methods
The experiments were conducted in compliance with the guidelines set forth by the Stanford Institutional Animal Care and Use Committee.
In vitro slice preparation.
Transverse midbrain slices were prepared as previously described (Goddard et al., 2012). In brief, male and female White Leghorn and Rhode Island Red chicks (Gallus gallus), aged P0–P11, were anesthetized with isoflurane and decapitated. Brains were removed and transferred to ice-cold (4°C), oxygenated (95% O2, 5% CO2) slicing solution containing the following (in mm): 234 sucrose, 11 glucose, 24 NaHCO3, 2.5 KCl, 1.25 NaHPO4, 10 MgSO4, and 0.5 CaCl2. The lobes of the optic tecta were dissected and embedded in low-melting temperature agarose (3%; Sigma, A2756). Transverse slices (300–400 μm) were cut using a Leica VT1200 microtome. Slices were incubated in warm (34°C), oxygenated ACSF, containing the following (in mm): 10 glucose, 26 NaHCO3, 1.25 NaHPO4, 2.5 KCl, 1 MgSO4, 2 CaCl2, and 126 NaCl (298 mOsm) for 30 min, and were subsequently incubated at room temperature (23°C) for a minimum of 30 min before recording. When recording extracellular activity in nucleus isthmi pars parvocellularis (Ipc)-OT connected slices, MgSO4 was 1.5 mm. Ipc-OT disconnected slices were produced by surgically transecting, using a number 10 scalpel blade, the white matter tract that contains the tecto-isthmic and isthmo-tectal connections.
In vitro slice recordings.
Extracellular unit, LFP, and patch-clamp recordings were made as described previously (Goddard et al., 2012). Slices were perfused in a submerged chamber with ACSF at a rate of 2–3 mL/min. Signals were amplified with a Multiclamp 700B (Molecular Devices), high-pass filtered at 0.1 Hz, digitized by a Digidata 1400 (Molecular Devices) at 20 kHz, and acquired using pClamp 10 software.
When recording evoked gamma power, experiments were performed at near-physiological temperature (34°C), a temperature slightly below the normal body temperature of a chicken (41°C). For experiments in which oscillatory activity was irrelevant, the experiments were performed at room temperature (23°C).
For whole-cell patch-clamp recordings, borosilicate glass pipettes (impedance: 6–12 mΩ) were filled with a cesium-gluconate internal solution containing the following (in mm): 130 Cs-gluconate, 10 CsCl, 2 NaCl, 10 HEPES, 4 EGTA, 5 QX-314, and 2% biocytin, pH 7.3 (280–290 mOsm). When recording excitatory currents, cells were voltage clamped at a membrane potential (−55 mV) that minimized inhibitory currents; after correcting for a junction potential of −16 mV, the membrane potential was slightly depolarized relative to the calculated inhibitory reversal potential of −61 mV. When recording inhibitory currents, cells were voltage clamped at a potential (+10 mV; junction potential corrected: −6 mV) that minimized excitatory currents. For LFP recordings, borosilicate glass electrodes (impedance: 200–850 kΩ) were filled with ACSF. All signals were high-pass filtered at 0.1 Hz.
Retinal afferents were stimulated with a theta glass electrode, pulled as a patch pipette, and filled with ACSF. Single electrical pulses (duration: 100 μs, amplitude: <3.7 mA) were delivered to retinal afferents in layer 1 (L1) once every 30–60 s. Focal puffs (duration: 25 ms) of ACh (10 mm) were delivered from borosilicate glass patch pipettes (impedance: 6–12 mΩ; Sutter Instruments).
Calcium imaging.
We prepared Oregon Green calcium indicator as previously described (Goddard et al., 2014). In brief, powdered Oregon Green-488 BAPTA-1 AM (OGB-1; 50 mg Invitrogen 0–6807) was dissolved in a solution of pluronic F-127 (P-6867; Invitrogen), DMSO, and HEPES ACSF containing the following (in mm): 10 glucose, 136 NaCl, 2.5 KCl, 1.3 MgCl2, 10 HEPES, and 2 CaCl2, to a final concentration of 1 mm OGB, 2% pluronic F-127, and 10% DMSO. The resulting volume was run through a centrifuge tube filter (Co-Star Spin X, 0.22 μm pore; Sigma). The filtered solution was injected focally into slices with borosilicate glass injectors pulled as patch pipettes. The injector tip was positioned 50–100 μm below the surface of layer (L)10, and positive pressure was applied for 2 min, after which slices were allowed to equilibrate for 15 min.
We acquired stimulus-locked changes in the fluorescent signal by focally puffing ACh in L10, in the presence of ionotropic glutamate receptor blockers (dl-APV, 50 μm; Sigma, A5282; CNQX, 10 μm, Tocris Bioscience), while imaging at 63×. Epifluorescent illumination was passed through a filter cube (excitation, D450/50×; dichroic, 505DCXT; emission, E515LPv2; Chroma Technology). A shutter (Smartshutter; Sutter Instruments) controlled illumination timing. Images were captured for 4 s, at a rate of 8 frames/s, using a Retiga 4000R Fast camera and QCapture Pro 5.0 software (QImaging). Cumulative poststimulus ΔF/F images, calculated with custom MATLAB code (The MathWorks; Goddard et al., 2014), were overlaid with bright-field images (contrast enhanced using Dodt illumination). These overlays guided whole-cell patch-clamp recordings from ACh-responsive L10 neurons.
Pharmacology.
Drugs were dissolved in ACSF to the following final concentrations: atropine sulfate (5 μm; Sigma A0257), mecamylamine (MEC; 10 μm; Tocris Bioscience), dihydro-β-erythrodine (DHβE; 10 μm; Tocris Bioscience), α-bungarotoxin (aBTX; 50 nm; Tocris Bioscience), dl-APV (50 μm;Sigma, A5282), CNQX (10 μm; Tocris Bioscience), TTX (500 nm; Tocris Bioscience).
Anatomy and immunohistochemistry.
For immunostaining of Ca2+/ CaMKIIα and parvalbumin, transverse midbrain slices were prepared, fixed in 4% paraformaldehyde overnight, sunk in 30% sucrose, and re-sectioned to 50 μm. These sections were placed in PBS + 0.1% Triton X-100 with 5% normal goat serum (block solution) for 1 h. The sections were exposed to primary antibodies diluted in block solution over two nights at 4°C: mouse anti-CaMKIIα (1/500; Abcam, ab22609) and mouse anti-parvalbumin (1/2000; Sigma, P3088). Secondary antibodies in PBS (1/300) were applied for 2 h.
For Ipc axon anatomy, a P13 chick was anesthetized with isoflurane and prepared for surgery. Two-hundred and fifty nanoliters of avian adeno-associated virus (A3V) with enhanced GFP (eGFP) under the rous sarcoma virus promoter (generously provided by Matsui et al., 2012) was injected into the Ipc over a period of 2.5 min using a Nanofil injection system (WPI). Following completion of the injection, the needle was left in the brain for 5 min and then slowly retracted. The scalp was sutured and the animal monitored postoperatively. After 4 d survival, the animal was anesthetized and perfused transcardially with cold saline and 4% paraformaldehyde. After overnight fixation, the brain was sunk in 30% sucrose and re-sectioned in the transverse plane to 40 μm. Images were acquired with a Zeiss LSM 710 confocal microscope with a 40× oil-immersion objective. An entire OT column was imaged with a 3 × 5 array of z-stacks. The z-stacks were stitched together with Zeiss Zen software and subsequently compressed to a maximum intensity projection with ImageJ.
For Nissl staining of the midbrain, a P21 bird was anesthetized and perfused transcardially with cold saline followed by 4% paraformaldehyde. After overnight postfixation, brains were sunk in 30% sucrose and sectioned (50 μm) in the transverse plane. Sections were mounted on glass slides, incubated in formalin for 10 min, rehydrated, and treated with cresyl violet for 3–5 min. The sections were then dehydrated and coverslipped. Images were acquired with an epifluorescent Nikon microscope.
Data analysis.
LFP gamma power was analyzed using MATLAB (R2013b; The MathWorks), similarly to previous studies (Goddard et al., 2012). However, here we report evoked rather than induced gamma power. Traces were bandpass filtered at 20–60 Hz and the evoked response during the 50–250 ms period following the electrical stimulus pulse was measured; the first 50 ms was excluded to eliminate contamination by the stimulus artifact. The time window was selected to reflect the median duration of evoked gamma oscillations (see Results). For comparison, a baseline measurement was recorded 2800–3000 ms following electrical stimulation. Evoked gamma power was calculated as follows: p = 20*log(Ra/Rb), where Ra equals the RMS amplitude for the analysis window, and Rb equals the RMS amplitude for the baseline.
Spectral analysis was performed using multitaper spectral estimation with the Chronux toolbox (Mitra and Bokil, 2008). LFP recordings were bandpass filtered between 5 and 200 Hz. Ratio spectra (R-spectra) were computed by normalizing spectral power at each frequency by power at that frequency during the poststimulation baseline.
For analysis of Ipc spiking, recordings were high-pass filtered at 100 Hz. Spikes occurring during the analysis window (50–250 ms following the electrical stimulus pulse) were identified as voltage deflections >2 significant differences above baseline deflections. The accuracy of spike detection was visually confirmed for each sweep.
Direct and synaptically mediated postsynaptic currents (PSCs) were measured as deflections >2 significant differences from mean voltage before stimulus presentation. For single electrical stimulations or ACh puffs, PSCs were measured from 0.2 to 2.2 s following stimulus presentation. Desensitization of ACh direct responses was measured from 0.2 to 1.7 s following the first or second ACh puff. Evoked charge transfer, in μC (pA*ms), was calculated as the difference between poststimulus charge transfer and prestimulus spontaneous charge transfer. Time to half-maximum was defined as the first time point at which current amplitude (in pA) was greater than half peak-baseline amplitude during the rise to peak. Time to half-decay was defined correspondingly, based on the return to baseline. For experiments measuring extracellular activity, individual sites (n) represent separate slices. For experiments that only involved measuring current responses, individual sites (n) represent separate neurons.
Statistical tests.
To compare measurements between drug conditions, both for extracellular and whole-cell patch-clamp recordings, we used the Wilcoxon matched-pairs signed rank test, a nonparametric version of the paired t test. To determine whether ACh puffs drove significant synaptic currents, we used the Wilcoxon signed rank test, a nonparametric version of the one-sample t test, to compare the measured charge transfer to a median transfer of zero. When comparing gamma power in Ipc-OT disconnected slices, we used the Kruskal–Wallis test, a nonparametric ANOVA, with a Dunn's multiple-comparison post hoc test. To compare the kinetics of the two kinds of AChR currents, we used the Mann–Whitney U test. For all experiments, we report median values and interquartile (25 and 75%) ranges obtained from multiple stimulus repetitions (5–10 when recording gamma oscillations; 2–10 when recording IPSCs alone; and 5–20 when recording direct ACh currents).
Results
Nicotinic, but not muscarinic, AChRs control gamma power
As a first step toward elucidating the mechanism by which ACh controls gamma power in the avian midbrain spatial attention network, we investigated the types of AChRs that regulate gamma power in vitro (see Materials and Methods). Persistent gamma oscillations in the LFP [median duration: 287 ms, interquartile range (iqr) 227–392 ms] were evoked by delivering a single pulse of electrical microstimulation to retinal afferents in L1 of the OT (Fig. 1A–C). The frequency of peak LFP power ranged from 20 to 60 Hz, a frequency range slightly lower than is recorded in vivo (Sridharan et al., 2011), likely due to various slice conditions, including temperature (see Materials and Methods). The LFP oscillations were of greatest amplitude when measured in L5 of the OT, where they were accompanied by synchronized bursts of spikes (Fig. 1C, top trace). Therefore, we tested the effects of selectively blocking nicotinic versus muscarinic AChRs while recording evoked LFP and spike activity in L5.
Figure 1.

nAChR blockade decreases gamma power and increases axon spike rates in layer 5 of the OT. A, Top, Diagram of the chick brain. Shaded lobe, the OT; dashed line, transverse plane of tissue slicing. Bottom, Nissl-stained transverse slice of the chick midbrain. Arrow, Ipc, located medial to the multilayered OT; bracket, L10 of the OT. Scale bar, 500 μm. M, medial; d, dorsal. B, Schematic of the experimental setup: extracellular recording electrode (black) in L5 of the superficial OT layers (OTs) and stimulating electrode (lightning bolt) in L1. Gray circuitry, L10b neuron (left), L10a neuron (middle), Ipc neuron (right). Hashed rectangle, The dense axonal arbor of the Ipc axon. C, Example recordings before nAChR blockade. Top, Signal high-pass filtered at 0.1 Hz for LFP and Ipc axon spikes. Bottom, Signal bandpass filtered at 20–60 Hz for LFP. Bar, Analysis window for RMS power and spike rates. Arrow, Timing of electrical pulse. D, Example recordings in the presence of the nAChR antagonist MEC (10 μm). Conventions as in C. E, Summary of effect of nAChR blockade on gamma power for all experiments (n = 14 slices; each point represents median values from a single slice). Inset, Histogram of difference in power for each slice during control conditions versus during nAChR blockade. **p < 0.001. F, Summary of effect of nAChR blockade on firing rates of Ipc axons recorded in L5 for all experiments (n = 14 slices). Inset, Histogram of difference in spike rates for each slice during control conditions versus during nAChR blockade. Conventions as in E. **p < 0.005.
Results from an example experiment are shown in Figure 1B–D. A single electrical pulse delivered to L1 (Fig. 1B) evoked persistent bursts of spikes (Fig. 1C, top trace) that were phase locked with persistent, high-amplitude gamma oscillations in the LFP (Fig. 1C, bottom trace). Blocking nicotinic AChRs (nAChRs) with the pan-nAChR antagonist MEC (10 μm) both increased the number of spike responses and reduced LFP gamma power (Fig. 1D). These effects were observed consistently across a population of sites: blocking nAChRs reduced median gamma power (Fig. 1E; control: 43.3 dB, iqr 39.9–48.5 dB; nAChR blockade: 36.9 dB, iqr 29.9–42.4; n = 14; p < 0.001, Wilcoxon matched pairs signed rank test) and increased average spike rates (Fig. 1F; control: 82 spikes/s, iqr 69–91 spikes/s; nAChR blockade 98 spikes/s, iqr 90–122 spikes/s; n = 14; p < 0.005, Wilcoxon matched pairs signed rank test).
In contrast, blocking muscarinic AChRs with atropine (5 μm) resulted in no consistent effect on either LFP power or spike rates (Fig. 2). Median LFP gamma power did not decrease (Fig. 2A–C; control: 39.3 dB, iqr 34.2–41.7 dB; muscarinic AChR blockade: 40.2 dB, iqr 36.0–50.7 dB; n = 15; p = 0.12, Wilcoxon matched pairs signed rank test), and average spike rates did not change (Fig. 2D; control: 87 spikes/s, iqr 63–105 spikes/s; muscarinic AChR blockade: 99 spikes/s, iqr 78–114 spikes/s; n = 15; p = 0.14, Wilcoxon matched pairs signed rank test). These results demonstrate that, although muscarinic AChRs may influence long-term excitability or plasticity in the midbrain network (DeBello and Knudsen, 2004; Origlia et al., 2008), nicotinic AChRs are primarily responsible for cholinergic modulation of gamma power in the network.
Figure 2.
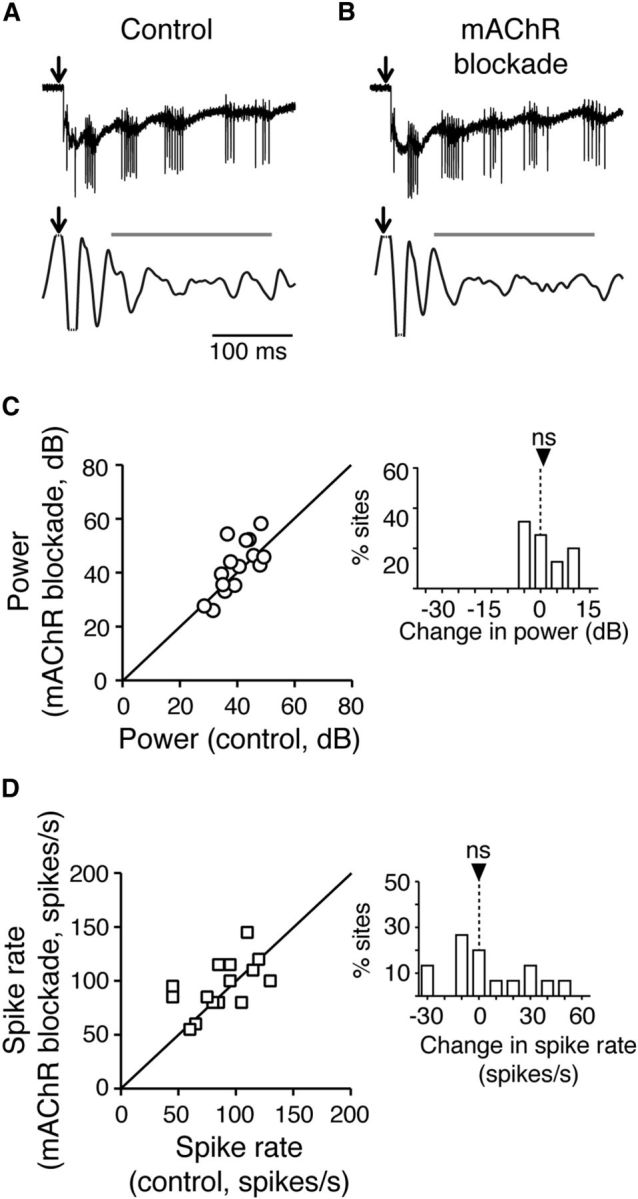
Muscarinic AChR (mAChR) blockade has no effect on gamma power or axon spike rates in layer 5 of the OT. A, Example recordings before muscarinic AChR blockade. Conventions as in Figure 1C. B, Example recordings in the presence of mAChR antagonist atropine (5 μm). Conventions as in Figure 1D. C, Summary of effect of mAChR blockade on gamma power for all experiments (n = 15 slices). Conventions as in Figure 1E. ns: p = 0.12. D, Summary of effect of mAChR blockade on spike rates of Ipc axons recorded in L5 for all experiments (n = 15 slices). Conventions as in Figure 1F. ns: p = 0.14.
Site of action of nAChR blockade
The circuit that leads to gamma oscillations in OT L5 has been demonstrated previously (Goddard et al., 2012, 2014). Briefly, gamma oscillations are generated in the intermediate and deep layers of the OT (OTd; L10–L15) in response to retinal afferent microstimulation. A subset of physiologically distinct neurons in L10b of the OT (Goddard et al., 2014) transmits this gamma activity topographically to a cholinergic nucleus in the midbrain tegmentum, called the nucleus Ipc. Ipc neurons respond to L10b input with spike bursts at gamma periodicities that are transmitted back to neurons in all OT layers, at the same location in the OT space map from which gamma signals arose. The LFP recorded in L5 (Figs. 1C,D, 2A,B) is generated almost entirely by the activity of Ipc axons, which terminate heavily in L5. It is the spike discharges of these large diameter Ipc axons that are recorded as unit activity in L5 (Marín et al., 2005).
Where in this circuit does nAChR blockade exert its effect? The severe disruption of Ipc axon spiking (Fig. 1D,F) indicates that the primary site of action is either at, or upstream of, the Ipc. Therefore, we tested whether ACh drives direct currents in Ipc neurons that could influence their spiking activity. We performed whole-cell patch-clamp recordings from Ipc neurons, while puffing ACh (10 mm) perisomatically from a puffer electrode (Fig. 3A). ACh puffs evoked no measurable currents in Ipc neurons (Fig. 3B; median charge transfer, excitatory currents: 2.1 μC, iqr −1.2 to +13.7 μC, n = 8; p = 0.15, Wilcoxon matched pairs signed rank test; inhibitory currents: 0.1 μC, iqr −2.6 to + 0.7 μC, n = 8; p = 0.95, Wilcoxon matched pairs signed rank test). Because the dendrites of Ipc neurons are compact and confined in the nucleus (Wang et al., 2006), the absence of ACh-induced currents indicated an absence of AChRs on Ipc neurons. Previous anatomical studies have also found no evidence for Ipc axon collaterals within the nucleus (Wang et al., 2006). These results imply that AChR blockade does not directly affect Ipc neurons.
Figure 3.

ACh puff in the Ipc does not drive synaptic currents in Ipc neurons. A, Schematic of experimental setup: ACh puffer (P) in Ipc and intracellular recording electrode (white) in Ipc. B, Example intracellular recordings of IPSCs (top) and EPSCs (bottom) from a single Ipc neuron during an ACh puff in the Ipc. Black dot, Timing of ACh puff.
AChR blockade must, therefore, act on the gamma-generating circuitry in the OT that provides input to the Ipc. A previous study indicated L10–L15 in the OT as the source of gamma activity (Goddard et al., 2012). However, to investigate the possibility that nAChR currents directly influence the gamma-generating circuit, we first needed to localize the circuit with greater precision. We accomplished this by measuring the distribution of evoked gamma activity across the different OT layers in slices in which the connections between the OT and the Ipc had been surgically transected. Ipc-OT transection eliminates the amplification and distribution of gamma activity across the OT layers by Ipc axons (Goddard et al., 2012), and thereby aids in the localization of the source of the gamma activity within the OT.
In Ipc-OT disconnected slices, evoked gamma power was strongest in layers 10a and 10b (Fig. 4B,C). For L10a, median gamma power was 25.7 dB (iqr 21.4–27.7 dB; n = 16), and for L10b, median power was 25.5 dB (iqr 23.5–29.2 dB; n = 13). Moving the recording electrode by a few hundred micrometers either above L10a to L5, or below L10b to L13, resulted in a precipitous drop in gamma power. Median power fell to 12.0 dB in L5 (iqr 9.5–15.4 dB; n = 10) and to 16.3 dB in L13 (iqr 11.3–17.8; n = 12; p < 0.0001, Kruskal–Wallis test). The results indicated that the circuitry that generates gamma activity is concentrated in L10 (Fig. 4D).
Figure 4.
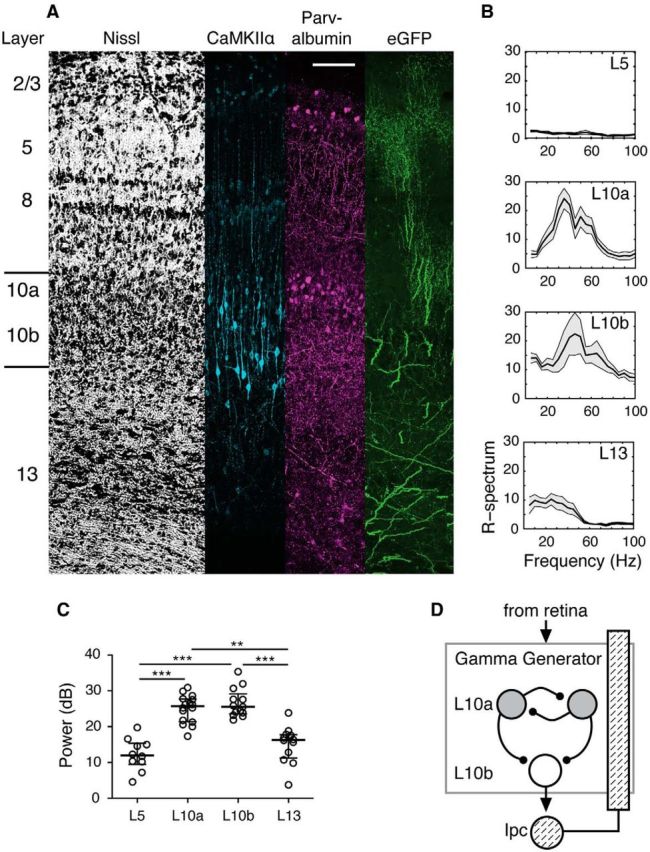
Gamma-generating circuitry concentrated in layer 10 of the OT. A, Transverse sections of the OT stained for Nissl, CaMKIIα, and parvalbumin, and Ipc axons labeled with eGFP. Left, Layer numbering system for the OT. Bars indicate the extent of L10. Scale bar, 100 μm. Layer 10a contains a high concentration of parvalbumin-positive inhibitory interneurons. B, Average R-spectra for evoked extracellular activity measured in different OT layers in an Ipc-OT disconnected slice, in response to a single electrical pulse delivered to the retinal afferents. Data from a single experiment. C, Average RMS gamma power (20–60 Hz) in the LFP evoked by electrical stimulation of retinal afferents in Ipc-OT disconnected slices, as a function of OT layer. Each symbol for a given layer represents a different slice. D, Proposed model of the midbrain network gamma-generating circuit located in OT L10. Critical circuit elements include NMDAergic inputs into the generator from sensory (e.g., retina; at top) and descending forebrain afferents, GABAergic interneurons (L10a; gray circles), excitatory “shepherd's crook” projection neurons (L10b; white circle), and cholinergic feedback from the Ipc (hashed circle and bar).
Focal ACh puff in L10 enhances gamma power in Ipc-OT disconnected slices
The hypotheses that (1) ACh directly affects the gamma-generating circuit and (2) the circuit is located in L10, together predict that puffs of ACh delivered directly to L10 should increase gamma power. To test this prediction, we focally puffed ACh in L10a while measuring microstimulation-evoked LFP gamma power in L10b, in Ipc-OT disconnected slices (Fig. 5A). We applied microstimulation either alone (Fig. 5B, top) or, on interleaved trials, paired with an ACh puff (Fig. 5B, bottom). Pairing a focal ACh puff in L10a with L1 microstimulation increased the amplitude of L10b gamma oscillations on individual trials (Fig. 5B) and across a population of sites (Fig. 5C, stim alone: 23.1 dB, iqr 17.5–28.1 dB; L10a puff + stim: 26.1 dB, iqr 17.7–29.2 dB; n = 25; p < 0.01, Wilcoxon matched pairs signed rank test). In contrast, ACh puffs in L10a were not sufficient to drive gamma oscillations in L10b in the absence of retinal afferent stimulation (Fig. 5D, stim alone: 27.9 dB, iqr 23.1–31.1 dB; L10a puff alone: 3.0 dB, iqr 0.9–4.0 dB; n = 10; p < 0.002, Wilcoxon matched pairs signed rank test). Thus, although an ACh puff increased gamma power, it was not able to generate gamma power when delivered alone. In addition, when ACh was puffed a few hundred micrometers above L10a, in L5, we saw no effect of the puff on L10b gamma power (Fig. 5E, stim alone: 24.9 dB, iqr 22.0–27.8 dB); stim + L5 puff: 24.4 dB, iqr 19.5–27.0 dB; n = 19; p = 0.14, Wilcoxon matched-pairs signed rank test). These results also demonstrate the spatial precision of the ACh puffs (<300 μm). The spatial precision of the puffs, combined with their extrasynaptic delivery of ACh, probably contributed to the smaller effect on evoked gamma power of ACh puffs (Fig. 5E) versus nAChR blockade (Fig. 1C), which blocked receptors throughout the entire release zones of all cholinergic fibers.
Figure 5.

ACh puff in L10 increases evoked gamma power in Ipc-OT disconnected slices. A, Schematic of the experimental setup: ACh puffer (P) in L10a, stimulating electrode in L1, extracellular recording electrode in L10b, and Ipc-OT connections transected (scissors). B, Top, Example LFP oscillations evoked in L10b by electrical pulse (arrow) without an ACh puff. Bottom, LFP oscillations evoked in L10b by electrical pulse with an ACh puff in L10a (dot; 10 mm). LFP signal bandpass filtered at 20–60 Hz. Bar, Analysis window for RMS power. C, Summary of the effect of an ACh puff in L10a on evoked RMS power in the gamma band (n = 25 slices). Inset, Histogram of difference in power for each slice, between oscillations evoked by L10a ACh puff + stim and stim alone. **p < 0.01. D, Summary of the effect of an ACh puff in L10a alone (without electrical stimulation) on RMS power in the gamma band, compared with the effect of electrical stimulation alone (n = 10 slices; p < 0.002). E, Effect of an ACh puff delivered in L5 on evoked RMS power in the gamma band recorded in L10b. Left, Schematic of the recording setup: ACh puffer (P) in L5; stimulating electrode (lightning bolt) in L1; extracellular recording electrode (black) in L10b; and scissors, Ipc-OT transection. Middle, Summary of the effect (n = 19 slices). Right, Histogram of difference in power for each slice, between oscillations evoked by L5 ACh puff + stim and stim alone. ns: p = 0.14.
These results indicate that ACh released in L10 can switch the gamma-generating circuit into a primed state that produces high-amplitude oscillations when it is synchronously activated by glutamatergic (Dye and Karten, 1996) afferent input. Furthermore, the results show that the gamma rhythmicity of neurotransmission by Ipc axon firing (not simulated by the puff) is not required to switch the generator into this primed state. Under natural conditions, ACh released rhythmically from synapses might result in even larger increases in gamma power.
nAChRs mediate evoked IPSCs in L10b
The generation of gamma power in the OT and in other brain regions requires inhibitory interactions, which determine the frequency of the LFP oscillations (Bartos et al., 2007; Cardin et al., 2009; Sohal et al., 2009; Whittington et al., 2011; Goddard et al., 2012). Excitatory L10b neurons (Fig. 4A, CaMKIIα) receive strong periodic inhibition that is synchronized with gamma oscillations and, presumably, controls their periodic activity (Goddard et al., 2012). Moreover, neighboring L10a contains an enriched population of GAD- and parvalbumin-positive, GABAergic interneurons (Hunt and Künzle, 1976; Tyler et al., 1995; Goddard et al., 2012; Fig. 4A, parvalbumin). These data suggest the hypothesis that periodic inhibitory drive from L10a interneurons, perhaps in concert with excitatory drive from L10b neurons, is linked directly to the generation of gamma activity in the OT (Fig. 4D). One prediction of this hypothesis is that nAChR blockade, which decreased the power of gamma oscillations (Fig. 1E), should also decrease the strength of inhibitory currents in L10b during gamma oscillations.
To test this prediction, we performed whole-cell patch-clamp recordings from L10b neurons to measure IPSCs by holding the neurons at a membrane potential that minimized excitatory currents, while simultaneously monitoring gamma oscillations in L5 of Ipc-OT connected slices (Fig. 6A). In the example shown in Figure 6, B and C, microstimulation evoked powerful barrages of IPSCs in the L10b neuron (Fig. 6B, top) coincident with gamma oscillations in L5 (Fig. 6B, bottom). Blocking nAChRs dramatically reduced the total inhibitory charge transfer in this L10b neuron (Fig. 6C). Across all experiments performed in Ipc-OT connected slices, nAChR blockade reduced inhibitory drive in L10b neurons during gamma oscillations by ∼50% (Fig. 6D): before nAChR blockade, median charge transfer was 6.1 μC (iqr 3.7–15.5 μC); after nAChR blockade, median charge transfer was 3.2 μC (iqr 2.1–8.8 μC; n = 9; p < 0.008, Wilcoxon matched pairs signed rank test). This effect was due to ACh released from Ipc axons, and not due to ACh released from cholinergic neurons resident in the OT (Weigel and Luskch, 2014): in Ipc-OT disconnected slices, nAChR blockade had no effect on microstimulation-evoked IPSCs in L10b neurons (Fig. 6E; median charge transfer before nAChR blockade: 12.8 μC, iqr 6.6–34.0 μC; after nAChR blockade: 14.4 μC, iqr 2.4–25.7 μC; n = 10; p = 1, Wilcoxon signed rank test). These results demonstrate that ACh released from Ipc axons increased the strength of inhibitory currents in L10b during gamma oscillations.
Figure 6.

Blockade of nAChRs reduces inhibitory currents in L10 during gamma oscillations in Ipc-OT connected slices. A, Schematic of the experimental setup: stimulating electrode in L1, extracellular recording electrode in L5, and intracellular recording electrode in L10b. B, Example of simultaneous recordings of evoked responses recorded intracellularly in L10b (top, IPSCs isolated by clamping neuron at the excitatory reversal potential) and extracellularly in L5 (bottom, LFP bandpass filtered at 20–60 Hz). Arrow, Timing of electrical pulse. C, Example of simultaneous recordings as in B, recorded in the presence of MEC. Conventions as in B. D, Summary of the effect of nAChR blockade on median charge transfer by L10b IPSCs during evoked gamma oscillations in Ipc-OT connected slices (n = 9). p < 0.008. E, Same as in D, but with Ipc-OT axons transected (n = 10; p = 1).
Focal ACh puffs in L10 drive IPSCs
The previous results suggest that nAChRs directly drive inhibitory currents in the gamma-generating circuit. To test this suggestion, we performed whole-cell patch-clamp recordings from L10a and L10b neurons, and measured inhibitory currents that resulted from an ACh puff in L10. Focal ACh puffs drove robust barrages of IPSCs in both L10a neurons (Fig. 7A, middle) and L10b neurons (Fig. 7A, bottom). ACh-driven IPSCs were consistent across multiple puff iterations. In L10a, ACh puffs drove IPSCs in 81% (38/47) of recorded neurons (Fig. 7B, middle; median charge transfer: 14.0 μC, iqr 6.0–25.0 μC, n = 38; p < 0.0001, Wilcoxon signed rank test). In L10b, ACh puffs drove IPSCs in 76% (29/38) of recorded neurons (Fig. 7B, right; median charge transfer: 10.9 μC, iqr 5.4–19.6 μC, n = 22; recordings from seven neurons were not of sufficient quality to allow repeated measurements; p < 0.0001, Wilcoxon signed rank test).
Figure 7.
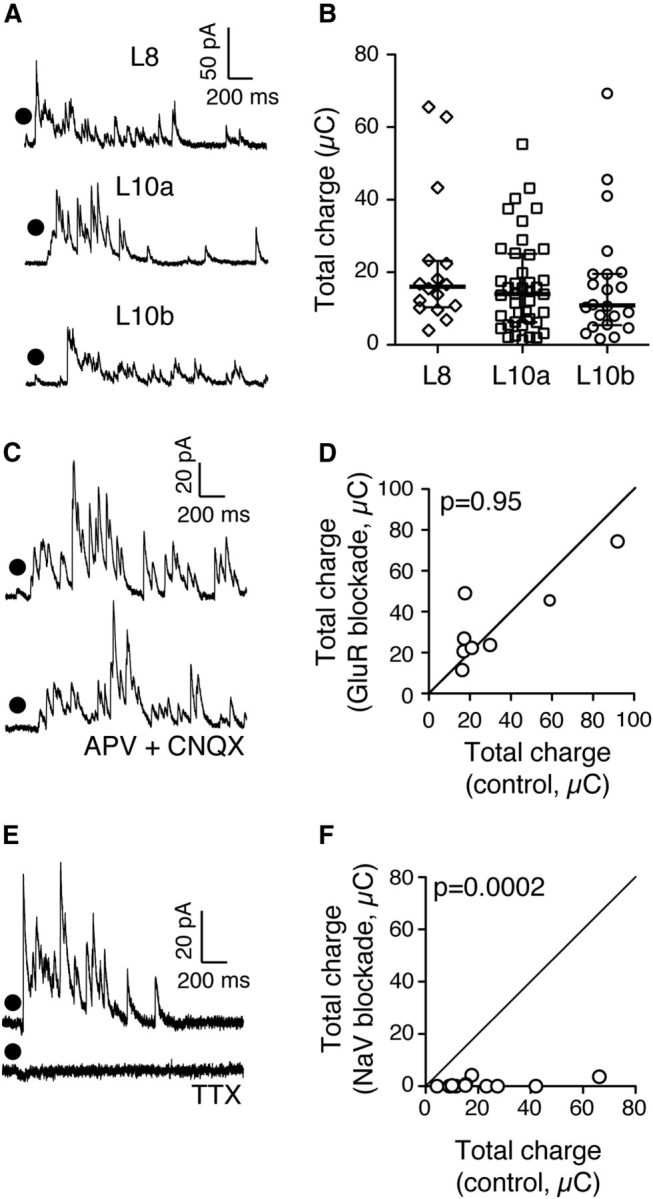
Focal ACh puff in L10 drives synaptic inhibition in L8, L10a, and L10b. A, Examples of intracellular recordings of IPSCs in L8 (top), L10a (middle), and L10b (bottom) following ACh puff in L10a (dot). B, Summary of median charge transfers by ACh-driven IPSCs in L8, L10a, and L10b neurons. Horizontal lines, population median; whiskers, interquartile range. C, Example of an intracellular recording of L10a ACh-driven IPSCs in control condition (top) and following blockade of ionotropic GluRs with APV and CNQX (bottom). D, Summary of the effect of GluR blockade on median ACh-driven IPSC charge transfer in L10 neurons (n = 8; p = 0.95). E, Example of an intracellular recording of L10a ACh-driven IPSCs in control condition (top) and following blockade of voltage-gated sodium channels (NaV) with TTX (bottom). F, Summary of the effect of NaV blockade on median ACh-driven IPSC charge transfer in L10 neurons (n = 13; p = 0.0002).
We next explored the mechanism by which ACh puffs in L10 drive IPSCs in L10. Because the median total charge transfer of ACh-driven IPSCs in L10a and L10b were statistically indistinguishable (p = 0.77, Mann–Whitney test), data from L10a and L10b recordings were pooled. First, we tested whether ACh-driven inhibition results from cholinergic activation of glutamatergic neurons that, in turn, drive inhibitory interneurons. IPSCs driven by the activation of excitatory neurons would be sensitive to ionotropic glutamate receptor (GluR) blockade. We applied GluR blockers, while measuring ACh-driven IPSCs in L10 neurons. GluR blockade (CNQX, 10 μm and APV, 50 μm) did not affect ACh-driven IPSCs in L10 (Fig. 7C,D). Before GluR blockade, median total charge transfer was 23.1 μC (iqr 17.0–51.0 μC); after GluR blockade, median transfer was 32.1 μC (iqr 19.6–56.8 μC; n = 8; p = 0.95, Wilcoxon matched pairs signed rank test). These results indicate that ACh release does not activate inhibitory neurons by driving an intermediate population of excitatory neurons.
Next, we tested whether ACh-driven inhibition results from presynaptic ACh activation of inhibitory terminals. Presynaptic nAChRs can bypass voltage-gated sodium (NaV) channels to drive neurotransmitter release (McMahon et al., 1994; Girod et al., 2000; Endo et al., 2005; Garduño et al., 2012). Thus, IPSCs driven by activation of presynaptic nAChRs would be insensitive to NaV channel blockade. We applied the NaV channel antagonist TTX (500 nm), while recording ACh-driven IPSCs in L10 neurons. NaV blockade eliminated ACh-driven IPSCs (Fig. 7E,F; control: 15.3 μC, 9.7–26.2 μC; NaV blockade: 0.3 μC, 0.1–0.6 μC; n = 13; p = 0.0002, Wilcoxon matched pairs signed rank test). Together, these results strongly suggest that ACh drives inhibitory interneurons in L10 directly.
In addition, we tested whether ACh puffs in L10 also drive synaptic inhibition in an OT layer that is not a component of the gamma-generating circuit. We performed whole-cell patch-clamp recordings from L8 neurons, which project to the dorsal lateral geniculate nucleus in the visual thalamus (Wild, 1989), and measured IPSCs driven by ACh puffs in L10. Focal ACh puffs drove IPSCs in 89% (16/18) of recorded L8 neurons (Fig. 7A top, B left; median charge transfer: 16.0 μC, iqr 10.4–23.1 μC, n = 16; p = 0.0005, Wilcoxon signed rank test). These results demonstrate that ACh-driven inhibition from L10 impinges on at least three different neuronal populations: L10a inhibitory interneurons, L10b excitatory neurons, and L8 projection neurons.
Focal ACh puff activates two populations of L10 neurons
To reveal neurons in L10 that are directly driven by ACh, we combined calcium imaging with targeted whole-cell patch-clamp recordings. We injected the calcium-sensitive fluorescent dye, OGB-1, into L10 and measured the stimulus-locked, baseline-subtracted OGB-1 signal in response to focal ACh puffs (see Materials and Methods). With ionotropic GluRs blocked (to isolate direct cholinergic currents), focal ACh puffs in L10 resulted in intense OGB-1 signals that colocalized with a subset of L10 somata (Fig. 8A). Sequential ACh puffs elicited consistent spatial patterns of OGB-1 signal, although the intensity of the signal varied at some loci (Fig. 8A). When the muscarinic AChR blocker atropine was added to the bath, neither the pattern nor intensity of the OGB-1 signal was substantially altered (Fig. 8B; n = 4). In contrast, when the nAChR blocker DHβE was subsequently applied at pan-nicotinic blocking concentrations (40 μm), the OGB-1 signal was eliminated (Fig. 8C; n = 4). Washout of DHβE restored the OGB-1 signal. These results confirm that ACh directly drives a subset of L10 neurons by activating nAChRs.
Figure 8.

Calcium imaging reveals nAChR-dependent somatic activation of L10 neurons. A, Sequential example images of the summated, stimulus-locked baseline-subtracted OGB-1 signal, following focal Ach puff, in the presence of ionotropic GluR blockers. Circled P, placement of ACh puffer; dashed line, upper edge of L10a. B, OGB-1 signal, image collected and processed as in A, but in the presence of GluR + mAChR blockers. C, Same as in B, but in the presence GluR + nAChR blockers (left), and after washout with GluR blockers alone (right).
Next, we studied the properties of the excitatory currents that were driven by nicotinic AChRs in these fluorescence-emitting L10 neurons. Using on-line analysis, we overlaid OGB-1 signals with bright-field images to identify the cell bodies of neurons that responded to ACh puffs. We then performed whole-cell patch-clamp recordings to measure the excitatory currents evoked by ACh puffs in these calcium imaging pre-identified neurons. In 14/22 pre-identified L10 neurons, we observed a rapidly decaying current in response to an ACh puff (Fig. 9A–C). In the remaining 8/22 pre-identified L10 neurons, we observed a slowly decaying current in response to the ACh puff (Fig. 9D–F).
Figure 9.
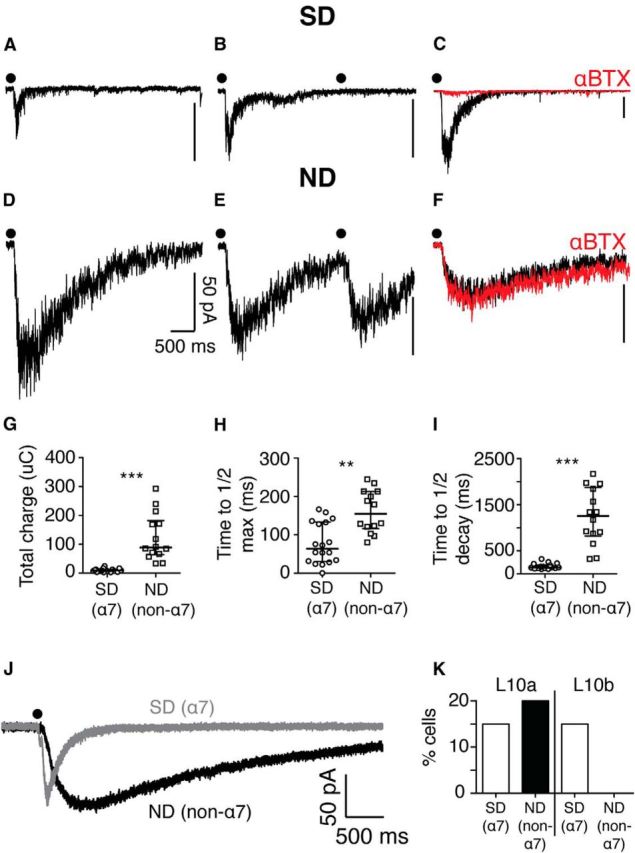
Layer 10 contains two types of ACh-sensitive neurons. A, Example of an intracellular recording from an L10 neuron that responds to a focal puff of ACh (dot) with a rapidly decaying excitatory current. B, Example of a rapidly decaying ACh-driven excitatory current displaying strong desensitization (SD) to sequential puffs of ACh (dots, interpuff interval: 2.5 s). C, Example of a rapidly decaying ACh-driven excitatory current eliminated by the α7-selective antagonist, αBTX. D, Example of an intracellular recording from an L10 neuron that responds to a focal puff of ACh (dot) with a slowly decaying excitatory current. E, Example of a slowly decaying ACh-driven excitatory current displaying minimal desensitization (ND) to sequential puffs of ACh (dots). F, Example of a slowly decaying ACh-driven excitatory current displaying no apparent sensitivity to αBTX. G, Summary of median total charge transfer by ACh-driven excitatory currents mediated by SD (α7) and ND (non-α7) nAChRs. Horizontal lines, population median; whiskers, interquartile range. ***p < 0.0001; α7, n = 18 cells; non-α7, n = 14 cells. H, Summary of median time to reach half-maximal current in ACh-driven responses mediated by SD (α7) and ND (non-α7) nAChRs. Conventions as in G. ** p = 0.0013; α7, n = 18 cells; non-α7, n = 14 cells. I, Summary of median time to decay to half-maximal current in ACh-driven responses by SD (α7) and ND (non-α7) nAChRs. Conventions as in G. ***p < 0.0001; α7, n = 18 cells; non-α7, n = 14 cells. J, Example traces of SD (α7 nAChR; gray) and ND (non-α7 nAChR; black) currents in response to equivalent ACh puffs (dot). K, Proportion of neurons in L10a (left) and L10b (right) that display SD (α7) and ND (non-α7) nAChR currents in a random survey of L10a and L10b neurons.
Nicotinic receptors are generally divided into two classes (Gotti et al., 2006): receptors that contain α7-subunits and receptors that do not. Cholinergic signaling transmitted by these two classes of nAChRs can differentially influence target neurons (Alkondon and Albuquerque, 2001; Arroyo et al., 2012; Bennett et al., 2012). These receptors exhibit dramatically different desensitization properties: α7 nAChRs strongly desensitize in the presence of ACh, whereas non-α7 nAChRs do not (Papke and Thinschmidt, 1998).
We tested whether the rapidly and slowly decaying cholinergic currents we observed in L10 neurons exhibited distinct receptor desensitization kinetics by delivering pairs of ACh puffs spaced 2.5 s apart. For rapidly decaying currents (Fig. 9A), responses to the second puff were severely attenuated (Fig. 9B; puff 1 median charge transfer: 12.7 μC, iqr 8.0–14.4 μC; puff 2 median charge transfer: 2.4 μC, iqr 1.0–3.1 μC, n = 10; p = 0.002, Wilcoxon matched pairs signed rank test). We confirmed the identity of this nAChR subtype by adding the specific α7 nAChR blocker, αBTX (50 nm), to the bath. α7 nAChR blockade eliminated rapidly decaying, strongly desensitizing (SD) cholinergic currents (n = 2; Fig. 9C).
In contrast, slowly decaying cholinergic currents (Fig. 9D) did not demonstrate significant receptor desensitization when challenged with sequential ACh puffs (Fig. 9E; puff 1 median charge transfer: 51.4 μC, iqr 16.6–104.8 μC; puff 2 median charge transfer: 46.1 μC, iqr 16.8–112.7 μC, n = 10; p = 0.85, Wilcoxon matched pairs signed rank test). This lack of desensitization strongly suggested that slowly decaying currents were due to activation of non-α7 nAChRs. In support of this suggestion, slowly decaying, nondesensitizing (ND) currents were not affected by α7 nAChR blockade (n = 3; Fig. 9F).
We compared several properties of the strongly desensitizing and ND currents: total charge transfer, time to half-max, and time to half-decay. Strongly desensitizing (SD) currents transferred less total charge than ND currents (Fig. 9G; SD median charge transfer: 9.5 μC, iqr 6.7–12.6 μC, n = 18; ND median charge transfer: 88.4 μC, iqr 64.2–182.2 μC, n = 14; p < 0.0001, Mann–Whitney test); they reached their half-maximum current faster (Fig. 9H; SD median rise time: 63.7 ms, iqr 30.7–133.5 ms, n = 18; ND median rise time: 154.8 ms, iqr 116.5–213.2 ms, n = 14; p = 0.0013, Mann–Whitney test); and they decayed to their half-maximum current sooner (Fig. 9I; SD median decay time: 139.0 ms, iqr 124.2–192.9 ms, n = 18; ND median decay time: 1258.0 ms, iqr 818.8–1874.0 ms, n = 14; p < 0.0001, Mann–Whitney test).
Our recordings were performed at room temperature. At warmer, physiological temperatures, the amplitude of non-α7 nAChR currents become larger, whereas the amplitude α7 nAChR currents become smaller, and both receptor types show slightly faster desensitization rates (Jindrichova et al., 2012). Therefore, under physiological conditions, the relative difference between the magnitudes of non-α7 and α7 nAChR-mediated currents (Fig. 9G) would, if anything, increase.
Together, these data indicate that L10 contains two distinct populations of neurons that are directly driven by ACh: one population that is excited via nondesensitizing, non-α7 subunit-containing nAChRs, and another population that is excited via strongly desensitizing, α7 subunit-containing nAChRs. We found no electrophysiological evidence for neurons with mixed α7 and non-α7 nAChR-mediated currents. Thus, the presence of α7 versus non-α7 nAChRs distinguished between two populations of L10 neurons.
We tested whether these two populations of nAChR-expressing neurons had different distributions within L10. In slices not loaded with calcium indicators, we performed a random survey of L10a and L10b neurons. Both in L10a and in L10b, 15% (3/20) of sampled neurons displayed strongly desensitizing (α7 nAChR) currents (Fig. 9J,K, white bars). In L10a, another 20% (4/20) of neurons displayed nondesensitizing (non-α7 nAChR) currents (Fig. 9J,K, black bar). In contrast, no neurons in L10b (0/20) displayed nondesensitizing (non-α7 nAChR) currents (Fig. 9K). Thus, non-α7 nAChR activation of L10 is mediated by a subpopulation of neurons located specifically in L10a, the layer that contains inhibitory interneurons (Hunt and Künzle, 1976; Tyler et al., 1995; Fig. 4A, parvalbumin).
Non-α7 nAChRs control gamma power
We tested the contributions of α7 and non-α7 nAChR currents to the control of gamma power. In one set of experiments, we measured the effect of selectively blocking α7 nAChRs on LFP gamma power and Ipc spike rates measured in L5 in Ipc-OT connected slices. The results from one such experiment are shown in Figure 10A–C. Selective blockade of α7 nAChRs with αBTX altered neither Ipc spike rate (Fig. 10B, top) nor evoked gamma power (Fig. 10B, bottom). This lack of effect of α7 nAChR blockade was observed consistently across all experiments. There was no effect on gamma power (Fig. 10C): median power before α7 nAChR blockade was 37.2 dB (iqr 34.3–44.8 dB); median power after α7 nAChR blockade was 38.1 dB (iqr 34.3–44.7 dB; n = 15; p = 0.76, Wilcoxon matched pairs signed rank test). Similarly, there was no effect on spike rate (Fig. 10D): median spike rate before α7 nAChR blockade was 90 spikes/s (iqr 65–102 spikes/s); median spike rate after α7 nAChR blockade was 71 spikes/s (iqr 64–121 spikes/s; n = 15; p = 1, Wilcoxon matched pairs signed rank test). Because there is no blocker that specifically targets all of the many different non-α7 nAChRs, the corresponding test of non-α7 nAChR blockade was not performed. However, because pan-nAChR blockade is effective in decreasing gamma power (Fig. 1), these results suggest that non-α7 nAChRs mediate the enhancing effects of ACh on gamma power.
Figure 10.
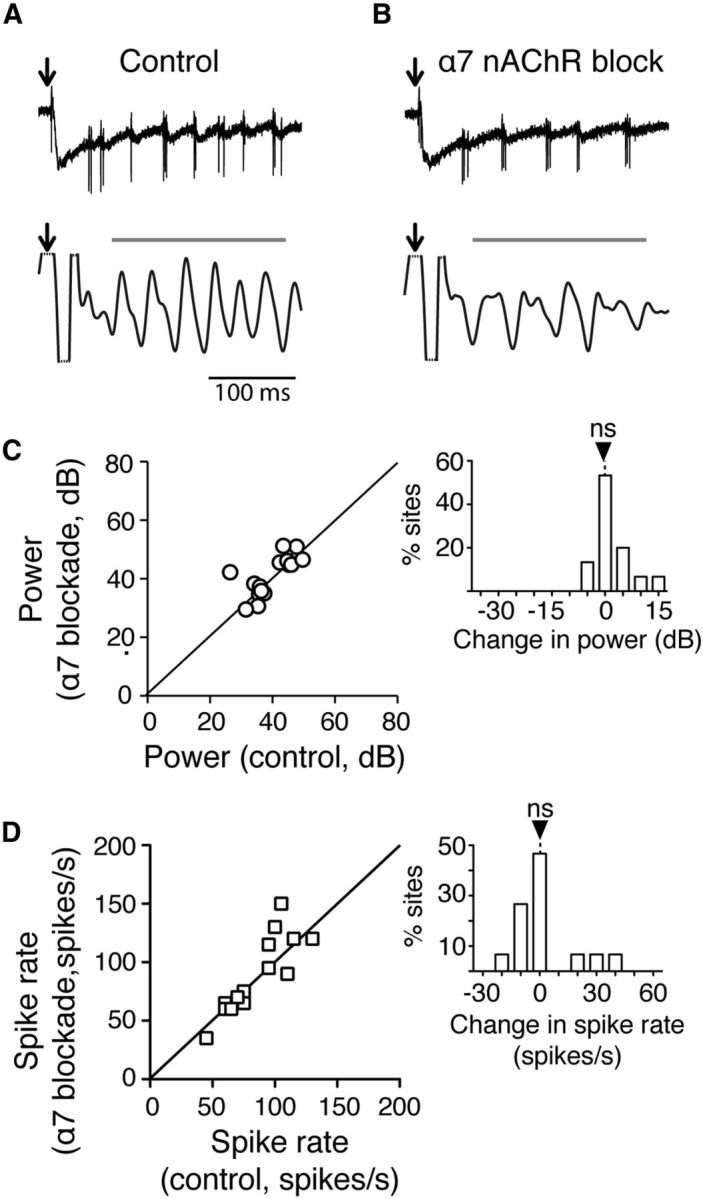
α7 nAChR blockade has no effect on gamma power or axon spike rates in L5 of the OT. A, Example of microstimulation-evoked responses recorded in L5. Conventions as in Figure 1C. B, Same as in A, but recorded in the presence of αBTX. C, Summary shows no effect of α7 nAChR blockade on evoked gamma-band power (n = 15 slices). Inset, Histogram of difference in power for each slice, between gamma power evoked with versus without α7 nAChR blockade. ns: p = 0.76. D, Summary shows no effect of α7 nAChR blockade on spike rates of Ipc axons recorded in L5 (n = 15 slices). Inset, Histogram of difference in spike rates for each slice; conventions as in C. ns: p = 1.
To test this suggestion, we studied the effect of α7 nAChR blockade on the ability of ACh puffs to enhance evoked gamma power in L10, as described previously (Fig. 5C). This set of experiments tested whether the effects of ACh on gamma power are mediated by non-α7 nAChRs. As in the previous set of experiments, we measured microstimulation-evoked gamma power in L10b of Ipc-OT disconnected slices (Fig. 11A). On interleaved trials, an ACh puff in L10a was paired with the microstimulation. However, in this set of experiments, the slices were pretreated with αBTX to block α7 nAChRs.
Figure 11.

Activation of non-α7 nAChRs in L10 increases evoked gamma power in Ipc-OT disconnected slices. A, Schematic of experimental setup in an Ipc-OT disconnected slice. Conventions as in Figure 5A. B, Example of evoked gamma oscillations in L10b in an Ipc-OT disconnected slice during α7 nAChR blockade. Conventions as in Figure 5B. C, Summary shows α7 nAChR blockade did not prevent the enhancement of gamma-band power by ACh puff in L10a (n = 23). Conventions as in Figure 5C. Inset, Histogram of difference in power for each slice, between oscillations evoked by L10a ACh puff + stim and stim alone. ***p = 0.0004.
ACh puffs in L10a increased the power of evoked gamma oscillations in L10b, even after blockade of α7 nAChRs (Fig. 11B,C, stim alone median power: 21.7 dB, iqr 17.0–26.4 dB; L10a puff + stim median power: 23.6 dB, iqr 19.3–29.8 dB; n = 23; p = 0.0004, Wilcoxon matched pairs signed rank test). This increase in gamma power was comparable to the increase obtained during experiments in which α7 nAChRs were not blocked (compare Figs. 11C, 5C; median change in gamma power without α7 blockade: 1.4 dB, iqr −1.0 to +3.2 dB; median change with α7 blockade: 2.5 dB, iqr −0.6 to +4.8 dB; p = 0.07, two-way repeated-measures ANOVA). These data, together with the experiments showing the lack of influence of α7 nAChRs on gamma power (Fig. 10), demonstrate that non-α7 nAChR currents in L10a are both necessary and sufficient for cholinergic modulation of gamma power in the midbrain attention network.
Discussion
Modulations of gamma power, cholinergic signaling, and attention have been linked in a number of neural and behavioral studies (Cape et al., 2000; Rodriguez et al., 2004; Herrero et al., 2008). Furthermore, disruptions of these processes co-occur in many psychiatric diseases (Herrmann and Demiralp, 2005; Gotti et al., 2006; Uhlhaas and Singer, 2006; Lenz et al., 2008). Why does this happen? Our results reveal a neural mechanism that links these phenomena: in the midbrain network, which prioritizes locations for shifts of gaze and attention, a cholinergic mechanism directly couples the computation of the highest priority location (Knudsen, 2011) to an increase in gamma power. We propose that this mechanism may be implemented in other brain networks, especially in those that require rapid modulations of gamma power to carry out their functions.
A cholinergic mechanism for modulating gamma power
Our experiments demonstrate a mechanism that links ACh release directly to an increased capacity for generating gamma power. The observations that ACh puffs in L10 drive powerful synaptic inhibition independently of glutamatergic excitation (Fig. 7A–D) but dependently on voltage-gated sodium channels (Fig. 7E,F), strongly imply that ACh drives inhibitory neurons in L10. L10a is densely populated by inhibitory interneurons (Fig. 4A) and we identified a special class of sparse neurons in L10a that express non-α7 nAChRs. Activation of these neurons by a puff of ACh alone has no effect on LFP gamma power. However, when the gamma-generating circuit is simultaneously activated by retinal afferent drive (Dye and Karten, 1996; Goddard et al., 2012; via NMDA receptor-mediated glutamatergic input), ACh activation of these neurons substantially increases gamma power. These data strongly suggest that the special class of sparse neurons in L10a represents inhibitory neurons that are directly activated by ACh to regulate gamma power. However, we were not able to verify the histochemical identity of the ACh-responsive L10a neurons. Therefore, it remains possible that these sparse neurons are not themselves inhibitory, but rather are nonglutamatergic excitatory neurons. The far more likely interpretation of the data, however, is that these sparse L10a neurons are, indeed, inhibitory and that activation of their non-α7 nAChRs causes them to transform cholinergic drive into synchronous, rhythmic inhibitory activity (Goddard et al., 2012), yielding stronger gamma power.
The L10a neurons that express non-α7 nAChRs represent a functionally specialized class. Cholinergic modulation of gamma power results exclusively from the activation of neurons that express non-α7 nAChRs, as no further effect is seen when AChRs are nonspecifically activated. Thus, non-α7 nAChR-expressing neurons in L10a are an essential link between ACh release and modulations in gamma power in this network.
The properties of non-α7 nAChRs are well suited for this function. The capacity for moment-to-moment changes in the selection of locations as the next target for gaze or attention means that modulations in gamma power must occur frequently in the midbrain network. The onset kinetics of nicotinic AChRs are rapid (Gotti et al., 2006), and can thus enable the gamma-generating circuit to switch into a high-power state quickly following activation of the Ipc. Importantly, non-α7 nAChRs do not desensitize, enabling these neurons to respond continuously to persistent Ipc input and thereby maintain high-power gamma oscillations for sustained periods.
Function of the non-α7 nAChR mechanism in vivo
The non-α7 nAChR mechanism switches the gamma-generating circuit in a topographically limited portion of the OT space map (Sridharan et al., 2011) into a primed state capable of producing highly synchronized activity at gamma frequencies. The Ipc, a spatiotopically organized tegmental nucleus, is a major source of ACh that controls this switch. However, although cholinergic input from the Ipc controls the switch to high gamma power, the Ipc is not required to generate gamma rhythmicity. Retinal afferent stimulation evokes gamma power in L10, even when the Ipc is disconnected from the network (Fig. 4B,C). Correspondingly in vivo, when the stimulus inside the Ipc neuron's receptive field is weaker than a stimulus at another location, Ipc neurons are only weakly activated (Asadollahi et al., 2010), due to powerful inhibitory drive from another tegmental nucleus called the nucleus isthmi pars magnocellularis (Imc; Asadollahi et al., 2011). The Imc circuit, which also includes reciprocal interconnections with the OT, underlies the computation of the highest priority location (Mysore and Knudsen, 2012). Thus, whenever Imc-mediated inhibition suppresses Ipc firing, and thereby suppresses cholinergic activation of the non-α7 nAChR mechanism, the power of gamma oscillations in the OT space map will be low, with oscillations restricted largely to L10 (Fig. 4B,C), and the transmission and gamma-synchronization of neural activity in downstream brain regions substantially diminished (Marín et al., 2012). In contrast, when a stimulus is the strongest of all stimuli, Imc-mediated inhibition of the Ipc and the OT is low (Mysore and Knudsen, 2013), allowing Ipc neurons to discharge vigorous bursts of spikes (Asadollahi et al., 2011), which will activate the non-α7 nAChR mechanism in L10a, and distribute gamma activity across the OT layers. This direct linkage between Ipc activation and the enhanced capacity to generate gamma power enables the network to shift the locus of high gamma power rapidly from one location in the OT space map to another, immediately upon computation of the highest priority location.
Ipc neurons also receive descending input from the forebrain gaze fields (Knudsen, 2011). This input provides working memory information about important locations (Knudsen and Knudsen, 1996), biasing the selection of the highest priority location by the midbrain network (Mysore and Knudsen, 2014). The descending input from the forebrain could, by activating Ipc neurons at a particular location in the Ipc space map, switch the OT gamma-generating circuit into its primed state. In this manner, the forebrain could create a space-specific state of “expectation” in the midbrain network (Sridharan et al., 2014).
Modulation of circuit elements by nicotinic mechanisms
The non-α7 nAChR mechanism reported here adds to the list of cholinergic mechanisms that enhance the information-processing capabilities of networks. Other mechanisms by which nAChR currents enhance information processing have been discovered in the OT and neocortex. One mechanism is the regulation of input sensitivity by presynaptic facilitation of the release of glutamate from afferent terminals (Binns and Salt, 2000; Dudkin and Gruberg, 2003; Dani and Bertrand, 2007; Disney et al., 2007). This mechanism regulates input gain.
A second mechanism is the regulation of the gain of output neurons. In sensory neocortex, ACh release activates a special class of inhibitory interneurons that, in turn, inhibits another class of inhibitory neurons that impinge on L2/3 pyramidal (output) neurons (Brombas et al., 2014). This “inhibition of inhibition” mechanism regulates output gain.
A third mechanism is the one reported in this study: the modulation of gamma-generating circuitry. In this case, ACh drives synaptic inhibition by activating a sparse population of interneurons via a special class of nAChRs. Activation of non-α7 nAChR-expressing neurons within the gamma-generating circuit enables the network to produce highly synchronized signals. We propose that the sparse, non-α7 nAChR-expressing neurons act as hubs (Bonifazi et al., 2009) of rhythmic synaptic inhibition that not only enhance L10a inhibitory interactions required for gamma rhythmicity, but also directly or indirectly entrain excitatory output neurons of the gamma generator in L10b and excitatory neurons in L8 and L13 that convey ascending information to the thalamus. Thus, ACh-mediated inhibition may contribute to the synchronization of L13 activity to gamma rhythms (Sridharan et al., 2011), which in turn may allow that activity to be differentially effective in activating the thalamus and higher forebrain structures (Marín et al., 2012). In the primate forebrain, similar computational effects may be achieved by activation of sparse, muscarinic AChR-expressing interneurons (Rodriguez et al., 2004; Disney et al., 2006; Disney and Aoki, 2008).
Our results suggest a potential fourth cholinergic mechanism: selective amplification of sensory responses to novel stimuli, a conspicuous property of OT neurons (Cynader and Berman, 1972; Reches and Gutfreund, 2008). We observed a separate population of neurons expressing rapidly desensitizing α7 nAChRs, which make these neurons insensitive to persistent or repeated ACh release. These neurons are distributed sparsely throughout L10, but their activation does not modulate gamma power (Fig. 10). Hence, they likely serve a different function. The desensitization kinetics of α7 nAChRs could serve as a filter for stimulus novelty: activation of these neurons by ACh release could result in high-gain responses of downstream neurons selectively to the first occurrence of a stimulus.
These various nicotinic mechanisms act by regulating different information processing variables (input gain, output gain, and activity synchronization). Other processing variables are regulated by muscarinic AChRs (Herrero et al., 2008). This functional specialization of cholinergic receptors permits independent adjustment of each processing variable to optimize network performance. At the same time, these adjustments do not alter the integrative properties of the output neurons themselves. The specificity of network regulation by ACh is controlled by the class of neuron that expresses the AChR, the type of AChR each class expresses, and where on the neurons the AChRs are located (presynaptic vs postsynaptic). These properties give rise to the functional specificity of cholinergic modulation.
Potential generality of AChR mechanisms
In the midbrain selection network, both glutamatergic and cholinergic projections are anatomically spatially precise. In contrast, in the neocortex, cholinergic projections from the nucleus basalis lack spatial precision. However, because the cholinergic mechanisms discussed above all depend on glutamatergic drive to be expressed as output activity, the precision of the effects of these mechanisms requires only that one transmitter system provide precise spatiotemporal patterns of activation. In the neocortex, precise activation patterns may be supplied by top-down glutamatergic pathways. Hence, it is possible that these cholinergic mechanisms operate cooperatively in both the neocortex and in the OT to enhance information processing in the respective networks.
Footnotes
This work was supported by National Institutes of Health R01 EY024243 (E.I.K.) and National Science Foundation GRFP DGE-114747 (A.S.B.). Special thanks to Sridharan Devarajan, Jason Schwarz, Phyllis Knudsen, Dai Watanabe, and Andrew Olson for assistance and useful discussions.
The authors declare no competing financial interests.
References
- Ainsworth M, Lee S, Cunningham MO, Roopun AK, Traub RD, Kopell NJ, Whittington MA. Dual gamma rhythm generators control interlaminar synchrony in auditory cortex. J Neurosci. 2011;31:17040–17051. doi: 10.1523/JNEUROSCI.2209-11.2011. [DOI] [PMC free article] [PubMed] [Google Scholar]
- Alkondon M, Albuquerque EX. Nicotinic acetylcholine receptor alpha7 and alpha4beta2 subtypes differentially control GABAergic input to CA1 neurons in rat hippocampus. J Neurophysiol. 2001;86:3043–3055. doi: 10.1152/jn.2001.86.6.3043. [DOI] [PubMed] [Google Scholar]
- Arroyo S, Bennett C, Aziz D, Brown SP, Hestrin S. Prolonged disynaptic inhibition in the cortex mediated by slow, non- 7 nicotinic excitation of a specific subset of cortical interneurons. J Neurosci. 2012;32:3859–3864. doi: 10.1523/JNEUROSCI.0115-12.2012. [DOI] [PMC free article] [PubMed] [Google Scholar]
- Asadollahi A, Mysore SP, Knudsen EI. Stimulus-driven competition in a cholinergic midbrain nucleus. Nat Neurosci. 2010;13:889–895. doi: 10.1038/nn.2573. [DOI] [PMC free article] [PubMed] [Google Scholar]
- Asadollahi A, Mysore SP, Knudsen EI. Rules of competitive stimulus selection in a cholinergic isthmic nucleus of the owl midbrain. J Neurosci. 2011;31:6088–6097. doi: 10.1523/JNEUROSCI.0023-11.2011. [DOI] [PMC free article] [PubMed] [Google Scholar]
- Bartos M, Vida I, Jonas P. Synaptic mechanisms of synchronized gamma oscillations in inhibitory interneuron networks. Nat Rev Neurosci. 2007;8:45–56. doi: 10.1038/nrn2044. [DOI] [PubMed] [Google Scholar]
- Bennett C, Arroyo S, Berns D, Hestrin S. Mechanisms generating dual-component nicotinic EPSCs in cortical interneurons. J Neurosci. 2012;32:17287–17296. doi: 10.1523/JNEUROSCI.3565-12.2012. [DOI] [PMC free article] [PubMed] [Google Scholar]
- Binns KE, Salt TE. The functional influence of nicotinic cholinergic receptors on the visual responses of neurones in the superficial superior colliculus. Vis Neurosci. 2000;17:283–289. doi: 10.1017/S0952523800172116. [DOI] [PubMed] [Google Scholar]
- Bloem B, Poorthuis RB, Mansvelder HD. Cholinergic modulation of the medial prefrontal cortex: the role of nicotinic receptors in attention and regulation of neuronal activity. Front Neural Circuits. 2014;8:17. doi: 10.3389/fncir.2014.00017. [DOI] [PMC free article] [PubMed] [Google Scholar]
- Bonifazi P, Goldin M, Picardo MA, Jorquera I, Cattani A, Bianconi G, Represa A, Ben-Ari Y, Cossart R. GABAergic hub neurons orchestrate synchrony in developing hippocampal networks. Science. 2009;326:1419–1424. doi: 10.1126/science.1175509. [DOI] [PubMed] [Google Scholar]
- Brombas A, Fletcher LN, Williams SR. Activity-dependent modulation of layer 1 inhibitory neocortical circuits by acetylcholine. J Neurosci. 2014;34:1932–1941. doi: 10.1523/JNEUROSCI.4470-13.2014. [DOI] [PMC free article] [PubMed] [Google Scholar]
- Buhl EH, Tamas G, Fisahn A. Cholinergic activation and tonic excitation induce persistent gamma oscillations in mouse somatosensory cortex in vitro. J Physiol. 1998;513:117–126. doi: 10.1111/j.1469-7793.1998.117by.x. [DOI] [PMC free article] [PubMed] [Google Scholar]
- Cape EG, Manns ID, Alonso A, Beaudet A, Jones BE. Neurotensin-induced bursting of cholinergic basal forebrain neurons promotes gamma and theta cortical activity together with waking and paradoxical sleep. J Neurosci. 2000;20:8452–8461. doi: 10.1523/JNEUROSCI.20-22-08452.2000. [DOI] [PMC free article] [PubMed] [Google Scholar]
- Cardin JA, Carlén M, Meletis K, Knoblich U, Zhang F, Deisseroth K, Tsai LH, Moore CI. Driving fast-spiking cells induces gamma rhythm and controls sensory responses. Nature. 2009;459:663–667. doi: 10.1038/nature08002. [DOI] [PMC free article] [PubMed] [Google Scholar]
- Chalk M, Herrero JL, Gieselmann MA, Delicato LS, Gotthardt S, Thiele A. Attention reduces stimulus-driven gamma frequency oscillations and spike field coherence in V1. Neuron. 2010;66:114–125. doi: 10.1016/j.neuron.2010.03.013. [DOI] [PMC free article] [PubMed] [Google Scholar]
- Cynader M, Berman N. Receptive-field organization of monkey superior colliculus. J Neurophysiol. 1972;35:187–201. doi: 10.1152/jn.1972.35.2.187. [DOI] [PubMed] [Google Scholar]
- Dani JA, Bertrand D. Nicotinic acetylcholine receptors and nicotinic cholinergic mechanisms of the central nervous system. Annu Rev Pharmacol Toxicol. 2007;47:699–729. doi: 10.1146/annurev.pharmtox.47.120505.105214. [DOI] [PubMed] [Google Scholar]
- Davidson MC, Cutrell EB, Marrocco RT. Scopolamine slows the orienting of attention in primates to cued visual targets. Psychopharmacology. 1999;142:1–8. doi: 10.1007/s002130050855. [DOI] [PubMed] [Google Scholar]
- DeBello WM, Knudsen EI. Multiple sites of adaptive plasticity in the owl's auditory localization pathway. J Neurosci. 2004;24:6853–6861. doi: 10.1523/JNEUROSCI.0480-04.2004. [DOI] [PMC free article] [PubMed] [Google Scholar]
- Deco G, Thiele A. Attention: oscillations and neuropharmacology. Eur J Neurosci. 2009;30:347–354. doi: 10.1111/j.1460-9568.2009.06833.x. [DOI] [PMC free article] [PubMed] [Google Scholar]
- Disney AA, Aoki C. Muscarinic acetylcholine receptors in macaque V1 are most frequently expressed by parvalbumin-immunoreactive neurons. J Comp Neurol. 2008;507:1748–1762. doi: 10.1002/cne.21616. [DOI] [PMC free article] [PubMed] [Google Scholar]
- Disney AA, Domakonda KV, Aoki C. Differential expression of muscarinic acetylcholine receptors across excitatory and inhibitory cells in visual cortical areas V1 and V2 of the macaque monkey. J Comp Neurol. 2006;499:49–63. doi: 10.1002/cne.21096. [DOI] [PubMed] [Google Scholar]
- Disney AA, Aoki C, Hawken MJ. Gain modulation by nicotine in macaque v1. Neuron. 2007;56:701–713. doi: 10.1016/j.neuron.2007.09.034. [DOI] [PMC free article] [PubMed] [Google Scholar]
- Dudkin EA, Gruberg ER. Nucleus isthmi enhances calcium influx into optic nerve fiber terminals in Rana pipiens. Brain Res. 2003;969:44–52. doi: 10.1016/S0006-8993(03)02274-1. [DOI] [PubMed] [Google Scholar]
- Dye JC, Karten HJ. An in vitro study of retinotectal transmission in the chick: role of glutamate and GABA in evoked field potentials. Vis Neurosci. 1996;13:747–758. doi: 10.1017/S0952523800008622. [DOI] [PubMed] [Google Scholar]
- Endo T, Yanagawa Y, Obata K, Isa T. Nicotinic acetylcholine receptor subtypes involved in facilitation of GABAergic inhibition in mouse superficial superior colliculus. J Neurophysiol. 2005;94:3893–3902. doi: 10.1152/jn.00211.2005. [DOI] [PubMed] [Google Scholar]
- Fecteau JH, Munoz DP. Salience, relevance, and firing: a priority map for target selection. Trends Cogn Sci. 2006;10:382–390. doi: 10.1016/j.tics.2006.06.011. [DOI] [PubMed] [Google Scholar]
- Fisahn A, Pike FG, Buhl EH, Paulsen O. Cholinergic induction of network oscillations at 40 Hz in the hippocampus in vitro. Nature. 1998;394:186–189. doi: 10.1038/28179. [DOI] [PubMed] [Google Scholar]
- Fries P. A mechanism for cognitive dynamics: neuronal communication through neuronal coherence. Trends Cogn Sci. 2005;9:474–480. doi: 10.1016/j.tics.2005.08.011. [DOI] [PubMed] [Google Scholar]
- Fries P. Neuronal gamma-band synchronization as a fundamental process in cortical computation. Annu Rev Neurosci. 2009;32:209–224. doi: 10.1146/annurev.neuro.051508.135603. [DOI] [PubMed] [Google Scholar]
- Fries P, Reynolds JH, Rorie AE, Desimone R. Modulation of oscillatory neuronal synchronization by selective visual attention. Science. 2001;291:1560–1563. doi: 10.1126/science.1055465. [DOI] [PubMed] [Google Scholar]
- Garduño J, Galindo-Charles L, Jiménez-Rodríguez J, Galarraga E, Tapia D, Mihailescu S, Hernandez-Lopez S. Presynaptic α4β2 nicotinic acetylcholine receptors increase glutamate release and serotonin neuron excitability in the dorsal raphe nucleus. J Neurosci. 2012;32:15148–15157. doi: 10.1523/JNEUROSCI.0941-12.2012. [DOI] [PMC free article] [PubMed] [Google Scholar]
- Girod R, Barazangi N, McGehee D, Role LW. Facilitation of glutamatergic neurotransmission by presynaptic nicotinic acetylcholine receptors. Neuropharmacology. 2000;39:2715–2725. doi: 10.1016/S0028-3908(00)00145-3. [DOI] [PubMed] [Google Scholar]
- Goddard CA, Sridharan D, Huguenard JR, Knudsen EI. Gamma oscillations are generated locally in an attention-related midbrain network. Neuron. 2012;73:567–580. doi: 10.1016/j.neuron.2011.11.028. [DOI] [PMC free article] [PubMed] [Google Scholar]
- Goddard CA, Huguenard J, Knudsen E. Parallel midbrain microcircuits perform independent temporal transformations. J Neurosci. 2014;34:8130–8138. doi: 10.1523/JNEUROSCI.4399-13.2014. [DOI] [PMC free article] [PubMed] [Google Scholar]
- Gotti C, Zoli M, Clementi F. Brain nicotinic acetylcholine receptors: native subtypes and their relevance. Trends Pharmacol Sci. 2006;27:482–491. doi: 10.1016/j.tips.2006.07.004. [DOI] [PubMed] [Google Scholar]
- Gregoriou GG, Gotts SJ, Zhou H, Desimone R. High-frequency, long-range coupling between prefrontal and visual cortex during attention. Science. 2009;324:1207–1210. doi: 10.1126/science.1171402. [DOI] [PMC free article] [PubMed] [Google Scholar]
- Guillem K, Bloem B, Poorthuis RB, Loos M, Smit AB, Maskos U, Spijker S, Mansvelder HD. Nicotinic acetylcholine receptor 2 subunits in the medial prefrontal cortex control attention. Science. 2011;333:888–891. doi: 10.1126/science.1207079. [DOI] [PubMed] [Google Scholar]
- Hasselmo ME, Sarter M. Modes and models of forebrain cholinergic neuromodulation of cognition. Neuropsychopharmacology. 2011;36:52–73. doi: 10.1038/npp.2010.104. [DOI] [PMC free article] [PubMed] [Google Scholar]
- Herrero JL, Roberts MJ, Delicato LS, Gieselmann MA, Dayan P, Thiele A. Acetylcholine contributes through muscarinic receptors to attentional modulation in V1. Nature. 2008;454:1110–1114. doi: 10.1038/nature07141. [DOI] [PMC free article] [PubMed] [Google Scholar]
- Herrmann CS, Demiralp T. Human EEG gamma oscillations in neuropsychiatric disorders. Clin Neurophysiol. 2005;116:2719–2733. doi: 10.1016/j.clinph.2005.07.007. [DOI] [PubMed] [Google Scholar]
- Hunt SP, Künzle H. Selective uptake and transport of label within three identified neuronal systems after injection of 3H-GABA into the pigeon optic tectum: an autoradiographic and Golgi study. J Comp Neurol. 1976;170:173–189. doi: 10.1002/cne.901700204. [DOI] [PubMed] [Google Scholar]
- Jia X, Kohn A. Gamma rhythms in the brain. PLoS Biol. 2011;9:e1001045. doi: 10.1371/journal.pbio.1001045. [DOI] [PMC free article] [PubMed] [Google Scholar]
- Jindrichova M, Lansdell SJ, Millar NS. Changes in temperature have opposing effects on current amplitude in a7 and a4b2 nicotinic acetylcholine receptors. PLoS One. 2012;7:e32073. doi: 10.1371/journal.pone.0032073. [DOI] [PMC free article] [PubMed] [Google Scholar]
- Khayat PS, Niebergall R, Martinez-Trujillo JC. Frequency-dependent attentional modulation of local field potential signals in macaque area MT. J Neurosci. 2010;30:7037–7048. doi: 10.1523/JNEUROSCI.0404-10.2010. [DOI] [PMC free article] [PubMed] [Google Scholar]
- Knudsen EI. Control from below: the role of a midbrain network in spatial attention. Eur J Neurosci. 2011;33:1961–1972. doi: 10.1111/j.1460-9568.2011.07696.x. [DOI] [PMC free article] [PubMed] [Google Scholar]
- Knudsen EI, Knudsen PF. Disruption of auditory spatial working memory by inactivation of the forebrain archistriatum in barn owls. Nature. 1996;383:428–431. doi: 10.1038/383428a0. [DOI] [PubMed] [Google Scholar]
- Lenz D, Krauel K, Schadow J, Baving L, Duzel E, Herrmann CS. Enhanced gamma-band activity in ADHD patients lacks correlation with memory performance found in healthy children. Brain Res. 2008;1235:117–132. doi: 10.1016/j.brainres.2008.06.023. [DOI] [PubMed] [Google Scholar]
- Marín GJ, Durán E, Morales C, González-Cabrera C, Sentis E, Mpodozis J, Letelier JC. Attentional capture? Synchronized feedback signals from the isthmi boost retinal signals to higher visual areas. J Neurosci. 2012;32:1110–1122. doi: 10.1523/JNEUROSCI.4151-11.2012. [DOI] [PMC free article] [PubMed] [Google Scholar]
- Marín G, Mpodozis J, Mpdozis J, Sentis E, Ossandón T, Letelier JC. Oscillatory bursts in the optic tectum of birds represent re-entrant signals from the nucleus isthmi pars parvocellularis. J Neurosci. 2005;25:7081–7089. doi: 10.1523/JNEUROSCI.1379-05.2005. [DOI] [PMC free article] [PubMed] [Google Scholar]
- Matsui R, Tanabe Y, Watanabe D. Avian adeno-associated virus vector efficiently transduces neurons in the embryonic and post-embryonic chicken brain. PLoS One. 2012;7:e48730. doi: 10.1371/journal.pone.0048730. [DOI] [PMC free article] [PubMed] [Google Scholar]
- McMahon LL, Yoon KW, Chiappinelli VA. Nicotinic receptor activation facilitates GABAergic neurotransmission in the avian lateral spiriform nucleus. Neuroscience. 1994;59:689–698. doi: 10.1016/0306-4522(94)90187-2. [DOI] [PubMed] [Google Scholar]
- Mitra P, Bokil H. Observed brain dynamics. New York: Oxford UP; 2008. [Google Scholar]
- Mysore SP, Knudsen EI. Reciprocal inhibition of inhibition: a circuit motif for flexible categorization in stimulus selection. Neuron. 2012;73:193–205. doi: 10.1016/j.neuron.2011.10.037. [DOI] [PMC free article] [PubMed] [Google Scholar]
- Mysore SP, Knudsen EI. A shared inhibitory circuit for both exogenous and endogenous control of stimulus selection. Nat Neurosci. 2013;16:473–478. doi: 10.1038/nn.3352. [DOI] [PMC free article] [PubMed] [Google Scholar]
- Mysore SP, Knudsen EI. Descending control of neural bias and selectivity in a spatial attention network: rules and mechanisms. Neuron. 2014;84:214–226. doi: 10.1016/j.neuron.2014.08.019. [DOI] [PMC free article] [PubMed] [Google Scholar]
- Origlia N, Kuczewski N, Pesavento E, Aztiria E, Domenici L. The role of cholinergic system in neuronal plasticity: focus on visual cortex and muscarinic receptors. Arch Ital Biol. 2008;146:165–188. [PubMed] [Google Scholar]
- Papke RL, Thinschmidt JS. The correction of alpha7 nicotinic acetylcholine receptor concentration-response relationships in Xenopus oocytes. Neurosci Lett. 1998;256:163–166. doi: 10.1016/S0304-3940(98)00786-1. [DOI] [PubMed] [Google Scholar]
- Reches A, Gutfreund Y. Stimulus-specific adaptations in the gaze control system of the barn owl. J Neurosci. 2008;28:1523–1533. doi: 10.1523/JNEUROSCI.3785-07.2008. [DOI] [PMC free article] [PubMed] [Google Scholar]
- Rodriguez R, Kallenbach U, Singer W, Munk MH. Short- and long-term effects of cholinergic modulation on gamma oscillations and response synchronization in the visual cortex. J Neurosci. 2004;24:10369–10378. doi: 10.1523/JNEUROSCI.1839-04.2004. [DOI] [PMC free article] [PubMed] [Google Scholar]
- Sarter M, Parikh V, Howe WM. Phasic acetylcholine release and the volume transmission hypothesis: time to move on. Nat Rev Neurosci. 2009;10:383–390. doi: 10.1038/nrn2635. [DOI] [PMC free article] [PubMed] [Google Scholar]
- Sohal VS, Zhang F, Yizhar O, Deisseroth K. Parvalbumin neurons and gamma rhythms enhance cortical circuit performance. Nature. 2009;459:698–702. doi: 10.1038/nature07991. [DOI] [PMC free article] [PubMed] [Google Scholar]
- Sridharan D, Boahen K, Knudsen EI. Space coding by gamma oscillations in the barn owl optic tectum. J Neurophysiol. 2011;105:2005–2017. doi: 10.1152/jn.00965.2010. [DOI] [PMC free article] [PubMed] [Google Scholar]
- Sridharan D, Schwarz JS, Knudsen EI. Selective attention in birds. Curr Biol. 2014;24:R510–R513. doi: 10.1016/j.cub.2013.12.046. [DOI] [PubMed] [Google Scholar]
- Stitt I, Galindo-Leon E, Pieper F, Engler G, Engel AK. Laminar profile of visual response properties in ferret superior colliculus. J Neurophysiol. 2013;110:1333–1345. doi: 10.1152/jn.00957.2012. [DOI] [PubMed] [Google Scholar]
- Tyler CJ, Fite KV, Devries GJ. Distribution of GAD-like immunoreactivity in the retina and central visual system of Rana pipiens. J Comp Neurol. 1995;353:439–450. doi: 10.1002/cne.903530311. [DOI] [PubMed] [Google Scholar]
- Uhlhaas PJ, Singer W. Neural synchrony in brain disorders: relevance for cognitive dysfunctions and pathophysiology. Neuron. 2006;52:155–168. doi: 10.1016/j.neuron.2006.09.020. [DOI] [PubMed] [Google Scholar]
- Uhlhaas PJ, Singer W. Abnormal neural oscillations and synchrony in schizophrenia. Nat Rev Neurosci. 2010;11:100–113. doi: 10.1038/nrn2774. [DOI] [PubMed] [Google Scholar]
- Wang Y, Luksch H, Brecha NC, Karten HJ. Columnar projections from the cholinergic nucleus isthmi to the optic tectum in chicks (Gallus gallus): a possible substrate for synchronizing tectal channels. J Comp Neurol. 2006;494:7–35. doi: 10.1002/cne.20821. [DOI] [PubMed] [Google Scholar]
- Weigel S, Luksch H. Local cholinergic interneurons modulate GABAergic inhibition in the chicken optic tectum. Eur J Neurosci. 2014;39:730–737. doi: 10.1111/ejn.12438. [DOI] [PubMed] [Google Scholar]
- Whittington MA, Cunningham MO, LeBeau FE, Racca C, Traub RD. Multiple origins of the cortical gamma rhythm. Dev Neurobiol. 2011;71:92–106. doi: 10.1002/dneu.20814. [DOI] [PubMed] [Google Scholar]
- Wild JM. Pretectal and tectal projections to the homologue of the dorsal lateral geniculate nucleus in the pigeon: an anterograde and retrograde tracing study with cholera toxin conjugated to horseradish peroxidase. Brain Res. 1989;479:130–137. doi: 10.1016/0006-8993(89)91342-5. [DOI] [PubMed] [Google Scholar]