

Abstract
Parkinson's disease (PD) and essential tremor (ET) are the two most common movement disorders. Both have been associated with similar patterns of network activation leading to the suggestion that they may result from similar network dysfunction, specifically involving the cerebellum. Here, we demonstrate that parkinsonian tremors and ETs result from distinct patterns of interactions between neural oscillators. These patterns are reflected in the tremors' derived frequency tolerance, a novel measure readily attainable from bedside accelerometry. Frequency tolerance characterizes the temporal evolution of tremor by quantifying the range of frequencies over which the tremor may be considered stable. We found that patients with PD (N = 24) and ET (N = 21) were separable based on their frequency tolerance, with PD associated with a broad range of stable frequencies whereas ET displayed characteristics consistent with a more finely tuned oscillatory drive. Furthermore, tremor was selectively entrained by transcranial alternating current stimulation applied over cerebellum. Narrow frequency tolerances predicted stronger entrainment of tremor by stimulation, providing good evidence that the cerebellum plays an important role in pacing those tremors. The different patterns of frequency tolerance could be captured with a simple model based on a broadly coupled set of neural oscillators for PD, but a more finely tuned set of oscillators in ET. Together, these results reveal a potential organizational principle of the human motor system, whose disruption in PD and ET dictates how patients respond to empirical, and potentially therapeutic, interventions that interact with their underlying pathophysiology.
Keywords: accelerometery, cerebellum, essential tremor, Parkinson's disease, transcranial alternating current stimulation, tremor
Introduction
Pathological tremor represents one of the most severe and prevalent examples of aberrant synchronization within the human motor system, affecting patients' ability to perform activities of daily living (Bain et al., 1993; Wenning et al., 2005). Despite this, no tremor syndrome currently has a firmly established anatomical or physiological basis; and, as such, treatment approaches are limited and often unsatisfactory. In patients with Parkinson's disease (PD) and essential tremor (ET), interest has been particularly focused on abnormal central oscillatory activity (Elble et al., 1996), which is thought to spill over into the periphery (McAuley and Marsden, 2000; Brittain and Brown, 2013). Functional connectivity measures, such as corticomuscular, corticocortical, and subcortico-cortical coherence, have revealed a stereotypic tremor network common to both diseases. Included in this network are areas such as primary and supplementary motor cortices, sensory-parietal zones, thalamus, globus pallidus, and cerebellum (Bucher et al., 1997; Timmermann et al., 2003; Schnitzler and Gross, 2005; Muthuraman et al., 2012; Helmich et al., 2013). The cerebellar system in particular seems to have a central role in both pathologies as evident from the disappearance of tremor following pathological and therapeutic lesions of cerebellar receiving zones of thalamus (Ohye et al., 1982; Benabid et al., 1991).
Remarkably, the same stereotypic network emerges in volitional mimicked tremor, although functional connectivity strengths are altered (Muthuraman et al., 2012). Despite this, it remains unclear how the above tremorogenic network arises in the healthy motor system, how disruption to this network drives abnormal oscillatory activity, and how this leads to different forms of tremor. After all, parkinsonian tremors and ETs do differ; the former is maximal at rest, often emerging only after several seconds, whereas ET is a postural and kinetic tremor (Deuschl et al., 1998). Moreover, reports are mixed as to whether variability in tremor amplitude is greatest in parkinsonian tremor or ET (O'Suilleabhain and Matsumoto, 1998; Gao et al., 2004; Jankovic and Tolosa, 2007). Yet neurophysiological approaches typically examine tremor through the use of time-invariant measures, such as histogram-based statistics, that cannot adequately capture temporal fluctuations in tremor amplitude or frequency.
We characterized differences in the temporal evolution of parkinsonian rest tremor and postural ET, two of the most common movement disorders. In so doing, we sought to reveal the organization governing the multiple oscillators thought to underlie tremor. Through close examination of the peripheral tremor, we show that there is an inherent organizational distinction between PD and ET. These pathophysiological characteristics are captured in the frequency tolerance of tremor, a novel measure that quantifies the range of frequencies over which the tremor may be considered stable. Moreover, a patient's inherent frequency tolerance governed the susceptibility of their tremor to entrainment by extrinsic transcranial alternating current stimulation (TACS). Our findings confirm the central role of the cerebellar system in pacing tremors associated with ET and that both ET and parkinsonian tremors are underpinned by linked neural oscillators that vary in how broadly or finely tuned their coupling is. This pathophysiological distinction will dictate how patients respond to empirical and, potentially, therapeutic interventions.
Materials and Methods
Patients.
The study was approved by the local research ethics committee in accordance with the Declaration of Helsinki, and all participants provided informed written consent. We studied two patient cohorts (total N = 45): (1) patients with PD (N = 24) and (2) patients with ET (N = 21). Patients were recruited by experienced movement disorders specialists, and the diagnoses fulfilled the Queen Square Brain Bank criteria for PD (Hughes et al., 1992) and criteria of the Tremor Investigation Group and consensus statement of the Movement Disorder Society for Essential Tremors (Deuschl et al., 1998). Unless otherwise stated, data are mean ± SD.
A triaxial accelerometer (Twente Medical Systems International) was placed over the distal interphalangeal joint of the middle finger or over the distal phalange of the thumb in those cases where tremor could be more reliably obtained from this site. In a subset of 13 patients, surface EMG was also obtained from associated muscle groups showing tremor-related activity, typically extensor digitorum communis and flexor carpi radalis. Data were recorded using a TMSI Porti amplifier (Twente Medical Systems International), low-pass filtered at 500 Hz, and digitized at a sampling rate of 2048 Hz. The surface EMGs were high-pass filtered (40 Hz) and rectified before analysis.
Two recordings were made while subjects sat in a chair comfortably with their eyes open: Experiment 1 (while no stimulation was applied) and Experiment 2 (during TACS over cerebellum). Twelve patients with PD (age 70.1 ± 6.5 years, 7 male) and 13 ET patients (age 62.9 ± 10.7 years, 10 male) participated solely in Experiment 1, whereas 12 patients with PD (age 68.1 ± 10.0 years, 8 male) and 8 patients with ET (age 71.8 ± 10.8 years, 6 male) participated in both Experiments 1 and 2. Thus, we were able to cross-validate our findings with respect to tremor frequency tolerance (see later) in two distinct cohorts. All patients were recorded after overnight withdrawal of any medication for their tremor. Tremor severity in each case was assessed by accelerometery, which bears a direct relationship to the tremor rating scales commonly used in clinical assessment (Elble et al., 2006).
Patients were asked to assume a tremor-provoking posture. During the recordings acquired from patients with PD, this involved resting their wrist on a silicon support at the edge of a table, such that their worse affected hand was supported yet free from obstruction. During the recordings acquired from patients with ET, patients were asked to hold their worse affected arm outstretched in front, with the wrist slightly extended. Tremor was recorded for up to 10 min in each stimulation condition (mean 7.1 ± 3.2 min). The PD patient cohort usually completed each recording block in a single session, whereas breaks of 30 s were given in the postural condition at 2 min intervals to prevent fatigue. During the second recording block, transcranial ipsilateral cerebellar stimulation was delivered through rubber electrodes, encased in saline-soaked sponges. The active electrode (5 × 7 cm2) was situated 3 cm lateral of the inion, ipsilateral to tremor (in accordance with Ugawa et al., 1995). The return electrode (5 × 11 cm2) was centered on the shoulder contralateral to the recorded tremor.
To verify that any differences in parkinsonian rest and postural ET did not originate simply as a consequence of postural state, 7 patients diagnosed with parkinsonian rest tremor who also showed signs of postural tremor (5 with reemergent postural tremor, 2 with rapid onset postural tremor similar to ET) (Hallett and Deuschl, 2010) were recalled, and Experiment 1 (no stimulation) was repeated on a separate day for their postural condition (worse affected arm outstretched). Additionally, to verify the robustness of our approach, 4 of these patients also repeated Experiment 1 for their rest tremor during their second visit. Furthermore, one patient with ET, who presented with prominent postural and rest tremors, was also assessed in both positions.
Preprocessing.
The triaxial accelerometer data were trend corrected (0.1 Hz high-pass filtered) and then rotated by principle component analysis (PCA) with the first principle component (i.e., that which captured the greatest signal power) selected for analysis. This ensured that we captured the orientation corresponding to maximal tremor amplitude. The first principle component of tremor was filtered about its corresponding peak frequency identified from the power spectrum (±2 Hz separate forward-backward zero-phase third-order finite impulse response Butterworth filters). This 4 Hz pass-band was chosen so as to capture the full tremor range while minimizing noise from higher-frequency bands. For those subjects who participated in both recordings, PCA and tremor frequency were assessed separately between stimulation and nonstimulation conditions.
Frequency tolerance.
We sought to assess how tremor frequency evolves over time, and so plotted tremor frequency against the average change in tremor frequency (illustrated schematically in Fig. 1). These plots, which we dub frequency tolerance profiles, reveal how tremor behaves at the different tremor frequencies it spontaneously assumes. The tremor may be considered stable when the rate of change in tremor frequency from one cycle to the next is approximately zero (Δf ≈ 0): in other words, when there is no systematic shift in tremor frequency from moment to moment. In such cases, tremor frequency is equally likely to increase or decrease on the next cycle. The width of this region defines our measure of frequency tolerance. When the tremor frequency deviates from this region, there is a strong dynamic that returns the tremor frequency back to this region (characterized by the gradients in Fig. 1). Some tremors exhibited attraction to a single frequency and are hence referred to as “zero frequency tolerant” because they resist perturbation away from that frequency. Others exhibit a range of tolerant frequencies characterized by a central flat region in their frequency tolerance profiles and are hence referred to as “broad frequency tolerant.” This approach reveals whether the neural circuitry underlying tremor converges on a single frequency or a quantifiable range of frequencies over which the tremor may be considered stable.
Figure 1.

Frequency tolerance estimation method. A, The first principle component of hand tremor was extracted from triaxial accelerometer data and selected for further analysis. B, The tremor signal was filtered around its central frequency (±2 Hz) and a zero-crossing threshold applied. This isolated the interval between successive crossings and thus provided a measure of “instantaneous” frequency (on a cycle-by-cycle basis). Instantaneous frequency follows as the reciprocal of interval (fn = 1/Tn), with the rate of change in frequency given by Δfn = fn − fn+1. C, Graph of schematic frequency tolerance profile, where the rate of change in frequency, Δf, is displayed against instantaneous frequency, f, in the simple linear case where there is zero frequency tolerance. D, Graph of schematic frequency tolerance profile for the piecewise-linear case where there is broad frequency tolerance. The upper and lower intercepts (cu and cl, respectively) encompass the frequency tolerance region (highlighted in green) where Δf = 0.
To derive the frequency tolerance profiles, we used a zero-crossing threshold to determine the interval Tn of each tremor cycle (Fig. 1). The corresponding instantaneous frequency follows as fn = 1/Tn. We derive tremor amplitude as the magnitude of the Hilbert-transformed tremor signal (Marple, 1999), down-sampled at each tremor cycle, and designated An. Instantaneous frequency and amplitude distributions were constructed by unit normalizing the histograms of fn and An. We then plotted instantaneous frequency fn against its cycle derivative Δfn = fn − fn+1 (Fig. 1). We take a forwards difference such that Δfn corresponds to the update in frequency expected on the next cycle. The frequency tolerance profiles took two predominant forms: one where there was zero-tolerance versus one where there was a range of frequency tolerance. Mathematically, the former can be described by a simple linear regression, whereas the latter can be effectively described by a piecewise-linear function with a central flat region (Figs. 1 and 2). The flat region, where Δf ≈ 0, defines our measure of frequency tolerance.
Figure 2.

Frequency tolerance patterns. Frequency tolerance plots are presented for representative ET (A) and PD (B) patients above their respective instantaneous frequency histograms. A, The ET patient was best fit by simple linear regression, where the zero-crossing coincides with median tremor frequency. B, The PD patient was best fit by a three component piecewise-linear function (see Materials and Methods; Fig. 1). Thin black lines indicate the mean instantaneous frequency difference (Δf) plotted against instantaneous frequency (see Materials and Methods). Gray lines indicate ± SD about the mean. Bold black lines indicate the best fit solution. Red vertical bars represent median tremor frequency in each case. Green highlight on the piecewise-linear fit represents the frequency tolerance region (cu − cl Hz). These examples were chosen to highlight divergent tolerance behavior despite approximately matched median tremor frequencies (fc) and frequency SDs (σ). C, Temporal evolution of frequency for the first 500 cycles of the ET (green) and PD (blue) datasets.
To estimate frequency tolerance, we fitted a three-component piecewise-linear function to the frequency tolerance profile. First, frequency was stratified into 0.1 Hz bins with the mean and SD estimated per bin. The piecewise relationship may be considered a function of the four-parameter tuple A = {cl, ml, cu, mu} (Fig. 1) and is defined as follows:
 |
Parameters {cl, cu} represent the lower and upper extents of the frequency tolerance region, respectively, such that the frequency tolerance metric is given by (cu − cl). Parameters {ml, mu} represent the gradients at the lower and upper extents that describe the rate at which tremor frequency returns to its stable (central) region. To estimate the parameter tuple, we apply a constrained nonlinear optimization procedure (fmincon function in MATLAB; MathWorks) using Pearson's χ2 goodness-of-fit. We constrain the frequency extents such that cu > cl and further aid the optimization procedure by restricting gradients such that {m1, mu} ∈ [0.25,10] and intercepts such that {c1, cu} ∈ [fc − 4σ, fc + 4σ] where fc stands for the mean of the instantaneous frequency distribution (determined on a subject basis) with σ the SD. The limits on gradients and intercepts aid convergence while preventing extreme fits driven by outliers. Only data with clear tremor were considered; but to ensure that our results were not impacted by spurious threshold crossings driven by excess noise, we rejected all crossings where tremor amplitude fell in its lowest fifth percentile. Where the frequency tolerance relationship was better described by a simple linear regression (as determined by Akaike's information criterion) (Burnham and Anderson, 2002), frequency tolerance was set to zero. Goodness-of-fit was assessed in each case by the coefficient of determination (R2). To assert that the frequency tolerance characteristics captured by this metric reflect a fundamental property of central drive, rather than the compound contribution of multiple tremor oscillators arising from separate muscle groups, this analysis was repeated on the (rectified) EMG data, where available.
Relationship to peak tremor frequency and peak tremor amplitude.
We sought to assess the relationship between frequency tolerance and fundamental properties of the tremor, such as median tremor amplitude and frequency. The distributions of tremor amplitude and frequency for each patient were therefore aligned to the center of their frequency tolerance region (or zero-crossing point for those best described as zero frequency tolerant). Realignment allowed group-average distributions to be constructed but also permitted the median tremor frequency and median tremor amplitude to be assessed against the central frequency tolerance (one-sample Wilcoxon signed rank tests). For those patients best described as broad frequency tolerant, we further assessed whether median amplitudes fell within the estimated tolerance range (Pearson's χ2 test).
Classification performance.
The efficacy of frequency tolerance to distinguish PD from ET was assessed by a blinded k-means (2-state) classifier and a receiver operating characteristic (ROC) curve (Zweig and Campbell, 1993). Classifier performance was quantified by percentage sensitivity, specificity, accuracy, and Cohen's κ statistic (Cohen, 1960). Cross-validation was performed over group iterations. For each iteration, all subjects (N = 45) were randomly divided into two subgroups (of group sizes 22 and 23 samples). The frequency tolerance threshold for diagnostic separation (PD vs ET) was determined for one of these groups via the k-means algorithm, with classifier performance evaluated in the second (independent) group. The cross-validated threshold for detection, along with classifier performance (accuracy and Cohen's κ statistic) are reported. Although additional parameters would undoubtedly improve the classifiers accuracy, we seek to demonstrate an organizational dissociation between parkinsonian tremors and ETs and, therefore, restrict ourselves to consideration of only the frequency tolerance metric. For comparison, the SD of frequency (which may intuitively be expected to reflect such time-varying characteristics) was separately assessed by a k-means (2-state) classifier.
TACS.
We further sought to assess the capacity of alternating current stimulation, applied across the skull, to both entrain the peripheral tremor and to modulate its amplitude using the approach used by Mehta et al. (2014). Stimulation was applied at the frequency of each patient's tremor, estimated from the power spectrum with a precision of 0.1 Hz. This frequency was chosen to correspond with that of the resonant tremor network, which should prove maximally mutable to extrinsic stimulation at this frequency (Fröhlich and McCormick, 2010; Brittain et al., 2013). Alternating current stimulation was delivered at 2 mA, peak-to-peak, through a neuroConn DC-Stimulator Plus.
The phase difference between the rhythmic tremor and alternating current stimulation was computed and stratified into 20 phase bins. The amplitude envelope of the tremor signal was Box-Cox transformed to aid normality. Phase-difference histograms were constructed over 20 phase bins and normalized as probability distributions. Entrainment was quantified by the phase synchronization index (PSI) derived directly from the phase-difference distributions. Specifically, for a distribution of phase bins ϕn with associated probabilities pn, the corresponding PSI was computed as |∑pneiϕn|. Amplitude histograms were similarly constructed where the (Box-Cox transformed) mean amplitude of tremor was computed for each of the 20 stratified phase-difference bins, inverse transformed, and normalized as probability distributions. The strength of amplitude effects were similarly quantified by the PSI of their distributions.
A surrogate dataset was constructed from the no stimulation condition (Experiment 1) by substituting an artificial TACS waveform at the stimulation frequency. Analysis then proceeded as in the stimulation case. Stimulation effects were assessed against the surrogate dataset by nonparametric Wilcoxon paired-samples signed rank tests. Where a significant effect of stimulation was observed and the Shapiro-Wilk test failed to reject the null hypothesis of normality, Pearson's product-moment correlation coefficient was calculated to assess the dependence of frequency tolerance on stimulation effects. To assert the robustness of this result (i.e., to outliers), the test was repeated using the nonparametric Spearman's rank correlation coefficient.
Oscillator model.
By modeling a set of oscillators, we demonstrate that the distribution of oscillator frequencies is sufficient to lead to either broad frequency tolerance profiles or zero frequency tolerance. The simulation consisted of N = 101 oscillators of the form xn(t) = cos(φn(t)) + ρηn(t) with phase φ(t) described by the stochastic differential equation:
 |
Each oscillator was associated with its own natural frequency ωn, with phase increments (sampled at 1000 Hz) corrupted by independent identically distributed white noise εn(t) with σ = 2. Likewise, the derived sinusoid xn(t) was corrupted by similar additive noise η(t) with ρ = 20. The simulation was repeated with oscillators adopting different frequency distributions. These were (1) normal (μ = 5 Hz, σ = 0.643 Hz) or (2) uniform across the interval (3.5, 6.5 Hz). In each case, the frequency tolerance profile for each oscillator was determined after bandpass filtering about its center frequency, and the results were averaged to produce a composite output.
Results
Tremor characteristics
Patient demographics are provided in Table 1, where all patients were recorded after overnight withdrawal of their usual tremor-suppressing medication. The amplitude of tremor, as well as the mean and SD of tremor frequency, are summarized for each group in Tables 2 and 3. A multivariate ANOVA with factors diagnosis (PD or ET) and experiment (1 or 2) confirmed that patient age and tremor characteristics were appropriately matched both between diagnoses (all F(1,41) < 3.32, p > 0.05), and between experimental groups (all F(1,41) < 2.53, p > 0.05).
Table 1.
Patient demographicsa
| Diagnosis | Age (years) | Tremor suppression medication (daily dose) | |
|---|---|---|---|
| 1 | PD | 77 | Entacapone 800 mg, levodopa 400 mg, rotigotine 6 mg, amantadine 100 mg |
| 2 | PD | 67 | Ropinirole 6 mg, levodopa 200 mg |
| 3 | PD | 83 | Propranolol 40 mg, levodopa 150 mg |
| 4 | PD | 65 | Levodopa 600 mg, rotigotine 4 mg |
| 5 | PD | 76 | Rasagiline 1 mg, pramipexole 1.57 mg |
| 6 | PD | 60 | Ropinirole 12 mg |
| 7 | PD | 63 | Ropinirole 2.25 mg |
| 8 | PD | 46 | — |
| 9 | PD | 62 | Trihexyphenidyl 1.0 mg, levodopa 300 mg |
| 10 | PD | 78 | — |
| 11 | PD | 69 | Levodopa 200 mg |
| 12 | PD | 71 | Levodopa 550 mg, ropinirole 2 mg |
| 13 | PD | 74 | Levodopa 300 mg |
| 14 | PD | 75 | Orphenadrine 150 mg, levodopa 50 mg |
| 15 | PD | 65 | Ropinirole 12 mg, levodopa 150 mg |
| 16 | PD | 67 | — |
| 17 | PD | 68 | Levodopa 300 mg, ropinirole 15 mg |
| 18 | PD | 69 | — |
| 19 | PD | 77 | Levodopa 600 mg |
| 20 | PD | 75 | Rasagaline 1 mg, pramipexole 1.57 mg |
| 21 | PD | 73 | Pramipexole 1.75 mg |
| 22 | PD | 74 | Levodopa 150 mg, rasagaline 1 mg |
| 23 | PD | 71 | Levodopa 600 mg, ropinirole 3 mg |
| 24 | PD | 53 | Rasagaline 1 mg, trihexyphenidyl 3 mg |
| 25 | ET | 56 | Propranolol 40 mg |
| 26 | ET | 77 | Botulinum toxin injection |
| 27 | ET | 74 | — |
| 28 | ET | 54 | — |
| 29 | ET | 84 | — |
| 30 | ET | 78 | Bisoprolol 5 mg |
| 31 | ET | 77 | — |
| 32 | ET | 74 | — |
| 33 | ET | 67 | Propranolol 160 mg |
| 34 | ET | 69 | Propranolol 160 mg |
| 35 | ET | 62 | — |
| 36 | ET | 59 | — |
| 37 | ET | 34 | — |
| 38 | ET | 70 | — |
| 39 | ET | 67 | — |
| 40 | ET | 61 | — |
| 41 | ET | 55 | — |
| 42 | ET | 56 | — |
| 43 | ET | 71 | — |
| 44 | ET | 73 | — |
| 45 | ET | 74 | — |
a —, No medication.
Table 2.
Baseline tremor characteristics: nonstimulation group
| PD (n = 12) |
ET (n = 13) |
|||
|---|---|---|---|---|
| Mean | SD | Mean | SD | |
| Frequency (Hz) | ||||
| Mean | 5.246 | 0.799 | 4.845 | 0.730 |
| SD | 0.889 | 0.487 | 0.657 | 0.350 |
| Amplitude (m/s2) | 5.849 | 2.000 | 2.985 | 2.245 |
Table 3.
Baseline tremor characteristics: stimulation group
| PD (n = 12) |
ET (n = 8) |
|||
|---|---|---|---|---|
| Mean | SD | Mean | SD | |
| Frequency (Hz) | ||||
| Mean | 4.916 | 0.555 | 5.625 | 0.967 |
| SD | 0.488 | 0.275 | 0.670 | 0.497 |
| Amplitude (m/s2) | 3.551 | 1.893 | 2.729 | 1.104 |
Frequency tolerance distinguishes tremor in PD from ET
The frequency tolerance profiles of tremor can be categorized as either zero frequency tolerant or broad frequency tolerant. Tremor with zero frequency tolerance was best quantified by a simple linear fit applied to the frequency tolerance profile, whereas those with a broad frequency tolerance were best described by a piecewise-linear fit (overall R2 goodness-of-fit 0.808 ± 0.195).
Categorization of frequency tolerance by pathology suggested that patients with PD had greater frequency tolerance than those with ET, albeit with some overlap. Pathology-dependent differences were first assessed in those patients who participated solely in Experiment 1, where we observed a significant group separation in frequency tolerance by pathology (Wilcoxon rank sum, z = −2.686, p = 0.009, medians 1.156 PD, 0.370 ET). This result was validated in our second cohort of patients who participated in Experiments 1 and 2 (i.e., the no stimulation and stimulation recordings). Averaging frequency tolerance over stimulation and no stimulation conditions (there was no consistent shift in frequency tolerance between stimulation conditions, medians 0.443 vs 0.420, Wilcoxon signed rank, U = 59, p = 0.978) revealed an analogous dependence of frequency tolerance on pathology (Wilcoxon rank sum, z = −2.060, p = 0.039; medians: 0.859 PD, 0.279 ET). The same was also seen when the two patient cohorts were pooled (Fig. 3A). This result could not be attributed to age because regression of frequency tolerance with age in the combined PD (R2 = 0.061, F(1,22) = 1.424, p = 0.245) and ET (R2 = 0.051, F(1,19) = 1.018, p = 0.326) cohorts proved nonsignificant. Additionally, whereas the PD cohort were marginally older in Experiment 1 (mean age PD 70.1 vs ET 62.9), the same frequency tolerance distinction could be replicated in the second cohort, where the ET group was instead marginally older (mean age PD 68.1 vs ET 71.8).
Figure 3.
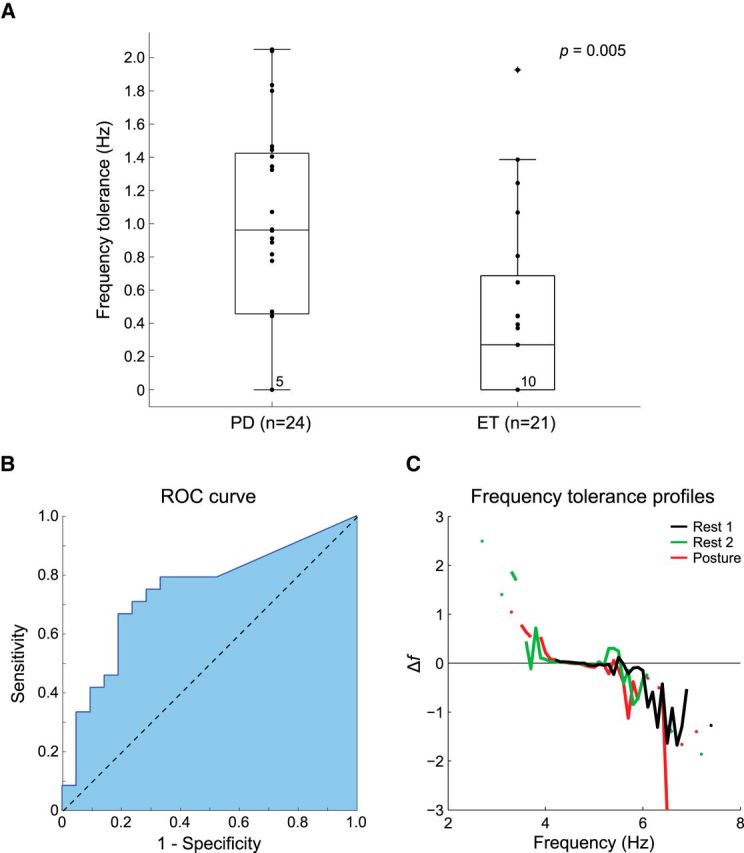
Frequency tolerance distinguishes parkinsonian tremor from ET. A, Frequency tolerance is presented for the combined cohort of PD (n = 24) and ET (n = 21) patients. Box-plots delineate the 25th and 75th percentiles with medians represented by horizontal bars. Whiskers extend 1.5 times the interquartile range beyond the 25th and 75th percentiles. Individual dots indicate patient data. The number of subjects in each group best fit by simple linear regression is stated at the zero crossing. The group split in the combined cohort is highly significant (Wilcoxon rank sum, z = −2.794, p = 0.005). B, ROC curve depicting the sensitivity and specificity of frequency tolerance as a diagnostic differentiator between PD and ET. C, Frequency tolerance profiles for a representative patient with PD contrasting their resting tremor (Rest 1) with resting tremor on a subsequent visit (Rest 2) and postural tremor (Posture).
To demonstrate the sensitivity of frequency tolerance as a metric to distinguish patients with PD from those with ET, a ROC curve was constructed (Fig. 3B) and a k-means classifier trained over the combined dataset from both cohorts using solely the frequency tolerance metric. The sensitivity of the classifier in identifying those patients diagnosed with PD was 77.3%, with a specificity of 69.6%, leading to an overall classification accuracy of 73.4% (Cohen's κ = 0.468, group-separation threshold 0.733 Hz). In comparison, classification using the SD of frequency, which might have been expected to reflect changes in frequency, performed at a level much closer to chance (accuracy 59.6%, sensitivity 61.5%, specificity 57.9%, Cohen's κ = 0.192). The classifier performance was reaffirmed through cross-validation over 100 group permutations (see Materials and Methods), producing a mean accuracy of 70.1 ± 11.8% (κ = 0.402 ± 0.236) with a derived group-separation threshold of 0.770 ± 0.111 Hz.
Frequency tolerance reflects a fundamental property of central drive
To assert that frequency tolerance captured a fundamental property of central drive, rather than the compound contribution of multiple tremor oscillators arising from separate muscle groups, frequency tolerance measures were calculated from surface EMG data corresponding to the most tremor-affected muscle group (see Materials and Methods). These measures were compared, by linear regression, with the values obtained by accelerometry. We found a close correspondence between frequency tolerance measures derived from EMG and accelerometer data in both the PD (R2 = 0.829, F(1,6) = 24.287, p = 0.004) and ET (R2 = 0.902, F(1,5) = 36.749, p = 0.004) patient groups. Because the same pattern of frequency tolerance is evident in EMG data, we conclude that our derived frequency tolerance measures do not merely reflect the composite output of multiple separate oscillators arising from neighboring muscle groups.
Posture is not the cause of the frequency tolerance difference between PD and ET
Seven patients diagnosed with PD who displayed both rest and postural tremors were recalled for separate assessment of their tremors. Not only were all rest and postural tremors best described as broad frequency tolerant (χ2 = 14, p < 0.01), but the frequency tolerance of tremor proved consistent between rest and postural conditions (piecewise-linear R2 goodness-of-fit: rest 0.899 ± 0.058, posture 0.870 ± 0.101). Furthermore, in the 4 patients who repeated the rest tremor experiment over two separate visits (the mean time between first and second visits was 11 ± 7 months), all tremors were again best described as broad frequency tolerant (χ2 = 8, p < 0.01). Tremor dynamics proved stable across visits as well as between rest and postural conditions (piecewise-linear R2 goodness-of-fit: initial visit rest 0.818 ± 0.156, second visit rest 0.732 ± 0.234, second visit posture 0.856 ± 0.099; Fig. 3C). Additionally, one patient with ET who presented with both postural and rest tremors demonstrated zero frequency tolerance characteristics across both positions (linear R2 goodness-of-fit: rest 0.905, posture 0.455).
These findings highlight consistency in the tremors' intrinsic frequency tolerance during postural shifts such that differences in posture were not responsible for the differences in frequency tolerance observed between PD and ET patient cohorts.
Tremor amplitude peaks lie within the frequency tolerance range
Tremor severity (i.e., amplitude) varied with tremor frequency. To examine the group average distributions of frequency and amplitude, we separately realigned each patient's data to the center of their frequency tolerance region (Fig. 4). The most prevalent tremor frequency coincided with the center of this frequency tolerance region and, where frequency tolerance was broad, frequency distributions were also broad. Tremor amplitude also peaked about the center of the frequency tolerance region, such that shifts in frequency away from this central point were associated with a reduction in tremor amplitude. For those with a broad frequency tolerance, 28 of 30 patients possessed median amplitudes that fell within their estimated frequency tolerance region (χ2 = 22.533, p < 0.001), being on average −0.089 ± 0.422 Hz shifted from the center of this region (one-sample Wilcoxon signed rank test, p = 0.153). For those with zero frequency tolerance, median amplitudes were even more consistently focused about the preferred tremor frequency, albeit with a slight bias toward lower frequencies (−0.141 ± 0.144 Hz, one-sample Wilcoxon signed rank test, p < 0.001).
Figure 4.

Group average of tremor frequency and amplitude distributions. Top row, Mean frequency distributions (±95% confidence intervals about the mean) realigned to the center of the frequency tolerance region. Bottom row, Mean amplitude distributions realigned to the center of the frequency tolerance region. Dots indicate the frequency of each subject's median amplitude. Tremor frequency and amplitude show peaked distributions that center within their frequency tolerance region.
Rhythmic stimulation over cerebellum entrains tremor
A total of 20 patients (12 PD, 8 ET) underwent cerebellar TACS. There was a significant influence of stimulation on tremor entrainment relative to surrogates (Wilcoxon signed rank, z = −2.277, p = 0.023), but stimulation did not induce any change in the amplitude of the peripheral tremor (z = −0.1867, p = 0.852). Additionally, there was no linear correlation between amplitude and entrainment (R2 = 0.031, p = 0.460). There was also no group distinction in entrainment between PD and ET patients (Wilcoxon rank sum, z = 1.196, p = 0.232).
Frequency tolerance predicts the extent of cerebellar entrainment
The above suggests that external forcing (driving through stimulation) of the cerebellar system can influence tremor phase and thereby the instantaneous frequency of tremor. But does this mean that the cerebellar system plays a similar role with respect to spontaneous, intrinsic changes in the unstimulated, baseline case? Accordingly, we investigated whether the cerebellar system's effects on entrainment during stimulation correlated with how tremor behaves in response to spontaneous (intrinsic) changes in frequency, as quantified by baseline frequency tolerance profiles (Fig. 1).
The frequency tolerance of tremor defined in the nonstimulated condition was significantly predicted by the degree of entrainment upon cerebellar stimulation across the cohort (F(1,18) = 9.315, p = 0.007). This relationship accounted for >30% of the variance in frequency tolerance (R2 = 0.341; Fig. 5) and was reciprocal (R = −0.584), such that greater levels of cerebellar entrainment predicted a tighter frequency tolerance (Shapiro–Wilk failed to reject the null hypothesis of normality for either frequency tolerance or cerebellar entrainment). The relationship proved robust, producing a Spearman's rank correlation of ρ = −0.598. Importantly, this relationship cannot be explained by spontaneous shifts in tremor frequency (specifically in reference to those patients who displayed broader frequency tolerances) or stimulation mismatches with tremor frequency (mean 0.009 ± 0.280 Hz) because there was no relationship between frequency tolerance and entrainment in the surrogate dataset (R2 = 0.091, p = 0.196).
Figure 5.

Baseline frequency tolerance predicts the degree of cerebellar entrainment. Entrainment was quantified by the phase synchronization index. PD, PD patient; ET, ET patient. Inset, Regression line (black) and its 95% confidence limits (red) are shown together with goodness of fit.
Furthermore, although there was no group distinction in entrainment between PD and ET patients (see above), a highly significant difference did emerge when patients were separated according to whether their tremor was best described as zero frequency tolerant or broad frequency tolerant (median PSIs 0.028 and 0.089, z = −2.887, p = 0.004). Additionally, those tremors classified as narrow frequency tolerant were significantly entrained beyond the level of their surrogates (z = 2.298, p = 0.022), whereas those classified as broad frequency tolerant were not (z = 0.265, p = 0.791). The frequency tolerance of the tremor was therefore important in determining the extent of cerebellar entrainment, with narrower tolerances corresponding to higher levels of entrainment.
Can time-invariant, histogram-based statistics substitute for frequency tolerance profiles?
We sought to determine whether classical time-invariant, histogram-based statistics, such as the mean and SD of frequency, could substitute for our frequency tolerance metric. By using a multiple linear regression to predict frequency tolerance in the combined patient cohort (n = 45) using the mean, SD, skew, and kurtosis of the instantaneous frequency distribution, median instantaneous tremor amplitude, and diagnosis (PD/ET), it was revealed that skew (standardized β = 0.748, F(1,38) = 5.293, p = 0.027), kurtosis (standardized β = −0.679, F(1,38) = 4.675, p = 0.037), and diagnosis (standardized β = −0.299, F(1,38) = 4.27, p = 0.045) significantly predicted our frequency tolerance metric (F(6,38) = 4.105, p = 0.003, R2 = 0.393, adjusted R2 = 0.297). In line with Figure 2, there was no independent relationship between frequency tolerance and either the mean (F(1,38) = 1.341, p = 0.254) or SD (F(1,38) = 0.191, p = 0.664) of tremor frequency. Nor was there any relationship with median instantaneous tremor amplitude (F(1,38) = 3.100, p = 0.086). Thus, frequency tolerance, which is by design a measure that indexes temporal dynamics (i.e., how the tremor frequency evolves from moment to moment), contains information that is not captured by standard first-order statistics, such as the mean and SD of tremor frequency. Instead, it related, in part, to higher-order statistical properties, such as skew and kurtosis, which are themselves strongly associated with dynamic behavior (Parra and Spence, 2001).
A simple model explains different patterns of frequency tolerance
Here, we demonstrate that superposition of multiple oscillators can lead to broad frequency tolerances, or zero frequency tolerance, depending only on their population frequency tuning. In Figure 6, we present idealized and simulated frequency tolerance profiles for (1) a single oscillator, (2) a uniform distribution, and (3) a normal distribution of oscillator frequency. The population response of a single oscillator is linear (Fig. 6A), whereas uniformly distributed oscillators turn out to possess piecewise-linear characteristics (Fig. 6B). Normally distributed oscillators resemble a simple linear response, although the slope of this profile is more shallow than we typically observe in pathological tremors (Fig. 6C). Thus, this simple model was able to replicate the two contrasting patterns of frequency tolerance present in tremor recordings (Fig. 2) and supports an organizational principle that predicts multiple distinct tremor oscillators that tend to be dispersed in frequency in PD but are finely tuned with a predilection toward a specific central frequency in ET.
Figure 6.

The coupling distribution of multiple oscillators dictates tremor characteristics. A, Expected frequency tolerance (black line) and simulation result (red line) of a single oscillator. By summing the effects of a mass of neural oscillators, each resonating at a slightly different frequency, we can reproduce both piecewise-linear (B) and simple linear (C) frequency tolerance profiles. For a uniformly distributed range of oscillator frequencies, the superposed frequency tolerance profile is piecewise-linear. For a normally distributed span of frequencies, the superposed frequency tolerance profile approaches a straight line with a shallow gradient.
Discussion
We adopted an integrated and data-driven approach to explore the fundamental properties of tremor in patients with PD and ET. Examination of the temporal dynamics of tremor, as measured by accelerometry while patients were off medication, combined with neuromodulation and modeling, allowed us to parse the mechanisms of tremorogenesis. In contrast to previous neurophysiological characterizations of tremor that have examined time-invariant measures, such as histogram-based statistics, we investigated how instantaneous tremor frequency evolves from cycle to cycle. This led to the concept of “frequency tolerance,” the range of frequencies over which the tremor may be considered stable. Importantly, frequency tolerance was independent of the mean frequency or SD of tremor, so that highly comparable frequency histograms could produce markedly different frequency tolerance profiles (Fig. 2). Rather, frequency tolerance was related to higher-order statistical properties that are themselves known to be strongly associated with dynamic behavior (Parra and Spence, 2001).
Frequency tolerance distinguishes parkinsonian tremor from ET
We found that the capacity of the tremorogenic elements of the brain to freely oscillate within well-defined tolerance regions is a distinguishing feature of tremor in PD compared with ET. In the present study, we showed that PD was associated with a broad range of stable frequencies, whereas ET displayed characteristics consistent with a more finely tuned oscillatory drive. This broad frequency tolerance suggests a system capable of maintaining several resonant frequencies. The distinction was demonstrated in two independent groups of subjects and further supported by strong classification performance. Classification might have been improved through the inclusion of additional predictors, such as peak tremor frequency, but our primary intention was to demonstrate a distinction between parkinsonian tremor and ET that is predominantly reflected in their derived frequency tolerances.
Critically, the different patterns of dynamic behavior evinced by frequency tolerance profiles could not be attributed to posture because patients with PD demonstrated the same broad frequency tolerance profiles in postural as in rest tremor. The reverse was also true, with a representative ET patient displaying the same zero frequency tolerance in the postural as in the rest condition. Although replication in a larger cohort is desirable, co-occurrence of rest and postural tremor, especially in ET, is uncommon (Cohen et al., 2003).
Frequency tolerance and multiple central tremor-related oscillators
Previous work has shown that tremors are poorly synchronized across (and even within) body parts (Raethjen et al., 2000; Ben-Pazi et al., 2001), leading to the suggestion that multiple neural oscillators coexist and are responsible for the central tremor drive (for review, see Brittain and Brown, 2013). Indeed, multiple distinct neural clusters displaying tremor-related activity have been observed in the ventrolateral thalamus in both ET and PD (Pedrosa et al., 2012). A similar organizational topography has also been reported in the subthalamic nucleus (Reck et al., 2009, 2010). These findings are interesting not only because they suggest that multiple and distributed clusters of neurons synchronized at tremor frequency form a general organizational principle of tremor, but also because they raise the intriguing possibility that multifocal nidi of synchronized neurones are, indeed, a physiological feature of the healthy motor network, exposed when different pathological triggers and task requirements drive exaggerated oscillatory synchronization and overflow to the periphery in the form of tremor.
Just how multiple neural oscillators could lead to the frequency tolerance profiles reported here was explored through neural modeling. These models suggest that the broad frequency tolerances that best described our PD cohort could be replicated by the superposition of multiple oscillators that are detuned (uncoupled) from one another, and hence do not possess a strong tendency to oscillate at a predetermined frequency. In contrast, the zero frequency tolerance typical of ET was reproduced by a population of multiple oscillators that are preferentially tuned toward some central frequency (adopting a narrow frequency range). Such tuning might arise if the population of oscillators were themselves partially synchronized by an internal driving force.
Of course, this schema is a gross simplification. In reality, the impact of a central tremorogenic drive will be modulated by brainstem and spinal reflexes, along with mechanical resonance, so that even descending tremor drives characterized by a broad frequency tolerance profile could be molded into the narrow tremor peaks typically observed in estimates of the power spectrum. The important thing here is that both peaks in tremor frequency and amplitude distributions should lie within the frequency tolerance region, even if the latter is reduced to a tiny range (as in linear fits). This was confirmed to be the case. Moreover, tremor amplitude experienced a drop-off in power as the instantaneous frequency shifted away from its central point. This observation suggests that tremors reside within specific resonance margins and that their peripheral manifestations diminish if and when the central drive is pushed beyond these margins. Indeed, this was recently supported by a study showing that the amplitude of rest tremor in PD remained unchanged despite spontaneous fluctuations in tremor frequency, whereas that of postural ET reduced as the tremor shifted away from its median frequency (Cagnan et al., 2014). This raises the intriguing possibility that extrinsic stimulation, delivered either by TACS or deep brain stimulation, could forcibly drive tremor outside of its tolerance zone and, in so doing, reduce tremor amplitude and resultant disability.
Tremor entrainment with stimulation over the cerebellum
Rhythmic noninvasive stimulation over cerebellum entrained tremor phase, with a strong relationship between baseline frequency tolerance and entrainment. Specifically, those patients with narrower frequency tolerances significantly entrained, whereas those possessing broad tolerances did not. Given the association between ET and narrow frequency tolerance ranges (and likewise the association between PD and broad frequency tolerance ranges), it is tempting to speculate that this distinction occurs because the cerebellum and associated circuitry are preferentially affected in ET, whereas the central drive to parkinsonian tremor may originate elsewhere (Helmich et al., 2013). In line with the hypothesized link between ET, narrow frequency tolerance, and tremor entrainment by cerebellar stimulation, it is known that well-coupled, synchronous populations of oscillators are more readily entrained than broadly tuned (uncoupled) systems (Kori and Mikhailov, 2006). Yet, we did fail to discriminate between parkinsonian tremors and ETs with cerebellar stimulation. This could be attributed to a combination of phenotypic variability, the modest size of the stimulation cohort, and the variable response of subjects to electrical stimulation protocols, suggesting the need for further studies of cerebellar entrainment in a larger patient cohort.
Another important consideration is whether the link between entrainment by cerebellar stimulation and tremor frequency tolerance profiles could be just the direct consequence of the fact that stimulation might have been “off-frequency” for a larger amount of time in patients with broad frequency tolerance compared with patients with a narrow frequency tolerance. However, the SD of frequency was matched between frequency tolerance groups and did not correlate with frequency tolerance. Rather, it correlated with higher-order parameters that likely reflect nonstationarity in the data.
Functionally, modification of the tremor rhythm by cerebellar stimulation suggests that cerebellar circuits play an important role in shaping tremor activity in those individuals whose tremor is best described as zero frequency tolerant. The lack of amplitude modulation mitigates against the possibility that stimulation drove spinal efferents, either directly or indirectly. Nevertheless, whether entrainment is a direct consequence of stimulation of the cerebellum or is mediated by cerebellar input into an essential second, but distant structure, is unclear. In particular, there is a disynaptic connection from the dentate nucleus of the cerebellum back to the striatum (Hoshi et al., 2005). Either way, we suggest that cerebello-thalamo-cortical pathways influence the pattern of tremor output, whereas other structures, such as the basal ganglia and motor cortex, may possibly have a greater influence over tremor amplitude (Helmich et al., 2013).
TACS is an emerging technique with the potential for selectively intervening with targeted brain rhythms (Thut et al., 2012). The aim is to entrain and presumably amplify endogenous brain activity (Fröhlich and McCormick, 2010; Ozen et al., 2010; Herrmann et al., 2013). Because tremor presents a strong peripheral correlate of central brain activity (Timmermann et al., 2003), we were able to assess the effects of TACS on the tremorgenic network. Indeed, we have previously examined the capacity of TACS to interact with the tremor rhythm by applying stimulation over sensorimotor cortex in a cohort of PD patients (Brittain et al., 2013). In that study, the amplitude of the peripheral tremor was modified, with further suppression attained by continually and selectively stimulating those tremor phases that were associated with suppression. Here, we extended this approach to explore the impact of rhythmic transcranial stimulation over another key region of the tremorogenic network, ipsilateral cerebellum. We have previously shown that TACS over the cerebellum entrains physiological tremor, in contrast to stimulation delivered over sensorimotor cortex (Mehta et al., 2014). Although we are unable to exclude that our effects were as a result of direct electrical stimulation of cerebellar outflow or other brainstem structures, we chose our stimulation montage to maximize the concentration of current density within the cerebellar hemispheres, as informed by contemporary current density models (Parazzini et al., 2014; Rahman et al., 2014).
In conclusion, TACS is a technique that has considerable potential to both elucidate network interactions and therapeutically regulate brain activity (Brittain et al., 2013). Here, we have demonstrated that rhythmic stimulation over cerebellum alters the timing of peripheral tremor, but not its amplitude. Further, we introduce a new metric, frequency tolerance, which captures cycle-by-cycle changes in tremor frequency. Frequency tolerance proved sensitive to pathology and predicted the degree of entrainment observed across our pathological tremor cohort. A simple and biofeasible schema of multiple central oscillators parsimoniously explains our empirical findings. Together, our findings demonstrate an organizational dissociation between tremor in PD and ET that may dictate how patients respond to empirical and, potentially, therapeutic interventions.
Footnotes
This work was supported by the Medical Research Council, Rosetrees Trust, and the National Institute for Health Research Oxford Biomedical Research Centre. The views expressed are those of the authors and not necessarily those of the NHS, the Department of Health or any funding bodies. The work was performed in the National Institute for Health Research Cognitive Health Clinical Research Facility, Oxford.
The authors declare no competing financial interests.
This is an Open Access article distributed under the terms of the Creative Commons Attribution License (http://creativecommons.org/licenses/by/3.0), which permits unrestricted use, distribution and reproduction in any medium provided that the original work is properly attributed.
References
- Bain PG, Findley LJ, Atchison P, Behari M, Vidailhet M, Gresty M, Rothwell JC, Thompson PD, Marsden CD. Assessing tremor severity. J Neurol Neurosurg Psychiatry. 1993;56:868–873. doi: 10.1136/jnnp.56.8.868. [DOI] [PMC free article] [PubMed] [Google Scholar]
- Benabid AL, Pollak P, Gervason C, Hoffmann D, Gao DM, Hommel M, Perret JE, de Rougemont J. Long-term suppression of tremor by chronic stimulation of the ventral intermediate thalamic nucleus. Lancet. 1991;337:403–406. doi: 10.1016/0140-6736(91)91175-T. [DOI] [PubMed] [Google Scholar]
- Ben-Pazi H, Bergman H, Goldberg JA, Giladi N, Hansel D, Reches A, Simon ES. Synchrony of rest tremor in multiple limbs in Parkinson's disease: evidence for multiple oscillators. J Neural Transm. 2001;108:287–296. doi: 10.1007/s007020170074. [DOI] [PubMed] [Google Scholar]
- Brittain JS, Brown P. The many roads to tremor. Exp Neurol. 2013;250:104–107. doi: 10.1016/j.expneurol.2013.09.012. [DOI] [PubMed] [Google Scholar]
- Brittain JS, Probert-Smith P, Aziz TZ, Brown P. Tremor suppression by rhythmic transcranial current stimulation. Curr Biol. 2013;23:436–440. doi: 10.1016/j.cub.2013.01.068. [DOI] [PMC free article] [PubMed] [Google Scholar]
- Bucher SF, Seelos KC, Dodel RC, Reiser M, Oertel WH. Activation mapping in essential tremor with functional magnetic resonance imaging. Ann Neurol. 1997;41:32–40. doi: 10.1002/ana.410410108. [DOI] [PubMed] [Google Scholar]
- Burnham KP, Anderson DR. Model selection and multimodel inference: a practical information-theoretic approach. New York: Springer; 2002. [Google Scholar]
- Cagnan H, Little S, Foltynie T, Limousin P, Zrinzo L, Hariz M, Cheeran B, Fitzgerald J, Green AL, Aziz T, Brown P. The nature of tremor circuits in parkinsonian and essential tremor. Brain. 2014;137:3223–3234. doi: 10.1093/brain/awu250. [DOI] [PMC free article] [PubMed] [Google Scholar]
- Cohen J. A coefficient of agreement for nominal scales. Educ Psychol Meas. 1960;20:37–46. doi: 10.1177/001316446002000104. [DOI] [Google Scholar]
- Cohen O, Pullman S, Jurewicz E, Watner D, Louis ED. Rest tremor in patients with essential tremor: prevalence, clinical correlates, and electrophysiologic characteristics. Arch Neurol. 2003;60:405–410. doi: 10.1001/archneur.60.3.405. [DOI] [PubMed] [Google Scholar]
- Deuschl G, Bain P, Brin M. Consensus statement of the Movement Disorder Society on Tremor: Ad Hoc Scientific Committee. Mov Disord. 1998;13(Suppl 3):2–23. doi: 10.1002/mds.870131303. [DOI] [PubMed] [Google Scholar]
- Elble RJ. Central mechanisms of tremor. J Clin Neurophysiol. 1996;13:133–144. doi: 10.1097/00004691-199603000-00004. [DOI] [PubMed] [Google Scholar]
- Elble RJ, Pullman SL, Matsumoto JY, Raethjen J, Deuschl G, Tintner R. Tremor amplitude is logarithmically related to 4- and 5-point tremor rating scales. Brain. 2006;129:2660–2666. doi: 10.1093/brain/awl190. [DOI] [PubMed] [Google Scholar]
- Fröhlich F, McCormick DA. Endogenous electric fields may guide neocortical network activity. Neuron. 2010;67:129–143. doi: 10.1016/j.neuron.2010.06.005. [DOI] [PMC free article] [PubMed] [Google Scholar]
- Gao JB. Analysis of amplitude and frequency variations of essential and parkinsonian tremors. Med Biol Eng Comput. 2004;42:345–349. doi: 10.1007/BF02344710. [DOI] [PubMed] [Google Scholar]
- Hallett M, Deuschl G. Are we making progress in the understanding of tremor in Parkinson's disease? Ann Neurol. 2010;68:780–781. doi: 10.1002/ana.22253. [DOI] [PMC free article] [PubMed] [Google Scholar]
- Helmich RC, Toni I, Deuschl G, Bloem BR. The pathophysiology of essential tremor and Parkinson's tremor. Curr Neurrol Neurosci Rep. 2013;13:378. doi: 10.1007/s11910-013-0378-8. [DOI] [PubMed] [Google Scholar]
- Herrmann CS, Rach S, Neuling T, Strüber D. Transcranial alternating current stimulation: a review of the underlying mechanisms and modulation of cognitive processes. Front Hum Neurosci. 2013;7:279. doi: 10.3389/fnhum.2013.00279. [DOI] [PMC free article] [PubMed] [Google Scholar]
- Hoshi E, Tremblay L, Féger J, Carras PL, Strick PL. The cerebellum communicates with the basal ganglia. Nat Neurosci. 2005;8:1491–1493. doi: 10.1038/nn1544. [DOI] [PubMed] [Google Scholar]
- Hughes AJ, Ben-Shlomo Y, Daniel SE, Lees AJ. What features improve the accuracy of clinical diagnosis in Parkinson's disease: a clinicopathologic study. Neurology. 1992;42:1142–1146. doi: 10.1212/WNL.42.6.1142. [DOI] [PubMed] [Google Scholar]
- Jankovic J, Tolosa E. Parkinson's disease and movement disorders. Philadelphia: Lippincott Williams & Wilkins; 2007. [Google Scholar]
- Kori H, Mikhailov AS. Strong effects of network architecture in the entrainment of coupled oscillator systems. Phys Rev E Stat Nonlin Soft Matter Phys. 2006;74 doi: 10.1103/PhysRevE.74.066115. 066115. [DOI] [PubMed] [Google Scholar]
- Marple SL. Computing the discrete-time analytic signal via FFT. IEEE Trans Signal Processing. 1999;47:2600–2603. doi: 10.1109/78.782222. [DOI] [Google Scholar]
- McAuley JH, Marsden CD. Physiological and pathological tremors and rhythmic motor control. Brain. 2000;123:1545–1567. doi: 10.1093/brain/123.8.1545. [DOI] [PubMed] [Google Scholar]
- Mehta AR, Brittain JS, Brown P. The selective influence of rhythmic cortical versus cerebellar transcranial stimulation on human physiological tremor. J Neurosci. 2014;34:7501–7508. doi: 10.1523/JNEUROSCI.0510-14.2014. [DOI] [PMC free article] [PubMed] [Google Scholar]
- Muthuraman M, Heute U, Arning K, Anwar AR, Elble R, Deuschl G, Raethjen J. Oscillating central motor networks in pathological tremors and voluntary movements: what makes the difference? Neuroimage. 2012;60:1331–1339. doi: 10.1016/j.neuroimage.2012.01.088. [DOI] [PubMed] [Google Scholar]
- Ohye C, Hirai T, Miyazaki M, Shibazaki T, Nakajima H. Vim thalamotomy for the treatment of various kinds of tremor. Appl Neurophysiol. 1982;45:275–280. doi: 10.1159/000101611. [DOI] [PubMed] [Google Scholar]
- O'Suilleabhain PE, Matsumoto JY. Time-frequency analysis of tremors. Brain. 1998;121:2127–2134. doi: 10.1093/brain/121.11.2127. [DOI] [PubMed] [Google Scholar]
- Ozen S, Sirota A, Belluscio MA, Anastassiou CA, Stark E, Koch C, Buzsáki G. Transcranial electric stimulation entrains cortical neuronal populations in rats. J Neurosci. 2010;30:11476–11485. doi: 10.1523/JNEUROSCI.5252-09.2010. [DOI] [PMC free article] [PubMed] [Google Scholar]
- Parazzini M, Rossi E, Ferrucci R, Liorni I, Priori A, Ravazzani P. Modelling the electric field and the current density generated by cerebellar transcranial DC stimulation in humans. Clin Neurophysiol. 2014;125:577–584. doi: 10.1016/j.clinph.2013.09.039. [DOI] [PubMed] [Google Scholar]
- Parra LC, Spence CD. Independent component analysis: principles and practice. Cambridge University: Cambridge UP; 2001. Separation of non-stationary natural signals; pp. 135–157. [Google Scholar]
- Pedrosa DJ, Reck C, Florin E, Pauls KA, Maarouf M, Wojtecki L, Dafsari HS, Sturm V, Schnitzler A, Fink GR, Timmermann L. Essential tremor and tremor in Parkinson's disease are associated with distinct ‘tremor clusters’ in the ventral thalamus. Exp Neurol. 2012;237:435–443. doi: 10.1016/j.expneurol.2012.07.002. [DOI] [PubMed] [Google Scholar]
- Raethjen J, Lindemann M, Schmaljohann H, Wenzelburger R, Pfister G, Deuschl G. Multiple oscillators are causing parkinsonian and essential tremor. Mov Disord. 2000;15:84–94. doi: 10.1002/1531-8257(200001)15:1<84::AID-MDS1014>3.0.CO%3B2-K. [DOI] [PubMed] [Google Scholar]
- Rahman A, Toshev PK, Bikson M. Polarizing cerebellar neurons with transcranial direct current stimulation. Clin Neurophysiol. 2014;125:435–438. doi: 10.1016/j.clinph.2013.10.003. [DOI] [PubMed] [Google Scholar]
- Reck C, Florin E, Wojtecki L, Krause H, Groiss S, Voges J, Maarouf M, Sturm V, Schnitzler A, Timmermann L. Characterisation of tremor-associated local field potentials in the subthalamic nucleus in Parkinson's disease. Eur J Neurosci. 2009;29:599–612. doi: 10.1111/j.1460-9568.2008.06597.x. [DOI] [PubMed] [Google Scholar]
- Reck C, Himmel M, Florin E, Maarouf M, Sturm V, Wojtecki L, Schnitzler A, Fink GR, Timmermann L. Coherence analysis of local field potentials in the subthalamic nucleus: differences in parkinsonian rest and postural tremor. Eur J Neurosci. 2010;32:1202–1214. doi: 10.1111/j.1460-9568.2010.07362.x. [DOI] [PubMed] [Google Scholar]
- Schnitzler A, Gross J. Normal and pathological oscillatory communication in the brain. Nat Rev Neurosci. 2005;6:285–296. doi: 10.1038/nrn1650. [DOI] [PubMed] [Google Scholar]
- Thut G, Miniussi C, Gross J. The functional importance of rhythmic activity in the brain. Curr Biol. 2012;22:R658–R663. doi: 10.1016/j.cub.2012.06.061. [DOI] [PubMed] [Google Scholar]
- Timmermann L, Gross J, Dirks M, Volkmann J, Freund HJ, Schnitzler A. The cerebral oscillatory network of parkinsonian resting tremor. Brain. 2003;126:199–212. doi: 10.1093/brain/awg022. [DOI] [PubMed] [Google Scholar]
- Ugawa Y, Uesaka Y, Terao Y, Hanajima R, Kanazawa I. Magnetic stimulation over the cerebellum in humans. Ann Neurol. 1995;37:703–713. doi: 10.1002/ana.410370603. [DOI] [PubMed] [Google Scholar]
- Wenning GK, Kiechl S, Seppi K, Müller J, Högl B, Saletu M, Rungger G, Gasperi A, Willeit J, Poewe W. Prevalence of movement disorders in men and women aged 50–89 years (Bruneck Study cohort): a population-based study. Lancet Neurol. 2005;4:815–820. doi: 10.1016/S1474-4422(05)70226-X. [DOI] [PubMed] [Google Scholar]
- Zweig MH, Campbell G. Receiver-operating characteristic (ROC) plots: a fundamental evaluation tool in clinical medicine. Clin Chem. 1993;39:561–577. [PubMed] [Google Scholar]