Abstract
Safety problem is always a big obstacle for lithium battery marching to large scale application. However, the knowledge on the battery combustion behavior is limited. To investigate the combustion behavior of large scale lithium battery, three 50 Ah Li(NixCoyMnz)O2/Li4Ti5O12 batteries under different state of charge (SOC) were heated to fire. The flame size variation is depicted to analyze the combustion behavior directly. The mass loss rate, temperature and heat release rate are used to analyze the combustion behavior in reaction way deeply. Based on the phenomenon, the combustion process is divided into three basic stages, even more complicated at higher SOC with sudden smoke flow ejected. The reason is that a phase change occurs in Li(NixCoyMnz)O2 material from layer structure to spinel structure. The critical temperatures of ignition are at 112–121°C on anode tab and 139 to 147°C on upper surface for all cells. But the heating time and combustion time become shorter with the ascending of SOC. The results indicate that the battery fire hazard increases with the SOC. It is analyzed that the internal short and the Li+ distribution are the main causes that lead to the difference.
Lithium ion battery (LIB) is widely used in various electronic equipment, electric vehicles and energy storage1. It transports Li+ from one electrode material to another to reserve and provide electric energy. Electric energy and chemical energy convert by each other during charge and discharge, which escape the limitation of Carnot cycle in second law of thermodynamics to get higher energy conversion efficiency than heat engine2. Because the lithium ion battery contain considerable active electrodes and flammable electrolyte, thus heat is generated in the cell under abnormal conditions such as over-charging or internal short circuit, which can result in dangerous thermal runaway reactions in the worst case3,4,5. Many thermal runaway caused battery accidents occurred in recent year, such as the fire of 787 Poeing dreamline batteries, fire of Tesla Model S electrical car in 20136,7. This makes the safety problem still be an obstacle for marching the large scale application of lithium battery.
Many works have been done on the mechanism of battery thermal runaway. It is thought that when the battery temperature exceeds a certain value, series of reactions would occur successively. Normally, the battery undergoes the following reactions: breakdown of solid-electrolyte interphase for carbon based anode, melting of separator, reaction between the negative material and electrolyte, decomposition of electrolyte, reaction between positive material and electrolyte, etc8,9. These reactions not react in an exact order but occur mutual promotion among them. An elegant way to visualize thermal runaway reactions was proposed in our previous study5 by using Semenov theory. The whole battery is considered as a separated system. If the heat generated by exothermic chemical reactions is more than that can be dissipated, it accelerates the increase of temperature, and the temperature would promote the reactions in return, which make LIB occur self-accelerate reaction at an elevated temperature and lead to thermal runaway in result4,5,9.
Safety performance is related to many factors, such as state of charge, capacity, fabrication of battery, cathode and anode materials, electrolyte, etc. Jhu et al.10 investigated the thermal abuse of the 18650 lithium ion batteries with LiCoO2 cathodes by using VSP2, and found that the charged batteries were more hazardous than uncharged ones. The cathode materials in the Li-ion batteries, such as LiCoO2, LiNiO2, LiMn2O4 (LMO), LiFePO4, Li(NixCoyMnz)O2 (NCM), are thermal unstable to induce autocatalytic reaction with the electrolytes and generate oxygen at elevated temperature11. Jiang and Dahn12 showed that ethylene carbonate (EC), diethyl carbonate (DEC) in organic solvents can react with Li0.5CoO2 at 130°C, which is lower than the decomposition temperature of Li0.5CoO2. LiNiO2 also has a poor thermal stability. Ohzuku et al.13 have reported that Li0.15NiO2 undergoes an exothermic reaction at about 200°C. Zhang et al.14 compared LiCoO2 with LiMn2O4, and the result shows that the latter has better thermal tolerance. LiFePO4 has good thermal tolerance for no heat is produced in reactivity with electrolytes below 200°C9. NCM shows good performance on thermal tolerance as LiFePO4. Jhu et al.11 compared two cathode materials and found that the thermal explosions of LiCoO2 and NCM cathodes at 180 and 250°C, which explain NCM material act as a new cathode material with high safety performance. For anode materials, Li4Ti5O12 (LTO) has excellent cycle performance and stable operating voltage. It shows more thermal abuse tolerance than graphite based on differential scanning calorimetry (DSC) and gases generation analysis, which makes Li4Ti5O12 to be very promising anode material for large scale Li-ion battery15,16.
Thermal analysis is widely used to analyze safety performance for Li-ion batteries. Traditional test methods contains oven test, short-circuit test, overcharge test, nail test and crush test8. But the large scale Li-ion batteries such as electric vehicle (EV), hybrid electric vehicle (HEV) and energy storage system contain tens and even hundreds of batteries5. Flame and heat radiation became the main ways that induce the fire spread between batteries. Once one of them occur thermal runaway, surrounding cells will suffer strong heating effect directly to induce further reaction. Continual combustion or explosion and toxic gases generation will threaten the safety of whole battery storage system. Therefore, foreknowing the combustion behavior is necessary to provide safety guide for both improvement of lithium ion batteries and large scale use. Harris et al.17 investigated the thermochemical and combustion properties of electrolyte and flammable gases that determine whether they ignite and how energetically they burn. They found that combustion enthalpy and vaporization enthalpy is important to determine the flammability of carbonate solvents. FM Global18 evaluated the hazard posed by bulk stage of LIB in warehouse scenarios. They studied the flammability of batteries storage in two series, small-format and large-scale rack storage, and proposed the best protection recommendations. In this work, the 50 Ah Li(NixCoyMnz)O2/LTO battery, one of the most safe composition scheme for large scale battery19, was selected to experimentally study the combustion behavior and fire hazards. The dynamical parameters include mass loss, temperature of surface and flame region and heat release rate were obtained to characterize the combustion behavior of lithium titanate battery. The fire hazards under different states of charge (SOC) were compared further.
Results
Combustion behavior
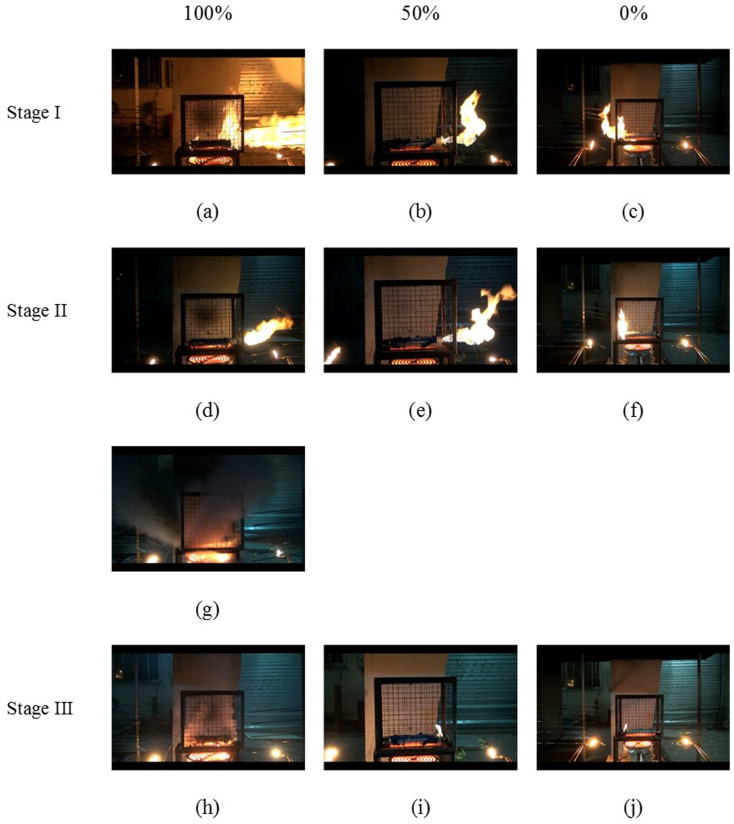
In this work, the cells were heated to fire by an electric heater. The combustion processes are shown in Figure 1. From the Figure 1, it can be seen that at different states, the lithium ion battery shows the similar combustion behavior, however, there are some differences as well. The combustion behavior can be divided into igniting, stable combusting and extinguishing stages.
Figure 1. Combustion behaviors of 0%, 50% and 100% SOC batteries.
(a), (d), (g) and (h) are combustion behaviors of 100% SOC battery; (b), (e) and (i) are combustion behaviors of 50% SOC battery; (c), (f) and (j) are combustion behaviors of 0% SOC battery.
Stage I (igniting): Three batteries were heated for a period of time in this stage. For the aluminum shell with 1.44mm thickness, the battery did not expanded in this stage. After 4629s, 3900s and 1465s of heating for 0%, 50% and 100% SOC battery, respectively, the pressure-limiting valve ruptured and gases rushed out from it. The flammable gases were ignited by the high temperature on electric heater and formed a jet fire as shown in Figure 1(a), 1(b), 1(c). For the active of electric materials and organic electrolyte, some chemical reactions occurred in the inner. According to the researches of Kim et al.20, in this stage, as the temperature ascending, the battery experience series of exothermic reactions. Lithium atoms react with the organic solvent in electrolyte and release abundant alkane olefin gases like C2H4, C3H6, C2H6. Gachot et al.21 proposed a general electrolyte degradation scheme in the 100–250°C temperature range. The production can be sorted in five families, i.e. esters, hydrocarbons, ethers, carbonates and alcohols. Besides, flammable electrolyte could be vaporized by the high temperature. Then, the inner pressure increased by the producing of gases (include electrolyte evaporation), when it exceeds the threshold value, gases will be ejected from the safety valve and ignited by high temperature after completely mix with air as shown in Figure 1(a) to Figure 1(c). Comparing three batteries combustion behavior, the one with higher state of charge (SOC) has a longer combustion flame after ruptured and ignited. Furthermore, with the higher SOC, the time needed to rupture and ignite is declining, which indicates the degree and velocity of inner reactions are depending on the SOC directly.
Stage II (stable combusting): Figure 1(d) to Figure 1(f) shows that the length of flame becomes shorter but the height gets higher than that of stage I. In this stage, the battery combustion becomes stable and flame range changes slowly. This phenomenon kept for about 720 s (0% SOC) and 300 s (50% SOC). It indicates that the gas generation reactions in this stage are approaching to stable. Figure 1(g) shows two jet flows mixed black and white smoke ejected from both cathode and anode safety valve. This special phenomenon occurred after 540 s of the stably combusting and only appeared in the 100% SOC battery combustion. Strong reactions occurred at this time inner the full charged battery, which led to the combustion of 100% SOC battery became more complicated and difficult to be predicted, which was discussed in detail in the discussion section.
Stage III (extinguishing): The flame region was reduced gradually and extinguished at the end as shown in Figure 1(i) and 1(j). In this stage, the reaction between electrolyte and electrode materials is weakened as the residual quantity of electrolyte is decreased. The combustion times are about 2160 s and 790 s for 0% SOC and 50% SOC cells respectively. For the 100% SOC cell, it was extinguished with the ejection of the strong smoke flow at 1990 s.
Mass loss ratio
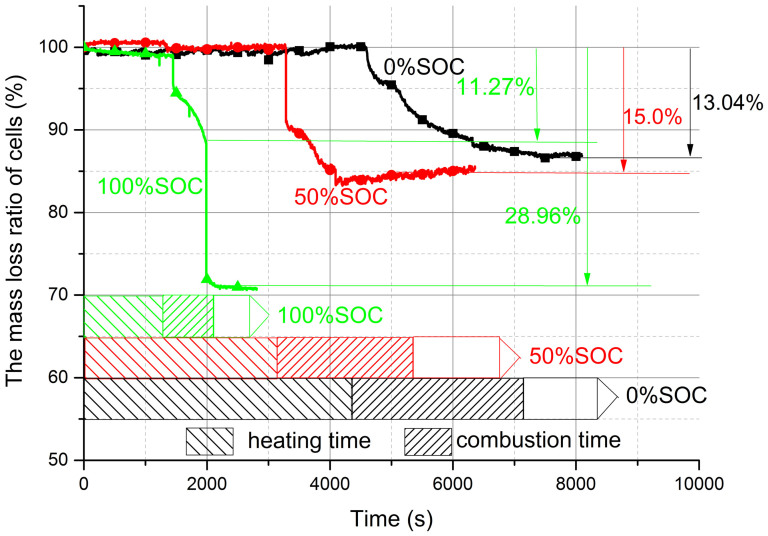
Figure 2 shows that the full discharged cell (0% SOC) was heated and burned for a longer time than that of the full charged cell (100% SOC), the heating time of two cells are 4560 s and 1440 s, and the burning time are 2820 s and 600 s, respectively. The time used for the half charged cell (50% SOC) is between that of them. The first turning points of the three curves present the ignition moment, and the slope of mass loss curves reflect the combustion degree of three batteries. It can be seen that the full charged battery combusted more violently than the others. There is 1.94% (about 35 g) difference between 50% and 0% SOC battery mass loss, which indicates that the batteries experienced the similar combustion processes and the combustible ratio is similar. But for the full charged cell, it lost more mass than that of the half charged and discharged cells. Except the similar combustion phenomenon, white and black smoke flows were ejected strongly from the anode or cathode valves and blew off the jet fire at 1988 s (lost 17.69% of battery's mass). At this temperature (over 300°C), the anode and cathode materials is stripped from aluminum and copper film. And then the major composition of the black smoke flow is anode and cathode materials. Therefore, for the full charged battery, the total mass loss is not means it combusted more sufficiently than other cells.
Figure 2. Mass loss ratio of batteries in 0%, 50% and 100% SOC during combustion.
0% SOC and 50% SOC battery combusted 13.04% and 15% of total mass, 100% SOC battery occurred two jet fires and lost 28.96% of mass.
Cell surface and flame temperatures
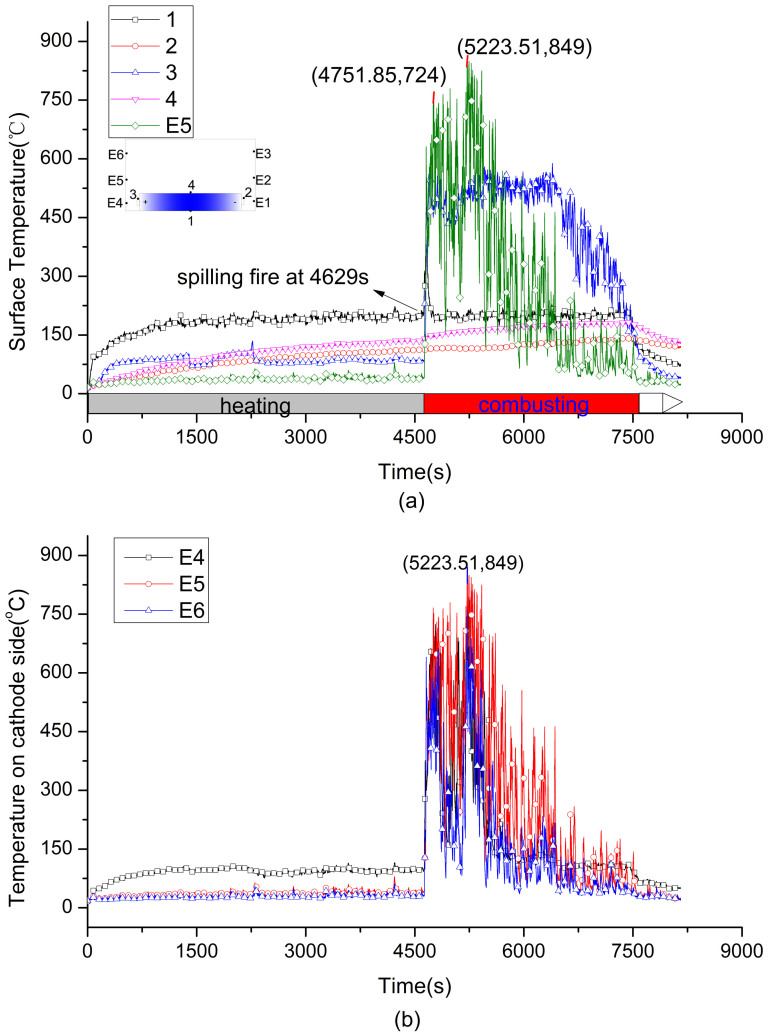
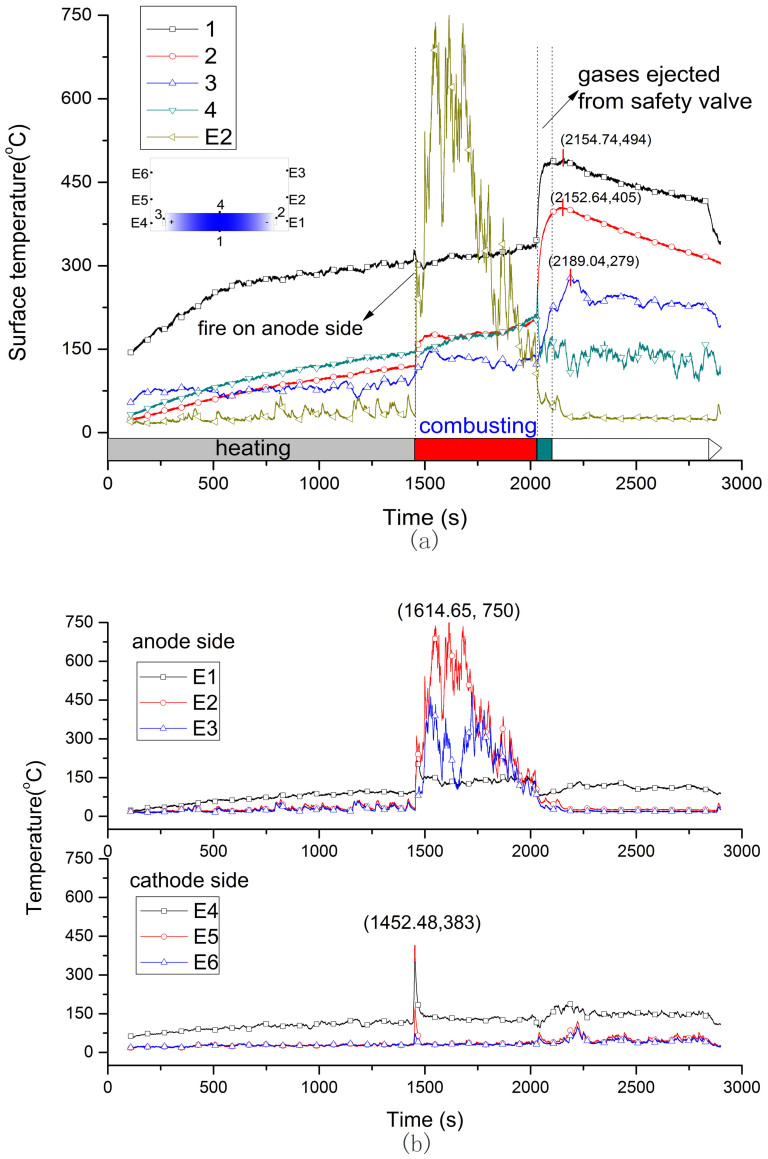
Four thermocouples were set on the surface and six thermocouples were set beside the electrodes to detect the surface and flame temperature as shown in Figure 3. The nonuniform reactions in the battery may influence the distribution of surface temperature. The variation of surface and flame temperatures during combustion was analyzed in the following to discover the rules of occurring and developing of battery fire.
Figure 3. Surface and flame temperature curve of 0% SOC battery during the whole progress.
(a) is the surface temperature, (b) is the flame temperature.
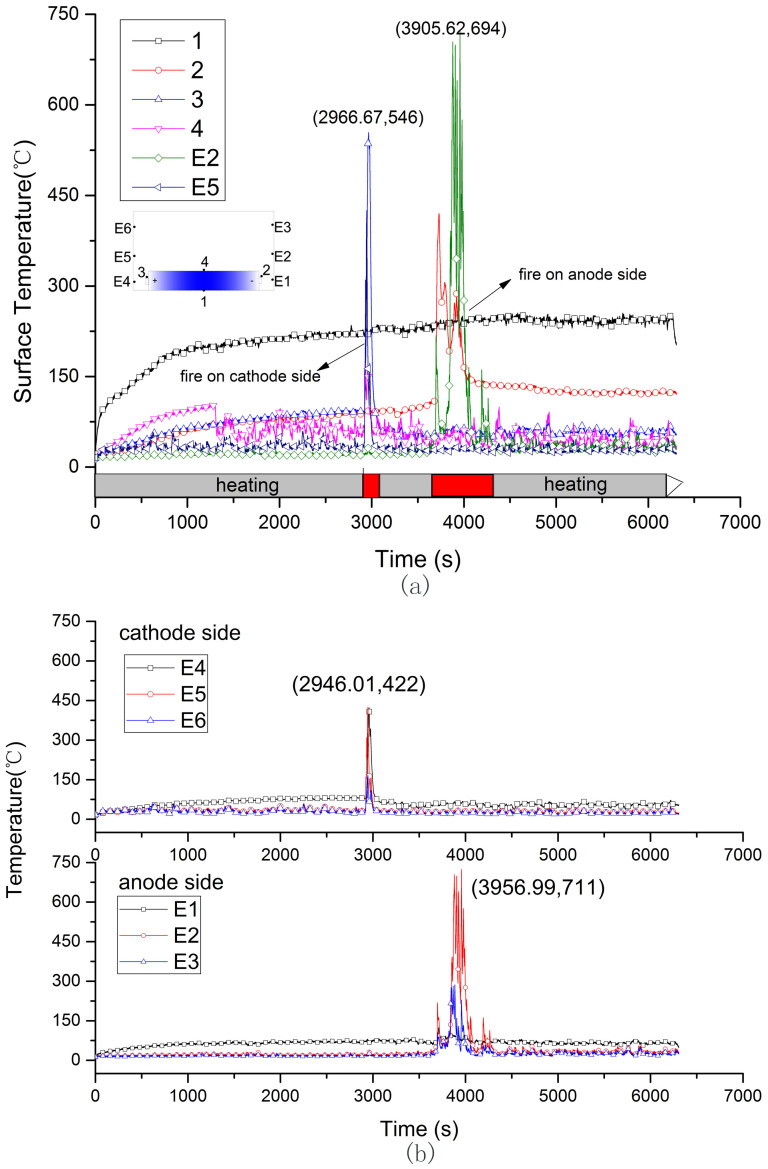
The temperatures at cathode tap, upper surface, bottom surface and anode tap don't show same pace of change. Figure 3(a), Figure 4(a) and Figure 5(a) show the surface temperatures history of 0%, 50% and 100% SOC battery, respectively. In the heating stage, the bottom temperature rose rapidly due to the direct heat radiation and soon stabilized at a certain temperature range as the absorption and emission of heat get into balance. Comparing with the temperatures at cathode and anode tab, the upper surface temperature ascended faster and kept at a stable value after battery was ignited. The surface temperature distribution at ignition was shown in Figure 3(a), Figure 4(a) and Figure 5(a). It is interesting to find that the critical temperatures at anode tab and upper surface of three cells are very close to each other's, at about 112 to 121°C and 139 to 147°C, respectively. The upper surface temperature can direct reflect the inner reactions of the cell because the temperature rising is only caused by the heat conduction from the inner to the surface. In the combustion stage, drastic reactions inner battery lead to surface temperature rose faster than that of in heating stage. For 0% SOC battery, the highest temperature at bottom surface was 234°C at 7320 s, at the upper surface was 183°C at 7444 s, and at the anode tab was 143°C at 7479 s. For 50% SOC battery, the temperature curves of TC3 and TC E5 in Figure 4 (a) show a sharp increase at 49 mins 26 s (2966 s). It was the cathode flame temperature from the combustion of plastic package. The temperatures sudden termination of TC3 and TC4 are due to the thermocouples on half charged cell dropt from the surface by the melting of plastic package. But anode thermocouple still can record the surface temperature. For 100% SOC battery, the surface temperature shows a sharp increase from 2027 s to 2101 s, which is different with that of the 0% SOC and 50% SOC cells. In this period, the surface temperature tested by TC1, TC2, TC3 increased to 163°C, 208°C and 151°C in 3 mins. In this period, the battery fire was distinguished by a strong smoke flow ejected from the safety valve. This ejection kept about 20 s, and the battery lost 300 g mass in this segment as Figure 2 shows. The intensified reactions were occurred inner the 100% SOC battery at this moment and generated large amounts of heat with abundant gases. If the gases were not ejected from the safety valve timely, the giant gases will increase the inner pressure suddenly and possibly lead to explosion.
Figure 4. Surface and flame temperature curve of 50%SOC battery during the whole progress.
(a) is the surface temperature, (b) is the flame temperature.
Figure 5. Surface and flame temperature curve of 100%SOC battery.
(a) is the surface temperature, (b) is the flame temperature.
Figure 3(b), Figure 4(b) and Figure 5(b) show flame temperature of the three batteries. For 0% SOC battery, TC E5 (100 mm above E4) detected a higher temperature of flame than other thermocouples at cathode side and the highest temperature is 849°C at 87 mins 3 s (5223.51 s). For 50% and 100% SOC battery, TC E2 (100 mm above E1) detected a higher temperature than the other two at the anode side, and the highest flame temperature is 711°C and 750°C for two cells respectively. In summary, the temperature of flame is between 700 and 900°C, and the flame center is in about 100 mm above safety valve.
Width and height of flame
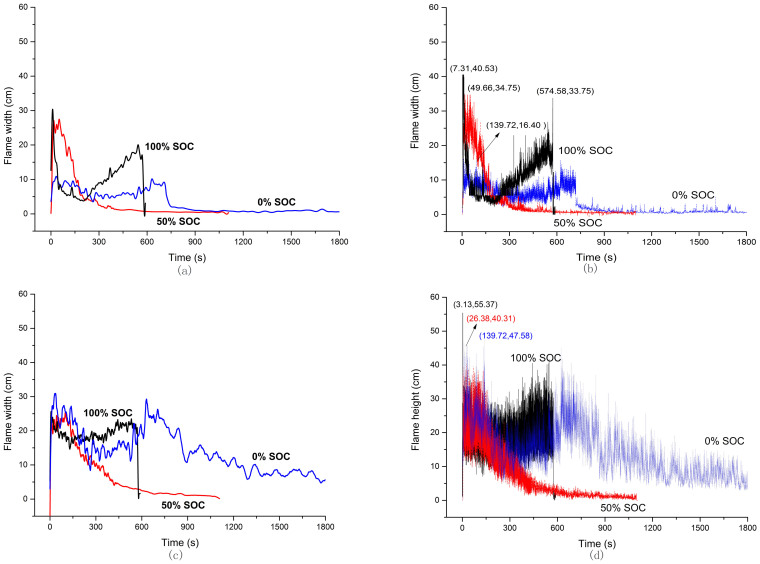
The flammable gases ejected from pressure-limiting valve, air and high temperature form the three basic elements of a fire. The flame entrains the surrounding air successively to supply the oxidant and is influenced by the vertical buoyancy, which leads to the distortion and vibration of flame. The horizontal distance between the margin of flame and the safety valve is defined as the width, and the vertical distance between the top point of flame and the safety valve is defined as the height. According to the fire plume theory, fire plume can be divided into three zones: continuous flame zone, intermittent flame zone and far field zone22. This theory is used to analysis the battery fire here. In the intermittent zone, flame height vibrated fast in the range of 0-555.7 mm as shown in Figure 6(b) and 6(d). So the average values of the adjacent flames were regarded as the height of flame. Flame width is related with the flow rate of gases jetting from the safety valve. It can be found that fire width of three batteries are different in Figure 6(a) and Figure 6(b). Figure 6(a) shows 0% SOC battery has a relative small and stable flame width, and its average fire width is about 100 mm in 750 s. When 50% SOC battery gets on fire, the fire width attends to 270 mm at first and then drops slowly until extinguish. The fully discharged battery combusts more stably and the flame is smaller than that of half charged battery. The fire width of 100% SOC battery attends to 300 mm initially, which is considered as the combustion of electrolyte evaporation according to the video record. It then declines to 50 mm and ascends to 199 mm again. Flammable gases like alkane gases were generated and combusted in this progress, and battery went to thermal runaway at the end.
Figure 6. Flame width and height of 0% SOC, 50% SOC and 100% SOC cells.
(b) and (d) are the actual calculated value of three cells flame width and height from the video. (a) and (c) are further processing from (b) and (d).
Discussion
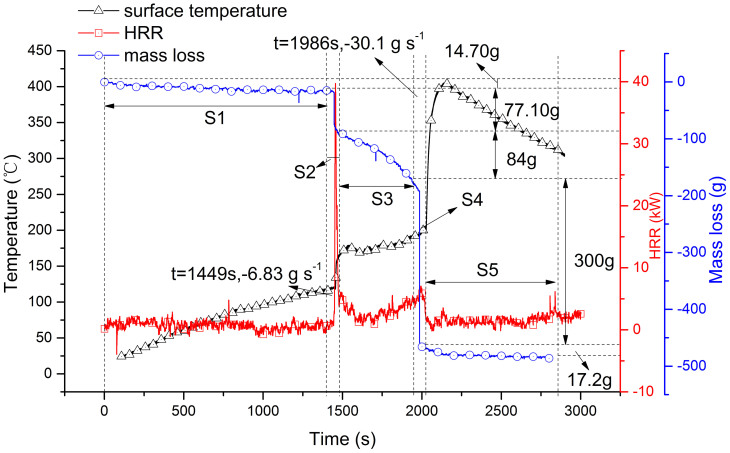
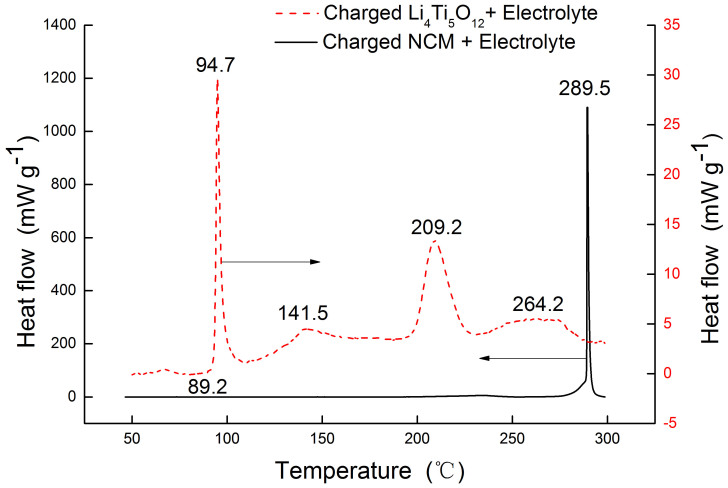
The combustion behaviors of three batteries are listed in Table 1. It can be seen that the state of charge is a critical factor for battery combustion. Compare to discharge and half-charged cells, the full charged cell is the most hazardous and has a potential threat for the safety. It is necessary to analysis the combustion characteristic for full charged cell in detail. Figure 7 shows detailed information of combustion characteristic of full charged cell. The whole combustion behavior can be divided into 5 segments (S1, S2, S3, S4 and S5). Two peaks of heat release rate appear in segment S2 and S4. Segment S2 is corresponding to the stage I in the combustion process. In this segment, heat release rate increases from zero to peak point, 39.7 kW at 1456 s, when the ejected gases were ignited by the high temperature from electric heater. Then the jet fire turned to a stable process in S3. In this stable combustion segment, from the mass loss it can be seen that mass loss rate experienced a slightly rise and decline, and the average value is 0.192 g s−1. But the combustion gets stronger again at 1986 s in S4. In this segment, the heat release rate attends to the second peak point (6.0 kW) and the surface temperature rose to 205°C. And several seconds later the second sharp drop of mass was observed with the mass loss rate of −30.1 g s−1. The surface temperature increased from 198°C to the peak value of 405°C. In our previous studies23, the thermal stability of Li4Ti5O12 and Li(Ni1/3Co1/3Mn1/3)O2 were analyzed by C80 micro calorimetry as shown in Figure 8. The charged NCM (Li+ deintercalation) coexist with electrolyte (contain EC, DEC, DMC) have two exothermic process23. The first one starts from 193°C and reaches the peak at 232.7°C with the heat generation of −44.6 J g−1. The second one is from 270.1°C and reaches peak at 289.5°C with the heat generation of −481.4 J g−1. The Li4Ti5O12 coexist with electrolyte have four exothermic processes, and the temperature peaks are 94.7°C, 141.5°C, 209.2°C and 264.2°C with the total heat generation of −291.5 J g−1. It indicates that the sudden increase of temperature in S4 segment may be induced by the violently reaction of NCM material. Lin et al24 investigated the decomposition of a delithiated high energy cathode material of Li1.2-xNi0.15Mn0.55Co0.1O2. It was found that the layer structure for the delithiated cathode material with no electrolyte was changed to a disordered Li1-xM2O4-type spinel at 266°C, and when organic solvent and LiPF6 were present, the onset temperature of the decomposition was dropped to 249°C with the formation of MnF2 phase. Nam et al.25 studied the structural change of NCM in contact with electrolyte based on LiPF6 by the time-resolved XRD (TR-XRD). It was found that the Li0.33Ni1/3Co1/3Mn1/3O2 cathode sample with electrolyte, a layered structure, changed first to a LiM2O4-type spinel from 236 to 350°C and then to a M3O4-type spinel from 350 to 441°C, with additional phase transition from M3O4-type spinel to the MO-type rock salt phase from 400 to 441°C. This was identified by Roder26, and the following overall decomposition reaction was proposed:
 |
And the released oxygen combusts with EC and DEC:
 |
 |
Table 1. The summary of three 50 Ah LTO batteries combustion behavior.
| State of charge | 0% SOC | 50% SOC | 100% SOC |
|---|---|---|---|
| Ignition time, s | 4629 | 3900 | 1465 |
| Combustion time, s | 2880 | 1093 | 568 |
| Jet fire times | 0 | 1 | 2 |
| Ignition position | cathode | anode | anode |
| Anode temperature at ignition, °C | 112 | 119 | 121 |
| Temperature rise rate at heating stage on anode electrode, °C s−1 | 0.021 | 0.027 | 0.07 |
| Upper surface temperature at ignition, °C | 141 | – | 146.6 |
| Bottom surface temperature at ignition, °C | 212 | 238 | 323 |
| Maximum flame temperature, °C | 837.3 | 723.1 | 747 |
| Total mass loss, g | 215 | 239 | 480 |
| Total mass loss percentage, % | 13.04 | 14.67 | 28.96 |
| Maximum mass loss rate, g s−1 | 1.5 | 15.5 | 30.1 |
| Mean mass loss rate, g s−1 | 3.583 | 3.983 | 8 |
| Maximum flame width, mm | 109 | 275 | 304 |
| Maximum flame height, mm | 309 | 254 | 257 |
Notes: 1. The combustion time of 0% SOC battery is hard to be confirmed for the battery fire at the end is rather weak but last for a long time.
2. The 0% SOC battery combusted stably, no such jet fire ejected as 50% and 100% SOC batteries did.
3. The package combustion is not included.
Figure 7. Surface temperature, mass loss rate and heat release rate of 100% SOC LTO cell when heated an electric heater.
S1, S2, S3, S4, S5 represent 5 segments of battery combustion through the obvious difference in variation of mass during the total experiment.
Figure 8. The heat flows of charged electrodes coexist with electrolyte23.
Based on these results, it can be speculated that the sudden increase of surface temperature in S4 segment was induced by the second exothermal reaction of NCM material. Large quantities of heat (mainly produced by NCM decomposition) enhance the whole battery temperature and decline the adhesion of the active materials to the current collector film and then cause them dropped from the film. At last, the gases generated by the reaction of NCM with electrolyte and the dropped electrode materials mixed together and ejected from the battery to form a strong smoke flow.
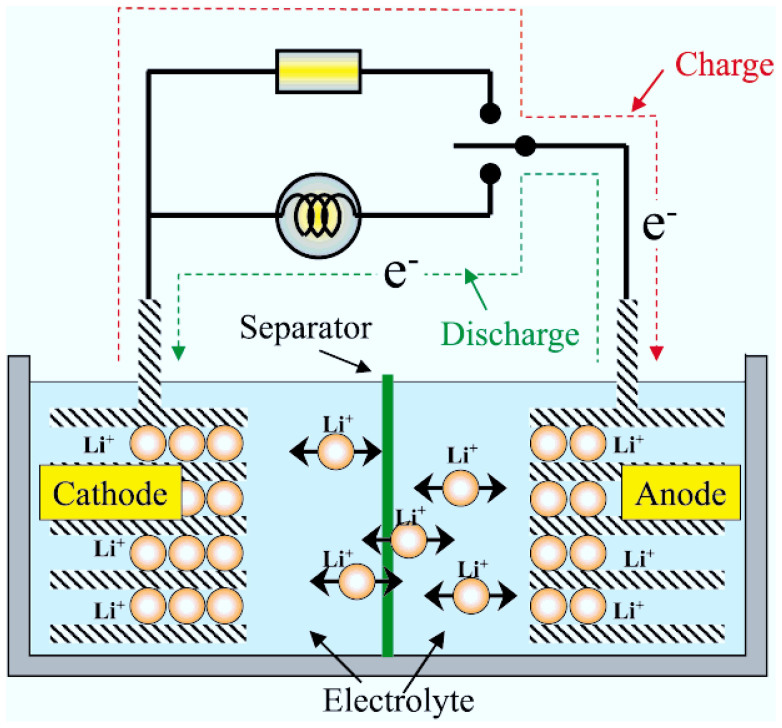
To understand why the state of charge greatly influences the combustion behavior, the mechanism of thermal runaway was used to explain the combustion behavior. Figure 9 shows the charge and discharge principal of lithium ion battery. In fully charged state (100% SOC), Li+ embedded into anode material, and in fully discharged state (0% SOC), Li+ reset into cathode material. At the half charged (50% SOC) state, Li+ ions distribute equally in cathode and anode. Many researchers have studied thermal runaway progress of lithium ion battery. Gachot et al.21 proposed a general electrolyte degradation scheme in the 100–250°C temperature range. Only two types of reaction occur in the degradation process of electrolyte: (i) a reduction process of linear (DEC and DMC) or cyclic carbonate (EC) and (ii) nucleophilic attack, as Figure 10 shows.
Figure 9. Schematic of the lithium ion battery working principle31.
Figure 10. Reactions of electrolyte degradation process21.
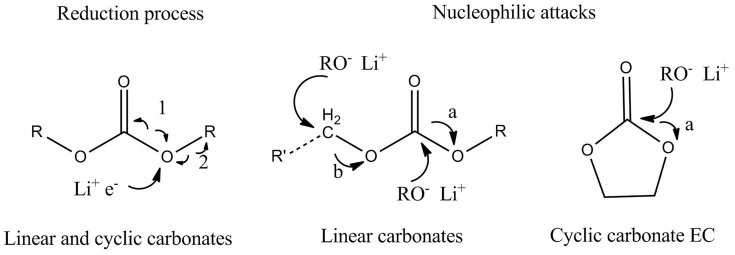
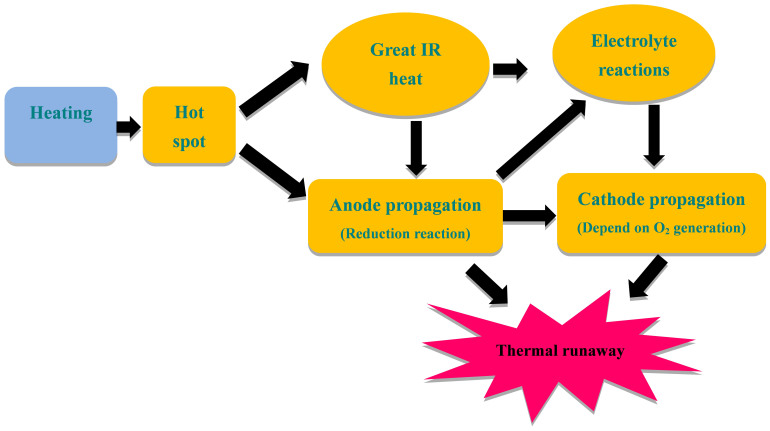
The radicals such as H·, CH3·, C2H5· will be yielded in the solvents degradation processes, which probably form hydrocarbons (CH4, C2H6, C3H6, C3H8) and H2 by recombination at elevated temperature. Besides, the reduction of EC leads to C2H4 release. Wu et al27 analyzed the released gases composition of NCM/PC+DMC (1:1)/LTO battery at elevated temperature. The content of H2 occupied most ratios of released gases, which contain small amounts of CH4, C2H4, C2H6, CO, CO2. In addition, electrolyte can be evaporated at this high temperature. All these combustible gases constitute the fuel of the battery combustion. The released gases are directly related to the reduction of electrolyte, which need Li+ and electron as the reactants. It can be indicated that the combustion behavior have indirect relationship with the distribution of Li+. The key factor leads to the difference in combustion behavior is assumed from the difference in the intercalated lithium in the structure of LTO and NCM reacting with electrolyte. For explaining the thermal runaway mechanism in a Li-ion cell upon incurring internal short under normal operating conditions, Zhang et al28 proposed a flowchart from the internal short to the reactions between electrolyte and electrode active materials, and result in the whole battery thermal runaway. But the heating test is different from normal operating conditions. The average bottom surface temperatures of three batteries (directly heated) all have over 200°C. And under this temperature, electrode materials and electrolyte near the bottom surface will react and release huge heat along with the melt of separator. The heating area directly become “hot spot”, and transfer heat to the lower temperature area. The separator shuts down at 134°C and began to melt at 160°C29 and the temperature is lower than that of electrolyte and electrode decomposition5,30. The separator melting becomes the first reaction at larger area with the ascending of temperature and lead to internal short in this area, which induce the great internal resistance (IR) heat as shown in Figure 11. In the processing of internal short, more Li+ delithiated from anode material into the electrolyte and induce more intense reactions include electrolyte reduction and gases generation. Besides, the higher SOC battery can create greater Joule heat produced by the stronger internal short current and heat the contact areas to accelerate the reaction rate. Therefore, with the decrease of battery SOC, the effects of internal short will be weakened and the related reactions would slow down. According to above analysis, the SOC is a key factor that dominating the battery combustion behavior.
Figure 11. Flowchart of the thermal runaway mechanism in Li-ion battery under heating condition.
In summary, a series of heating tests were carried out to investigate the combustion characteristic of LTO battery. The combustion behavior can be divided into three stages: igniting, stably combusting and extinguishing for all batteries. But for the fully charged battery, its combustion phenomenon is more complicated for a sudden smoke flow ejected from pressure-limiting valve in stable combusting stage when the surface temperature increased sharply from 198°C to 405°C. It was analyzed that it is induced by the phase change of NCM from layer structure to spinel and the reaction of electrolyte. The flame size of three cells reflects that the fire hazard is proportional to SOC. The surface temperature on upper center of battery direct reflects the reaction degree of the battery in this heating test. It was found that the critical temperature of ignition is between 112°C and 121°C on the upper surface and between 139°C and 147°C on the anode electrode for batteries in different SOC. The reasons why SOC dominates the combustion behavior was discussed and found that the SOC directly reflects the Li+ ion concentration in anode and then the internal short strength after the separator melting.
Methods
Experimental apparatus
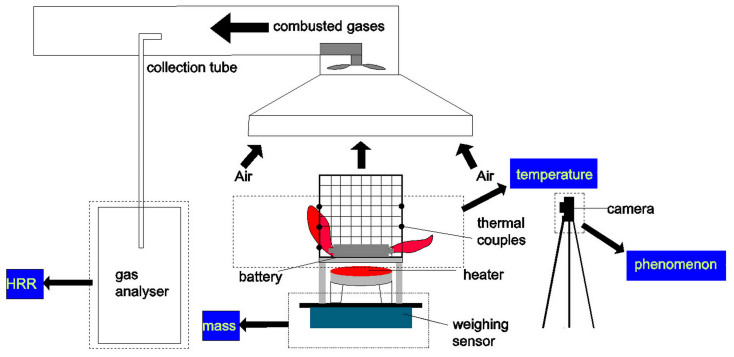
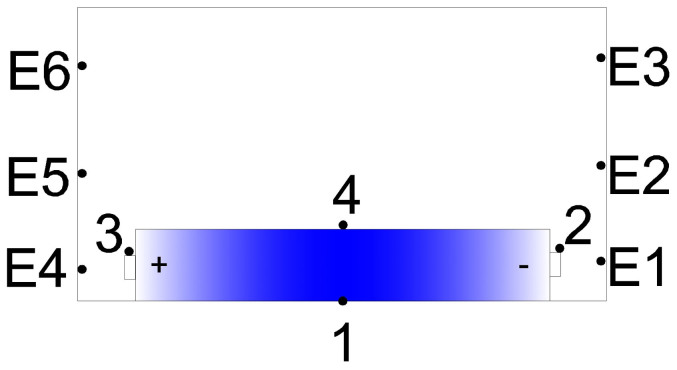
An experimental system was set up to investigate the battery fire and explosion behavior under the heat radiation condition. The temperature, mass loss and heat release rate can be measured. And the whole experimental process was recorded by cameras from the front and side views of battery. Figure 12 shows the total schematic of experimental system. The battery was fixed into a closed cage by steel wire for protecting surrounding apparatus from exploding. To avoid the short circuit, the positive and negative tabs of battery were insulated by insulating tapes. A round electric heater was set 85 mm away from the battery to simulate a heat radiation condition. The variation of battery's weight was measured and recorded by the electronic balance throughout the test, and the precision of balance advent to 0.01 g. The thermocouples (K-type) were fixed on battery's surface to detect the surface temperature. Thermocouples matrix, set on cathode and anode side of battery as shown in Figure 13, was used to detect the flame temperature when battery combusting. Based on ISO 9705, the combusted gases is collected to 400 mm diameter gas pipeline by a fan in speed of 35 L s−1. And sample gases are pumped into gas analyzer to analysis the concentration of oxygen, carbon dioxide and carbon monoxide. During the gas collecting progress, water vapor and smoke was absorbed by a filter. The concentration of oxygen, carbon dioxide and carbon monoxide are used to calculate the heat release rate of battery combusting by oxygen exhaust principle.
Figure 12. Schematic of experimental system.
The mass, temperature and heat release rate are measured by electronic balance, thermocouples and ISO 9705 room test, respectively. The combustion process is recorded by camera from the front and side of battery.
Figure 13. The thermocouples set up around battery.
TC1, TC2, TC3, TC4 are used to detect the surface temperature; E1, E2, E3 are used to detect flame on anode side; E4, E5, E6 are used to detect flame on cathode side.
Battery fabrication
The lithium ion battery consists of the cathode, anode, electrolyte, separator film, aluminum shell and safety valve. NCM and Li4Ti5O12 are used as cathode and anode materials, respectively. The battery is cylindrical style. Size of cell is 66 mm in diameter, and 260 mm in length (without considering the tab length). The separator is PP/PE/PP material and LiPF6 is lithium salt of electrolyte, which contain EC, DEC, DMC as organic solvent. Safety valves and electrodes are designed at the two terminals. The nominal capacity of lithium ion battery is 50 Ah. After cycling, the LTO batteries were charged into different states, empty, half and full, and then were used to test the combustion behavior. SOC is the equivalent of a fuel gauge for the battery pack in EV, HEV, or energy storage battery. The units of SOC are percentage points (empty = 0%, half = 50%, full = 100%).
Data collection of temperature and heat release rate
In the experiments, four K-type thermocouples, numbered as TC1, TC2, TC3, TC4, were placed around the battery surface to collect the temperatures. They were placed on the middle of bottom surface, anode electrode (negative electrode), cathode electrode (positive electrode) and middle of upper surface, respectively. Furthermore, a thermocouple matrix was placed on cathode and anode sides to test the flame temperature. The thermocouples, numbered as E1 to E6, were fixed near to two terminals of the battery, and the vertical interval between two thermocouples in one side was 100 mm. According to the oxygen consumption principle, the concentration of oxygen, carbon dioxide and carbon monoxide can be used to calculate the heat release rate of battery fire. During a complete combustion progress, the heat release rate can be calculated by the Eq. (4).
 |
where  is the initial mass concentration of oxygen,
  is the mass concentration of oxygen in combusted gases, E is the energy release per mass unit of oxygen. While on most conditions, the combustion would be incomplete, this will cause dioxide and soot practical formation. And then, the heat release rate calculation should be based on the concentration of carbon monoxide and carbon dioxide.
Processing fire size by Matlab software
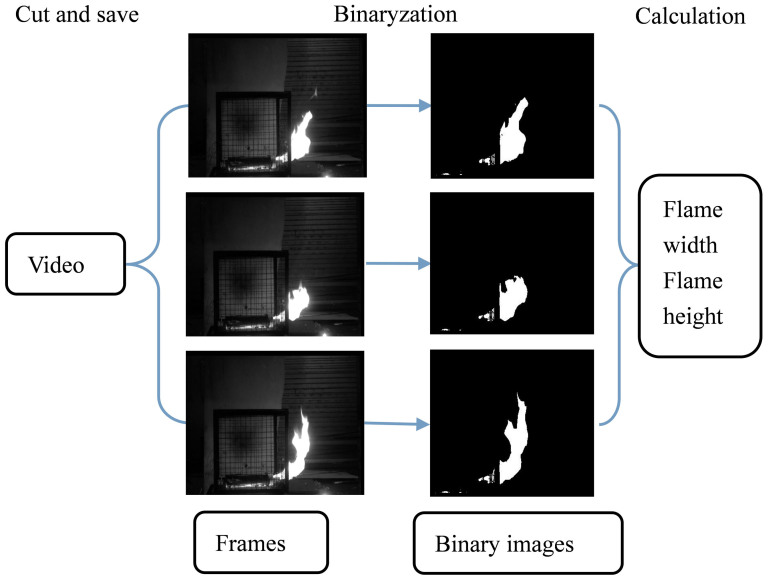
The camera records the combustion process and the video can be used to analysis the variation of flame's width and height. Firstly, the video is transformed into black and white video. Then, all frames in the black and white video are cut and saved by Matlab software. The frame rate of video is 50 frames in one second. Every image is transplant into a matrix, which related to the size of image. These values in matrixes are classified into 0 and 1 by a constant for excluding the disturb information. The threshold value is set as 0.8, where the outline of flame becomes apparently. The values that greater than 0.8 are represented as 1, and the smaller ones are represented as 0. After binaryzation, as shown in Figure 14, the matrixes can be used to calculate the width and height of flame by Matlab software.
Figure 14. The flame width and height calculation using video processing method.
Firstly, the video is transformed into black and white video. Then, all frames in the black and white video were cut and saved by Matlab software. Every image is transplant into matrix, and after binaryzation, the matrix is used to calculated flame size.
Author Contributions
P.F.H. and Q.S.W. designed the experiment. P.F.H. and K.L. conducted the experiments. P.F.H., P.P. and Q.S.W. wrote the main manuscript text and P.F.H. and Q.S.W. prepared figures 1–14. Q.S.W. and J.H.S. supervised the overall study. All authors reviewed the manuscript.
Acknowledgments
This work is supported by the National Natural Science Foundation of China (No. 51176183). Dr. Q. Wang is supported by Program for New Century Excellent Talents in University (No. NCET-12-0514).
References
- Scrosati B. & Garche J. Lithium batteries: Status, prospects and future. J. Power Sources 195, 2419–2430, 10.1016/j.jpowsour.2009.11.048 (2010). [DOI] [Google Scholar]
- Reddy T. B. Linden's Handbook of Batteries. fourth edn, 1–4 (Chemical Industry Press, Beijing, 2013). [Google Scholar]
- Tsujikawa T., Yabuta K., Arakawa M. & Hayashi K. Safety of large-capacity lithium-ion battery and evaluation of battery system for telecommunications. J. Power Sources 244, 11–16, 10.1016/j.jpowsour.2013.01.155 (2013). [DOI] [Google Scholar]
- Lenninger M., Froeis T., Scheiderbauer M., Grabher G. & Bechtold T. High current density 3D electrodes manufactured by technical embroidery. J. Solid State Electr 17, 2303–2309, 10.1007/s10008-013-2108-1 (2013). [DOI] [Google Scholar]
- Wang Q. et al. Thermal runaway caused fire and explosion of lithium ion battery. J. Power Sources 208, 210–224, 10.1016/j.jpowsour.2012.02.038 (2012). [DOI] [Google Scholar]
- Gallagher S. Boeing's Dreamliner batteries “inherently unsafe”—and yours may be too | Ars Technica 19/1/2013, <http://arstechnica.com/business/2013/01/boeings-dreamliner-batteries-inherently-unsafe-and-yours-may-be-too/> (2013). [Google Scholar]
- Meier F. & Woodyard C. Third fire in Tesla Model S reported 7/11/2013, <http://www.usatoday.com/story/money/cars/2013/11/07/third-fire-in-tesla-model-s-reported/3465717/> (2013). [Google Scholar]
- Spotnitz R. & Franklin J. Abuse behavior of high-power, lithium-ion cells. J. Power Sources 113, 81–100, 10.1016/S0378-7753(02)00488-3 (2003). [DOI] [Google Scholar]
- Balakrishnan P. G., Ramesh R. & Kumar T. P. Safety mechanisms in lithium-ion batteries. J. Power Sources 155, 401–414, 10.1016/j.jpowsour.2005.12.002 (2006). [DOI] [Google Scholar]
- Jhu C. Y., Wang Y. W., Shu C. M., Chang J. C. & Wu H. C. Thermal explosion hazards on 18650 lithium ion batteries with a VSP2 adiabatic calorimeter. J Hazard Mater 192, 99–107, 10.1016/j.jhazmat.2011.04.097 (2011). [DOI] [PubMed] [Google Scholar]
- Jhu C.-Y., Wang Y.-W., Wen C.-Y. & Shu C.-M. Thermal runaway potential of LiCoO2 and Li(Ni1/3Co1/3Mn1/3)O2 batteries determined with adiabatic calorimetry methodology. Appl Energ 100, 127–131, 10.1016/j.apenergy.2012.05.064 (2012). [DOI] [Google Scholar]
- Stepniak I. Compatibility of poly(bisAEA4)-LiTFSI-MPPipTFSI ionic liquid gel polymer electrolyte with Li4Ti5O12 lithium ion battery anode. J. Power Sources 247, 112–116, 10.1016/j.jpowsour.2013.08.080 (2014). [DOI] [Google Scholar]
- Tanaka S. et al. Atomic and electronic structures of Li4Ti5O12/Li7Ti5O12 (001) interfaces by first-principles calculations. J Mater Sci 49, 4032–4037, 10.1007/s10853-014-8102-x (2014). [DOI] [Google Scholar]
- Zhang Z., Fouchard D. & Rea J. R. Differential scanning calorimetry material studies: implications for the safety of lithium-ion cells. J. Power Sources 70, 16–20, 10.1016/S0378-7753(97)02611-6 (1998). [DOI] [Google Scholar]
- Yi T. F. et al. Advanced electrochemical properties of Mo-doped Li4Ti5O12 anode material for power lithium ion battery. RSC Adv. 2, 3541–3547, 10.1039/c2ra00981a (2012). [DOI] [Google Scholar]
- Wu K., Yang J., Zhang Y., Wang C. Y. & Wang D. Y. Investigation on Li4Ti5O12 batteries developed for hybrid electric vehicle. J. Appl Electrochem 42, 989–995, 10.1007/s10800-012-0442-0 (2012). [DOI] [Google Scholar]
- Harris S. J., Timmons A. & Pitz W. J. A combustion chemistry analysis of carbonate solvents used in Li-ion batteries. J. Power Sources 193, 855–858, 10.1016/j.jpowsour.2009.04.030 (2009). [DOI] [Google Scholar]
- B Ditch J. d. V. Flammability character of lithium ion battery in bulk storage. (FM Global, Boston-Providence Turnkpike Norwood, U.S., 2013). [Google Scholar]
- Viswanathan V. V. et al. Effect of entropy change of lithium intercalation in cathodes and anodes on Li-ion battery thermal management. J. Power Sources 195, 3720–3729 10.1016/j.jpowsour.2009.11.103 (2010). [DOI] [Google Scholar]
- Kim G.-H., Pesaran A. & Spotnitz R. A three-dimensional thermal abuse model for lithium-ion cells. J. Power Sources 170, 476–489, 10.1016/j.jpowsour.2007.04.018 (2007). [DOI] [Google Scholar]
- Gachot G. G. et al. Thermal behaviour of the lithiated-graphite/electrolyte interface through GC/MS analysis. Electrochim Acta 83, 402–409, 10.1016/j.electacta.2012.08.016 (2012). [DOI] [Google Scholar]
- Björn Karlsson J. G. Q. Enclosure Fire Dynamics. 63–64 (CRC Press LLC, Boca RatonFloridaU.S., 2000). [Google Scholar]
- Wu K. et al. Thermal Stability Analysis on Li(NixCoyMnz)O2/Li4Ti5O12 Battery. Chinese J Mater Res 29, 75–80 (2015). [Google Scholar]
- Lin C. K. et al. Probing Thermally Induced Decomposition of Delithiated Li1.2-xNi0.15Mn0.55Co0.1O2 by in Situ High-Energy X-ray Diffraction. ACS Appl Mater Inter 6, 12692–12697, 10.1021/am502689f (2014). [DOI] [PubMed] [Google Scholar]
- Nam K. W., Yoon W. S. & Yang X. Q. Structural changes and thermal stability of charged LiNi1/3Co1/3Mn1/3O2 cathode material for Li-ion batteries studied by time-resolved XRD. J. Power Sources 189, 515–518 10.1016/j.jpowsour.2008.10.130 (2009). [DOI] [Google Scholar]
- Röder P., Baba N. & Wiemhöfer H. D. A detailed thermal study of a Li[Ni0.33Co0.33Mn0.33]O2/LiMn2O4-based lithium ion cell by accelerating rate and differential scanning calorimetry. J. Power Sources 248, 978–987, 10.1016/j.jpowsour.2013.09.146 (2014). [DOI] [Google Scholar]
- Wu K. Y. et al. Investigation on gas generation of Li4Ti5O12/LiNi1/3Co1/3Mn1/3O2 cells at elevated temperature. J. Power Sources 237, 285–290, 10.1016/j.jpowsour.2013.03.057 (2013). [DOI] [Google Scholar]
- Pistoia G. Lithium-ion Batteries Advances and Applications. 408-431 (Elsevier, Poland, 2013). [Google Scholar]
- Zhang S. S. A review on the separators of liquid electrolyte Li-ion batteries. J. Power Sources 164, 351–364 10.1016/j.jpowsour.2006.10.065 (2007). [DOI] [Google Scholar]
- Ping P., Wang Q. S., Huang P. F., Sun J. H. & Chen C. H. Thermal behaviour analysis of lithium-ion battery at elevated temperature using deconvolution method. Appl Energ 129, 261–273 10.1016/j.apenergy.2014.04.092 (2014). [DOI] [Google Scholar]
- Nishi Y. The development of lithium ion secondary batteries. Chem Rec 1, 406–413 10.1002/Tcr.1024 (2001). [DOI] [PubMed] [Google Scholar]


