Abstract
Objective: Time-related changes and comparisons for mid-upper arm circumference (MUAC), triceps skinfold thickness (TSF), arm fat area (AFA) are lacking for Turkish children and adolescents. To determine the arm anthropometry indices (MUAC, TSF, AFA) in children and adolescents and to also assess the changes in these indices over a 3-year time period.
Methods: The data of the Anthropometry of Turkish Children Aged 0-6 Years (ATCA-06) study and the Second Study of Determination of the Anthropometric Measurements of Turkish Children and Adolescents (DAMTCA-II) were used to calculate the arm anthropometry percentiles in a total group of 6982 children and adolescents aged 28 days to 17 years. The 3rd-97th percentiles were computed by the LMS method.
Results: In girls, 50th percentile MUAC values linearly increased with age. In boys, 50th percentile TSF values linearly increased until 10 years of age and decreased after age 11 years, while in girls, TSF values increased linearly with age. 50th percentile values for AFA showed a linear increase in both genders with age. Significant differences were found between the 5th, 50th and 95th percentile values for MUAC and AFA obtained in the two studies (DAMTCA-II and DAMTCA-I) in both boys and girls.
Conclusions: The prominent finding was the significant and alarming increase in arm anthropometry indices in both genders within as short period of time as three years.
Keywords: adolescents, arm fat area, Mid-upper arm circumference, triceps skinfold thickness, Turkish children
INTRODUCTION
As is well known, body fat distribution is closely related to the occurrence and development of cardiovascular disease. Waist circumference is the most commonly used index of abdominal obesity. Recently, mid-upper arm circumference (MUAC) has been proposed as another important indicator of obesity in children. Traditionally, MUAC has been accepted to be a tool in the assessment of nutritional status (1). In 2003, de Almeida et al (2) proposed MUAC measurements as an alternative anthropometric index to monitor obesity in preschool children. This measurement has also been shown to be a useful index for obesity by Mazicioglu et al (3) in Turkish children aged 6-17 years. Fricke et al (4) demonstrated that arm muscle area (AMA) and arm fat area (AFA) correlated with fat-free mass and fat mass measured by four-site skinfold thicknesses. Age-related MUAC cut-offs have been reported for Brazilian and Turkish children (2,3). However, to the best of our knowledge, systematic and regular monitoring of MUAC is not a commonly preferred method in clinical pediatric practice.
Arm anthropometry has been used as a proxy of body composition in both clinical and epidemiological settings for decades. The cross-sectional AMA and AFA were introduced for the assessment of nutritional status of children in community settings and proposed to be better indices than direct arm anthropometry (skinfold thickness and MUAC). Including both triceps skinfold thickness (TSF) and MUAC measurements, AFA is a more extensive arm-derived index than skinfold thickness or arm circumference measurements alone (5).
The primary aim of this study was to determine the trend in the changes of arm anthropometry indices (MUAC, TSF, AFA) of Turkish children and adolescents over a three-year period. Additionally, our results may be used to compare with both local and international references.
METHODS
Study Design, Sampling and Participants
The cross-sectional study sample was selected from the Central Anatolian province of Kayseri in Turkey, which has a population of more than 1.2 million. Current data were obtained from the Second Study of the Determination of Anthropometric Measurements of Turkish Children and Adolescents (DAMTCA-II), a study performed between October 2007 and April 2008 covering children aged 6 to 17 years and the Anthropometry of Turkish Children Aged 0-6 Years (ATCA-06) study conducted between September 2009 and May 2010 on 0-to-<84-month-old children. Totally, 0-to-17-year-old 6982 children and adolescents were included in this study (6,7).
Additionally, we compared our current data (DAMTCA-II) with the study of the DAMTCA-I. DAMTCA-I was a similar study performed in 2004-2005, including a total of 5553 children and adolescents aged 6 to 17 years from 17 primary and secondary schools (8,9).
Chronological age was calculated as a half year by subtracting the date of birth from the observation date (e.g. 8 indicates ages 8.00-8.99 years). The DAMTCA-II study was approved by the Institutional Review Board of Erciyes University and consent was given by the parents.
Anthropometric Indices
In this study, MUAC, TSF and AFA were all used to measure the adiposity of children and adolescents. All measurements were performed by well-trained health professionals. The MUAC and TSF measurements were performed twice and the mean value was recorded. All of the inter-observer correlation coefficients were ≥0.91. The test and re-test reliability of measurements were determined and coefficients of variability for the TSF and MUAC were 3% and 2%, respectively.
MUAC measurements were taken in centimeters with non-elastic tape to the nearest 0.1 mm on the left arm, halfway between the acromion process and the olecranon process. The child/adolescent stood relaxed with his/her side to the health professional performing the measurement and his/her arm hanging freely at the side; the tape was then passed around the arm at the level of the midpoint of the upper arm (8,10) and the measurement was noted.
TSF measurements were taken in duplicate on the left side of the body to the nearest 0.1 mm, halfway between the acromion and the olecranon process using a Holtain skinfold caliper (9,11).
The AMA, arm area (AA), AFA and fat percent (%) were calculated according to the following formulae:
AMA (cm2)=(MUAC-πTSF)2/4π
AA (cm2)=π/4 x (MUAC/π)2 (π =3.1416)
AFA (cm2)=AA - AMA, as the best indicator of body fat in school-aged children (11,12).
Statistical Analysis
In the construction of the centile curves, the LMS Chart Maker Pro version 2.3 software (The Institute of Child Health, London, UK) was used. This method is appropriate to fit smooth centile curves for the reference data (15). Box-Cox power transformations summarize percentiles for 3-month periods. To normalize the data, three quantities representing L (lambda: skewness), M (m: median) and S (sigma: coefficient of variation) were used (16). The 3rd, 5th, 10th, 25th, 50th, 75th, 85th, 90th, 95th and the 97th percentiles were computed for each gender in half-year periods. Differences between both genders in each age group were assessed by independent-samples t-test. Differences between age groups in each gender were compared with the one-way analysis of variance. Difference (comparison) between both genders in each age group were assessed by independent-samples t-test. A p value of less than 0.05 was considered statistically significant.
RESULTS
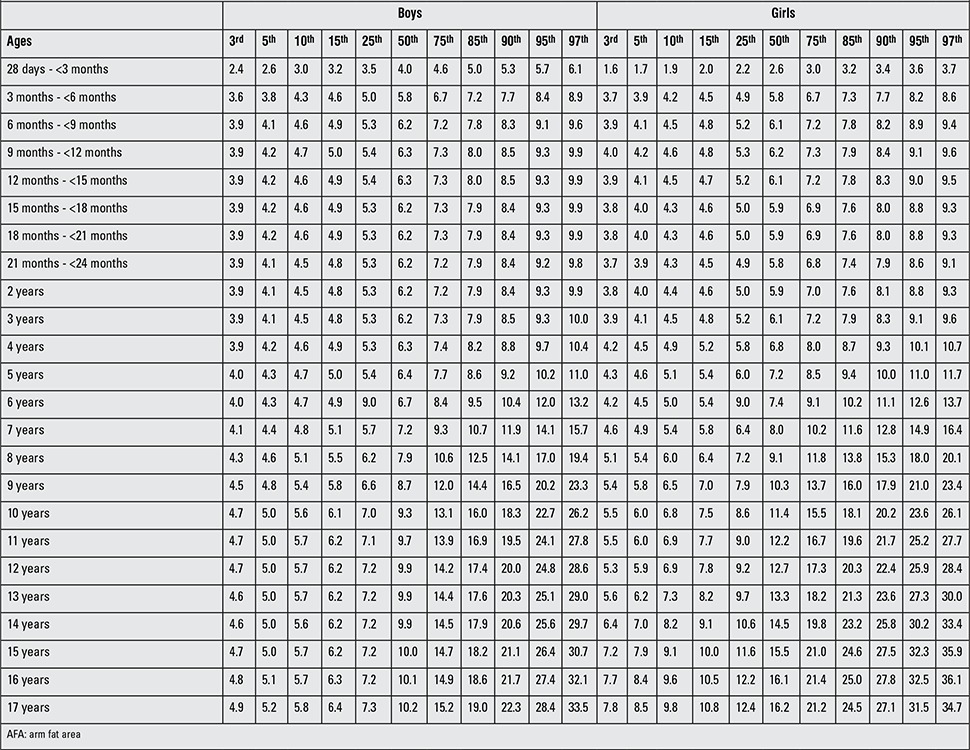
Tables 1a and 1b demonstrate the sample size per age group for six anthropometric indices (MUAC, TSF, AMA, AA, AFA, fat %) in Turkish boys and girls. In a comparative evaluation of boys and girls in each age group, the following parameters were found to show statistically significant differences between the two genders in the indicated age groups (as shown in Table 1a): MUAC, AMA and AA in 28 d-<3-month-olds and 18-to-21-month-olds; AMA in 9-to-12-month-olds; MUAC and AMA in 12-to-15-month-olds; MUAC, AMA, AA and AFA in 15-to-18-month-olds; AMA in 21-to-24-month-olds; TSF and AMA in 2 and 8 years; TSF in 3 years; TSF and AFA in 4 and 10 years; TSF, AMA and AFA in 5, 6, 7, 11, 13, 14 and years; AMA in 9 years; MUAC, TSF, AMA, AA, AFA in 15, 16 and 17 years were (p<0.05, p<0.01, p<0.001). Tables 2-4 summarize the smoothed age- and gender-specific MUAC, TSF and AFA percentile values for Turkish children and adolescents, respectively. In girls, with increasing age, 50th percentile MUAC values linearly increased (Table 2). In boys, 50th percentile TSF values linearly increased until 10 years, remained unchanged at 11 years, then decreased afterwards. In girls, TSF values increased linearly with age (Table 3). For both genders, 50th percentile AFA values linearly increased with age (Table 4).
Table 1a. Sample size and mean ± SD values per age group for six anthropometric indices (boys).
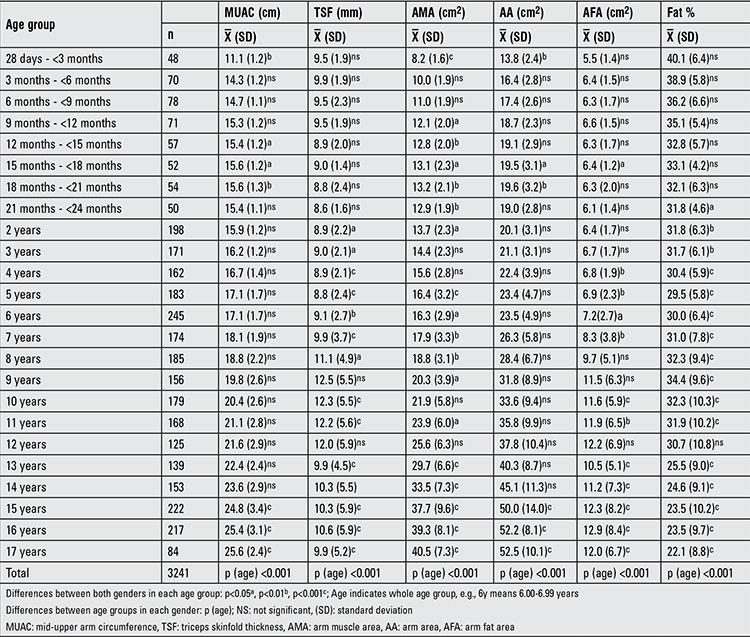
Table 1b. Sample size and mean ± SD values per age group for six anthropometric indices (girls).
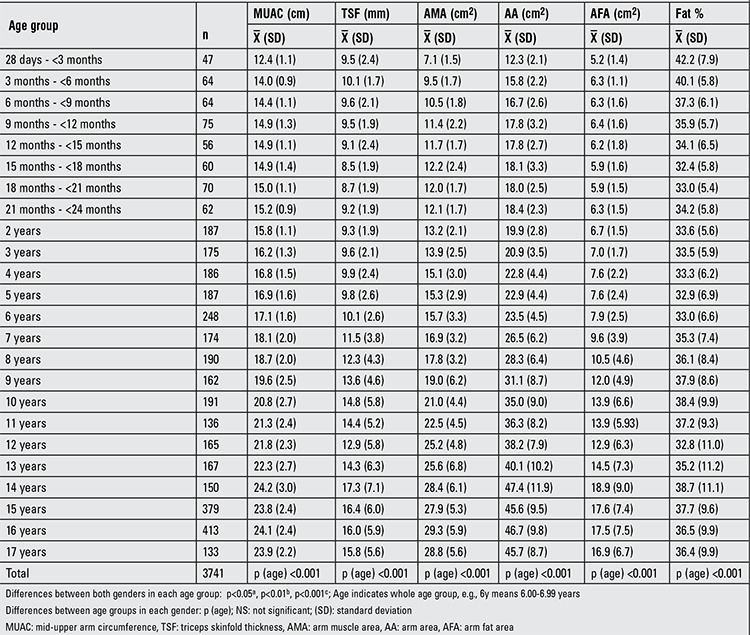
Table 2. Smoothed age- and gender-specific MUAC percentile values (cm) for Turkish children and adolescents.
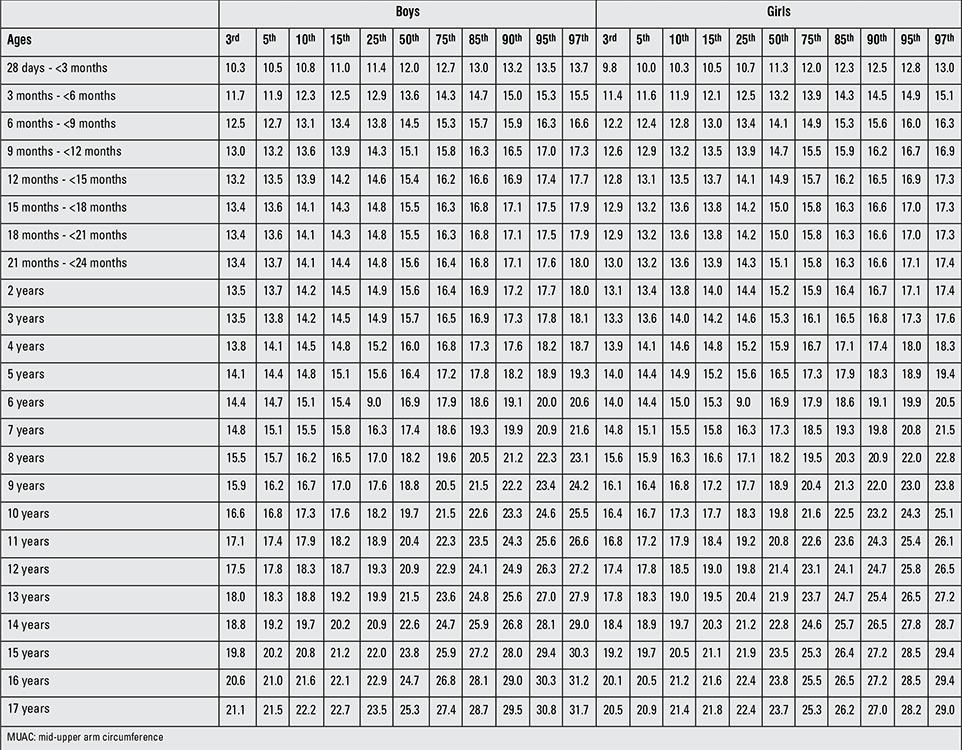
Table 3. Smoothed age- and gender-specific TSF percentile values (mm) for Turkish children and adolescents.
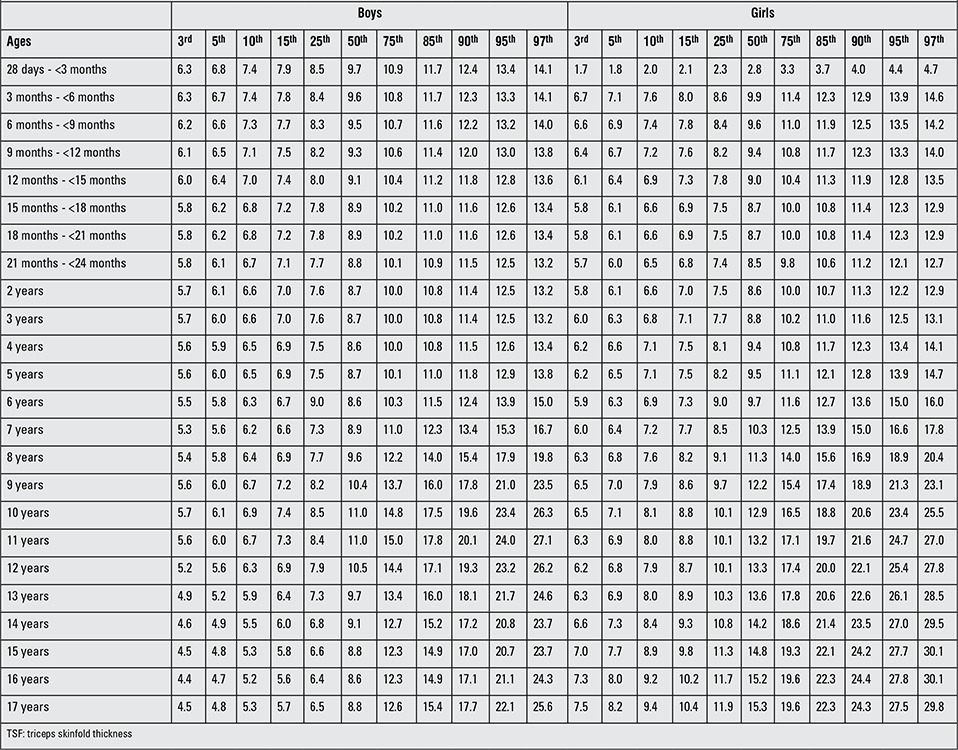
Table 4. Smoothed age- and gender-specific AFA percentile values (cm2) for Turkish children and adolescents.
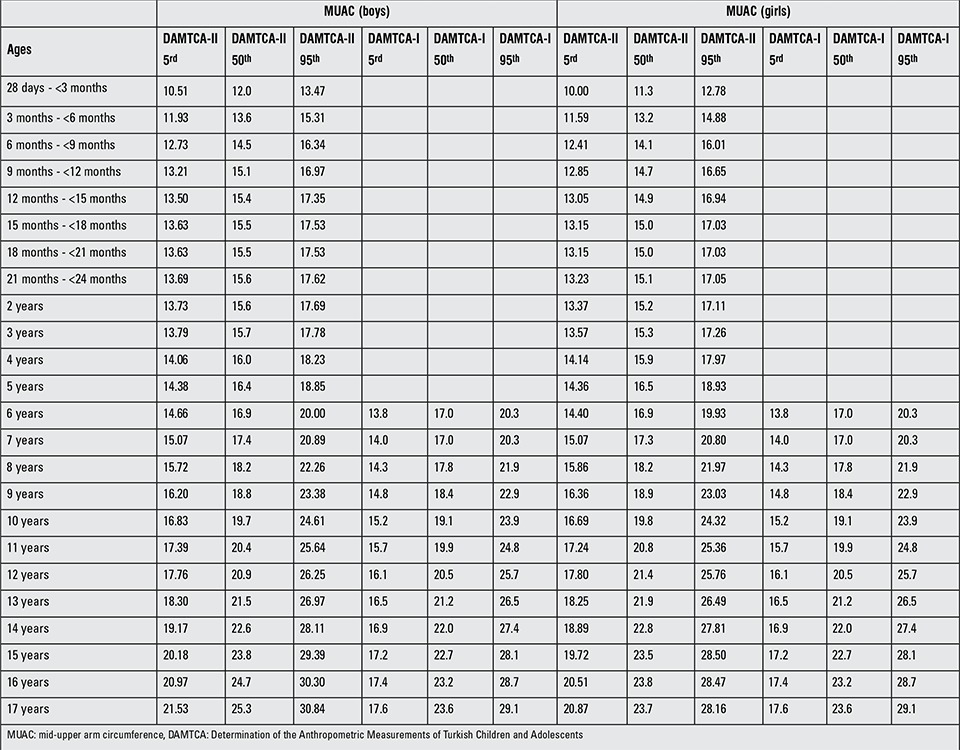
Tables 5 and 6 give the comparison of AFA and MUAC of DAMTCA-II and DAMTCA-I datasets within genders. For AFA and MUAC in boys and girls, DAMTCA-II 5th-50th and 95th percentiles were significantly different between the 28 days - <3m and 10 years age groups. DAMTCA-I 5th-50th and 95thf percentiles were significantly different in the 6-to-10-year age groups (Tables 5, 6).
Table 5. AFA comparisons of DAMTCA-II with DAMTCA-I for 5th-50th-95th percentiles.
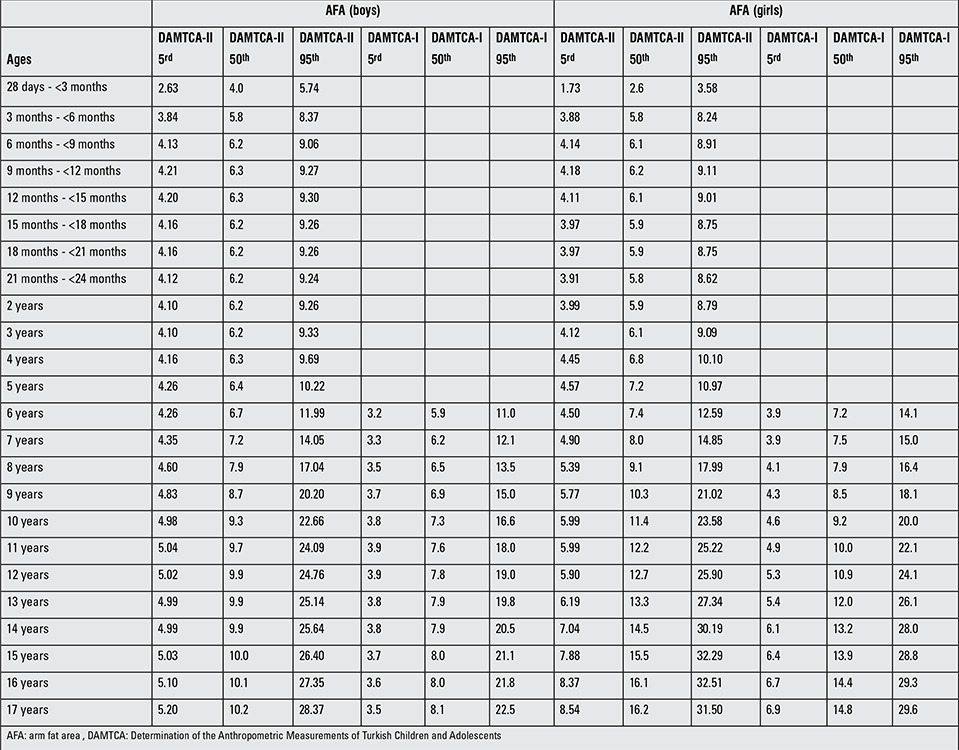
Table 6. MUAC comparisons of DAMTCA-II with DAMTCA-I for 5th-50th-95th percentiles.
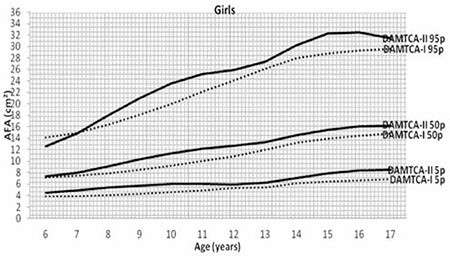
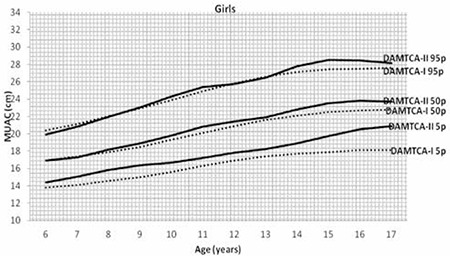
Figures 1 (a,b) and 2 (a,b) demonstrate the comparison of DAMTCA-II and DAMTCA-I datasets for MUAC and AFA for boys and girls. For MUAC and AFA, DAMTCA-II 5th-50th-95th percentiles were found to be higher than those in DAMTCA-I for both genders through 6 to 17 years.
Figure 1a. Comparison of arm fat area (AFA) 5th-50th-95th percentiles of Determination of the Anthropometric Measurements of Turkish Children and Adolescents (DAMTCA-I) and DAMTCA-II studies for boys.
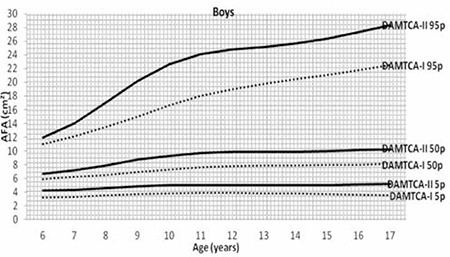
Figure 1b. Comparison of arm fat area (AFA) 5th-50th-95th percentiles of Determination of the Anthropometric Measurements of Turkish Children and Adolescents (DAMTCA-I) and DAMTCA-II studies for girls.
DISCUSSION
This study presents the smoothed MUAC, TSF and AFA percentiles from ages 28 days to 17 years in Turkish children and adolescents and also, to the best of our knowledge, is the first study demonstrating the changes in MUAC, TSF and AFA values over a three-year time period. Comparison of the DAMTCA-II data with the DAMTCA-I data showed that the 5th, 50th and 95th percentile values for MUAC and AFA had all increased within a period of three years in both genders.
Cândido et al (17) reported AFA as the most suitable index to monitor obesity in prepubertal and pubertal boys and girls in Brazil (n=788, 6-15 years). Gultekin et al (18) have demonstrated that AFA values were higher among girls and AMA among boys, pointing out to significant sexual dysmorphism in the muscle and fat patterns. Their results also refer to the significant impact of socioeconomic status on AMA and AFA among Turkish children. Lu et al (19) found that both in boys and girls, MUAC was closely associated with BMI and waist circumference and concluded that MUAC can accurately identify overweight and obesity in Chinese children.
When using anthropometric indices such as waist circumference, health professionals should be aware that this index is affected by respiratory movements and postprandial abdominal distension. The arm anthropometry indices such as MUAC, TSF and AFA which is a derived index, are all independent of the factors mentioned above and may therefore be alternative and reliable indices for overweight and obesity. In the current study, with increasing age, linear elevations were noted in MUAC, AMA, AA and AFA values in Turkish boys and girls. TSF values on the other hand showed an increase until age 9 years and decreased afterwards. Fat % values decreased linearly from the 28 days-3 months age period to 17 years.
It is worth mentioning that within the limits of this study, it is difficult to evaluate presence of a secular trend. However, the data allow us to state that an increase had occurred in all anthropometric indices and body composition parameters related to obesity in as short a time period as three years. These trends appear to be related to gender-specific changes in fat and fat-free mass associated with puberty. Pubertal development is an important factor effecting anthropometric indices and body composition during adolescence (20). During adolescence, gender differences and age differences in fat mass, fat-free mass and regional body fat distribution become apparent. However, in the present study, it has not been possible to obtain data pertaining to pubertal staging, due to some cultural considerations. Our data also shows that while body fat increases until age 17 years in girls, it starts decreasing at age 13 years in boys.
The cross-sectional nature of the current study provides the opportunity to reflect the current situation clearly. However, differences in sample characteristics between the two studies compared may be considered as a limitation. Although sampled from the same population with simple clustering and despite the fact that the age groups are similar in both data sets, there is a possibility of dissimilarities between the two datasets. Improvement in family income may also be responsible for the significant increment occurring in a relatively short period of time (21).
In conclusion, due to the lack of international cut-off values for arm anthropometry in children and adolescents, studies aiming to produce local references may be beneficial. The prominent finding of this study was the significant and alarming increase in arm anthropometry percentile values in both genders over a short period of time. This finding requires further investigation, but points to a need for preventive interventions in order to decline obesity.
Figure 2a. Comparison of mid-upper arm circumference (MUAC) 5th-50th-95th percentiles of Determination of the Anthropometric Measurements of Turkish Children and Adolescents (DAMTCA-I) and DAMTCA-II studies for boys.
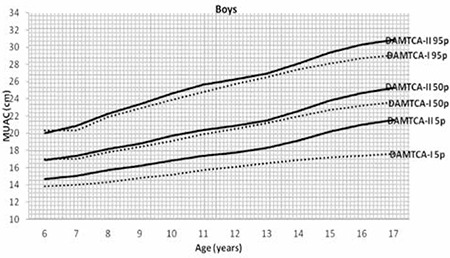
Figure 2b. Comparison of mid-upper arm circumference (MUAC) 5th-50th-95th percentiles of Determination of the Anthropometric Measurements of Turkish Children and Adolescents (DAMTCA-I) and DAMTCA-II studies for girls.
References
- 1.Turton P. The use of mid upper arm circumference in the assessment of nutritional status: the Mursi. Midwife Health Visit Community Nurse. 1985;21:81–86. [PubMed] [Google Scholar]
- 2.Almeida CA, de, Del Ciampo LA, Ricco RG, Silva SM, Jr, Naves RB, Pina JF. Assessment of mid-upper arm circumference as a method for obesity screening in preschool children. J Pediatr (Rio J) 2003;79:455–460. doi: 10.2223/jped.1081. [DOI] [PubMed] [Google Scholar]
- 3.Mazicioglu MM, Hatipoglu N, Ozturk A, Cicek B, Ustunbas HB, Kurtoglu S. Waist circumference and mid-upper arm circumference in evaluation of obesity in children aged between 6 and 17 years. J Clin Res Pediatr Endocrinol. 2010;2:144–150. doi: 10.4274/jcrpe.v2i4.144. [DOI] [PMC free article] [PubMed] [Google Scholar]
- 4.Fricke O, Sumnik Z, Remer T, Stabrey A, Tutlewski B, Schoenau E. Cross-sectional fat area at the forearm in children and adolescents. Horm Res. 2008;69:160–164. doi: 10.1159/000112589. [DOI] [PubMed] [Google Scholar]
- 5.Cicek B, Ozturk A, Mazicioglu MM, Elmali F, Turp N, Kurtoglu S. The risk analysis of arm fat area in Turkish children and adolescents. Ann Hum Biol. 2009;36:28–37. doi: 10.1080/03014460802537690. [DOI] [PubMed] [Google Scholar]
- 6.Mazicioglu MM, Kurtoglu S, Ozturk A, Hatipoglu N, Cicek B, Ustunbas HB. Percentiles and mean values for neck circumference in Turkish children aged 6-18 years. Acta Paediatr. 2010;99:1847–1853. doi: 10.1111/j.1651-2227.2010.01949.x. [DOI] [PubMed] [Google Scholar]
- 7.Elmali F, Altunay C, Mazicioglu MM, Kondolot M, Ozturk A, Kurtoglu S. Head circumference growth reference charts for Turkish children aged 0-84 months. Pediatr Neurol. 2012;46:307–311. doi: 10.1016/j.pediatrneurol.2012.02.016. [DOI] [PubMed] [Google Scholar]
- 8.Ozturk A, Budak N, Cicek B, Mazicioglu MM, Bayram F, Kurtoglu S. Cross-sectional reference values for mid-upper arm circumference, triceps skinfold thickness and arm fat area of Turkish children and adolescents. Int J Food Sci Nutr. 2009;60:267–281. doi: 10.1080/09637480701663854. [DOI] [PubMed] [Google Scholar]
- 9.Cicek B, Ozturk A, Mazicioglu MM, Inanc N, Kurtoglu S. A novel cut-off for abdominal obesity derived from various anthropometric indices to predict body composition: Arm fat area. Turk J Med Sci. 2010;40:515–523. [Google Scholar]
- 10.Moreno LA, Mesana MI, González-Gross M, Gil CM, Fleta J, Wärnberg J, Ruiz JR, Sarría A, Marcos A. Anthropometric body fat composition reference values in Spanish adolescents. The AVENA Study. Eur J Clin Nutr. 2006;60:191–196. doi: 10.1038/sj.ejcn.1602285. [DOI] [PubMed] [Google Scholar]
- 11.Frisancho AR. New norms of upper limb fat and muscle areas for assessment of nutritional status. Am J Clin Nutr. 1981;34:2540–2455. doi: 10.1093/ajcn/34.11.2540. [DOI] [PubMed] [Google Scholar]
- 12.Wolfe WS, Campbell CC, Frongillo EA, Jr, Haas JD, Melnik TA. Overweight schoolchildren in New York state: Prevalence and characteristics. Am J Public Health. 1994;84:807–813. doi: 10.2105/ajph.84.5.807. [DOI] [PMC free article] [PubMed] [Google Scholar]
- 13.Frisancho AR, Garn S. Skinfold thickness and muscle size: Equations for developmental status and nutritional evaluation for children for Honduras. Am J Clin Nutr. 1971;24:541–546. doi: 10.1093/ajcn/24.5.541. [DOI] [PubMed] [Google Scholar]
- 14.Monir Z, Koura M, Erfan M, Mansour M. Anthropometric parameters in relation to nutritional status in school children. Egypt Med J NRC. 2004;5:15–39. [Google Scholar]
- 15.Cole TJ. Fitting smoothed centile curves to reference data. Stat Soc A. 1988;151:385–418. [Google Scholar]
- 16.Cole TJ, Green PJ. Smoothing reference centile curves: the LMS methods and penalized likelihood. Stat Med. 1992;11:1305–1319. doi: 10.1002/sim.4780111005. [DOI] [PubMed] [Google Scholar]
- 17.Cândido AP, Freitas SN, Machado-Coelho GL. Anthropometric measurements and obesity diagnosis in schoolchildren. Acta Paediatr. 2011;100:120–124. doi: 10.1111/j.1651-2227.2011.02296.x. [DOI] [PubMed] [Google Scholar]
- 18.Gultekin T, Koca Ozer B, Katayama K, Akin G. Age-related patterns of upper arm muscle and fat area in Turkish children and assessment of nutritional status. Int J Anthropol. 2006;21:231–239. [Google Scholar]
- 19.Lu Q, Wang R, Lou DH, Ma CM, Liu XL, Yin FZ. Mid-upper arm circumference and arm-to-height ratio in evaluation of overweight and obesity in Han children. Pediatr Neonatol. 2014;55:14–19. doi: 10.1016/j.pedneo.2013.05.004. [DOI] [PubMed] [Google Scholar]
- 20.Al-Sendi AM, Shetty P, Musaiger AO. Anthropometric and body composition indicators of Bahraini adolescents. Ann Hum Biol. 2003;30:367–379. doi: 10.1080/0301446031000091792. [DOI] [PubMed] [Google Scholar]
- 21.No Authors. Ministry of Development and Civilization Directorate General for Economic Models and Strategic Studies Monitoring and evaluation department of global economic developments. Rec Dev World Econ. 2012;5:40–53. [Google Scholar]


