Abstract
A simple, specific, accurate and rapid reversed phase high performance liquid chromatographic method was validated for the determination of the content of ciprofloxacin in three pharmaceuticals forms: generic, similar and compounded. The results of the validation showed that the method was highly efficient for quantification of ciprofloxacin in the matrices evaluated. The recovery rates were between 97.4 to 104.3 %, and the relative standard deviations were lower than 5 % for repeatability, and lower than 5.15 % for intermediate precision. The limits of detection, quantification and practical, were 0.11, 0.35 and 1.56 μg/ml, respectively. All compounded samples were approved with in the quality control; however, one generic and one similar sample presented above allowed level.
Keywords: Quality control, ciprofloxacin, quinolones, HPLC, antibiotics
The quinolones and fluoroquinolones are synthetic antimicrobials considered bactericidal, effective in the treatment of various infections, particularly bacterial infections of the urinary tract. The mechanism of action is the inhibition of DNA replication conferred, by their chemical structures[1]. After its discovery in 1962, nalidixic acid became the most significant treatment for urinary tract infections caused by Gram-negative bacteria. However, its indication for systemic infection was later restricted as many microorganisms acquired resistance to the antibiotic[2].
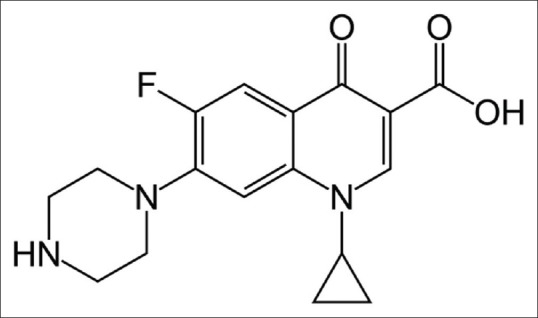
Due to the development of bacterial resistance, many other analogs of nalidixic acid began to be developed. In 1980, it was noticed that the insertion of a fluorine atom in the ring quinolone (fig. 1), increased antimicrobial activity, facilitating the entry of the drug into the bacterial cell, which broadened the spectrum of action of the drug to Gram positive bacteria and potentiated the action against Gram-negative bacteria[1].
Fig. 1.

Chemical structure of ciprofloxacin.
The changes made in the structure of the molecules in the ‘80s led to the synthesis of compounds of the second-generation fluoroquinolones or quinolones[2]. Ciprofloxacin, an antibacterial of the quinolone group, was developed from these molecular changes. It is the antibiotic most active against Gram-negative bacteria of the class and is widely used in urinary and respiratory tract infections, as well as against skin, bone, and joint infections[1].
Several analytical methods for the quantitative determination of fluoroquinolones in pharmaceutical formulations were reported in the scientific literature as capillary electrophoresis[3,4], UV spectrophotometry[5], titration[6], and high performance liquid chromatography (HPLC), which is often used for quantification of ciprofloxacin in medicines[7,8], urine[9], plasma[10], animal tissue[11], and other substances.
Considering the importance of ensuring the quality of medicines and not having found scientific reports assessing the quality of compounded, generic, and similar drugs, compared to ciprofloxacin base, the aim of this study was to evaluate the content of the antibiotic ciprofloxacin in three specialty pharmaceutical medicines (compounded, similar and generic) by a simple and fast high performance liquid chromatography method.
Phosphoric acid and acetonitrile were obtained from J. T. Baker® and Cromaline®, respectively. Ciprofloxacin, used as a standard, was purchased from Sigma® (Lot: BCBF8891V). The triethanolamine was acquired from Sigma®. All solvents and solutions were filtered through membrane filters of cellulose acetate (Sartorius Products Biolab) in ultrasound and degassed with a vacuum pump prior to use.
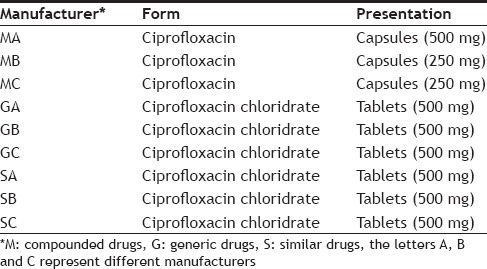
Drugs were purchased at pharmacies in Vila Velha-ES (Brazil). A box was purchased from three different manufacturers (A, B, C) for each specialty (compounded, similar, and generic), totaling nine samples (Table 1). To calculate the average weight, 10 units of each drug were weighed. After weighing, the 10 units were homogenized in a porcelain mortar. An amount of powder equivalent to the average weight of the drug was weighed into a 250 ml beaker, was solubilized with 0.2% acetic acid, and brought to ultrasound for 30 min. The solution was transferred to a 500 ml volumetric flask, swelled with the same solution, diluted 100 times, filtered through a membrane of 0.45 μm cellulose ester and injected into the chromatograph. All samples were taken in triplicate (n=3), each being analyzed in duplicate.
TABLE 1.
SAMPLES EVALUATED

Analyses were performed according the Brazilian Pharmacopoeia modified method[12]. A Waters® chromatograph model 1515 Isocratic HPLC Pump was used. It was equipped with injection valve 20 μl, detector Waters 2489 UV/Vis set at 278 nm and reverse phase analytical column X Bridge® C18 (4.6×150 mm and 3.5 μm.) The mobile phase used was a mixture of aqueous solution of 0.025 M phosphoric acid (adjusted to pH 3.0±0.1 with triethanolamine) and acetonitrile (60:40) at a flow rate of 1.0 ml/min. The standard solution of ciprofloxacin was prepared in acetic acid solution at a concentration of 0.2% 500.0 mg/ml from which concentrations were prepared to evaluate the efficiency of the method, including the external calibration curve.
The method validation was performed using the following parameters: Linearity, linear range, linear response range, repeatability, intermediate precision, recovery, limit of detection (LOD), limit of quantification (LOQ), and practical limit of quantification (PLQ), according to DOC-CGCRE-008 INMETRO orientation[13]. The linearity of the method was evaluated by the coefficient of determination (r2), and calculated from the linear regression. To determine the linear range and linear response range, the statistical method of least squares was used. The results were considered within the approved range points to present a residue value less than 15%. The precision was evaluated by intermediate precision and repeatability tests on two samples, one manipulated into 250 mg capsules and the other of a generic tablet of 500 mg. In repeatability tests, 7 consecutive determinations were performed for each sample, and to intermediate precision, 21 determinations were performed in three different weeks. The accuracy was evaluated by the rate of recovery by adding three standard levels (250, 350 and 500 mg). The limits of detection and quantification were calculated by the signal-to-noise ratio, considered as the detection limit concentration of the analyte, which produces a signal three times the average signal-to-noise ratio and 10 times greater for the quantification limit. The practical limit of quantification was defined as the lower limit of the linear response range.
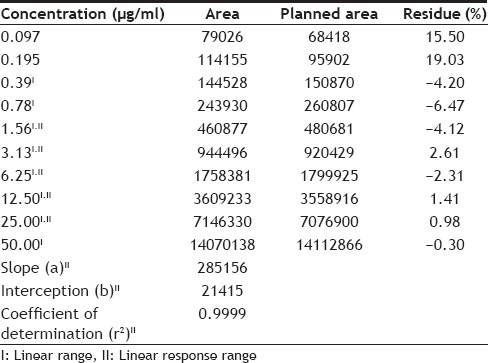
In order to obtain a better resolution of the chromatogram in a shorter time of analysis, we tested different ratios of the components of the mobile phase (phosphoric acid, acetonitrile and water). The best condition found to analyze was to use 0.025 M phosphoric acid (adjusted to pH 3.0±0.1 with triethanolamine) and acetonitrile in a ratio of 60:40, at a flow rate of 1.0 ml/min, where the variable pH showed greater influence on the resolution, which must be monitored, confirming previous study[14]. In the evaluation of linearity (Table 2), it is noted that concentrations 0.097 and 0.195 mg/ml had greater than 15% residue; thus, the linear range of the method was between 0.39 and 50 mg/ml. The linear response range (calibration curve) was selected from the chromatograms of the samples in preliminary tests, allowing a better fit of the equation of linear response range for quantification of samples (Table 2).
TABLE 2.
STATISTICAL ANALYSES OF LINEARITY

The accuracy of the method was evaluated by recovery rate on three levels, and the results showed that the method has good efficiency. In the sample of compounded drugs, recovery rates were 101.1±3.2%, 98.7±2.2%, and 104.3±1.8% for concentrations of 250, 350 and 500 mg, respectively, whereas for the generic sample, the rates were 100.5±1.0%, 99.6±3.9%, and 97.4±2.3%. Similar values were reported by other authors who reported recovery rates from 96.3 to 102.6%, and precision values between 4.2 and 8.3% to RSD (relative standard deviation)[15]. Other studies reported recovery rates between 97.1 and 104.7%, and for precision, RSD for testing repeatability from 1.0 to 3.0%, and 3.3 to 3.4% for intermediate precision[16].
Precision is the closeness of agreement between independent test results obtained under stipulated conditions. Intermediate precision conditions allow for the varying of factors such as operators and apparatus over longer periods of time within a single laboratory, whereas repeatability conditions attempt to hold these factors constant. The RSD-to-repeatability values were 3.88% and 4.88%, for generic and compounded drugs, respectively. The evaluation of intermediate precision considered the 21 tests performed on different days and by different analysts, and the RSDs were 4.31 and 5.15%, for compounded drugs and generics, respectively. The precision is considered appropriate when the HorRat (Horwitz ratio) value is smaller than 2.0[13]. Thus, it can be considered adequate, since the values for repeatability values for generic samples and compounded drugs were 0.34 and 0.39, respectively.
To determine the limit of detection and quantification, seven consecutive tests were performed with blank solution (0.2% acetic acid) to determine the signal-to-noise ratio. Thus, the values found for the LOD and LOQ were 0.11 and 0.35 mg/ml, respectively. The PLQ was considered the lower limit of the linear response range (1.56 mg/ml), as shown in Table 2.
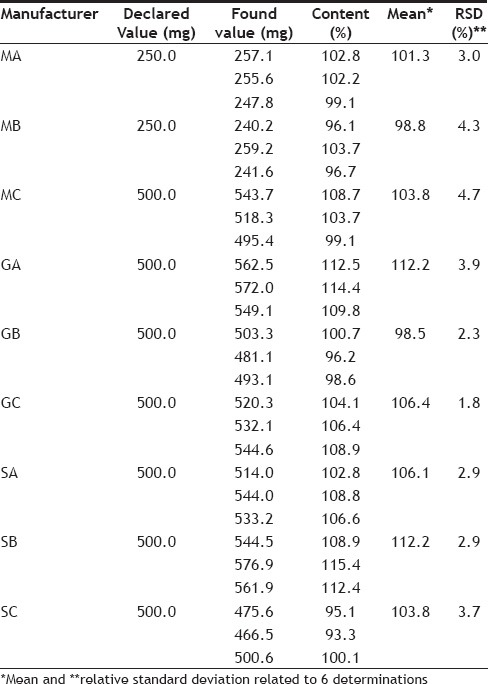
According to the Brazilian Pharmacopeia, the content of the drug should be a minimum of 90% and maximum of 110% of the amount declared by the manufacturer[12]. Table 3 shows the results for ciprofloxacin content of each sample analyzed. All samples of the compounded drugs were approved in accordance with the quality test, indicating that the pharmacies evaluated in Vila Velha (Espírito Santo, Brazil) have good quality control. However, one sample of the generic drug and one sample of similar drug failed in the test, with values higher than allowed, namely the generic Generic A with content of 112.2±3.9%, and similar drug Similar B with 112.2±2.9%, indicating that quality control should be improved.
TABLE 3.
RESULTS OF THE DETERMINATION OF CIPROFLOXACIN IN EVALUATED DRUGS

In another study, three manufacturers of ciprofloxacin base were evaluated, two tablet formulations (250 and 500 mg), and a solution (20 mg/ml). All samples showed content within the allowable range, the values were 103.38±0.06% and 107.01±0.09% for tablets and 100.43±0.06% for the solution, similar values those found by the present study[14].
Quality control is very important because, consuming the medication in larger doses than recommended can result in overdose. Moreover, consuming an amount less than the recommended dose may compromise the treatment. As the patient relies on manufactured drugs, it is vital that they can be trusted.
The validated method was efficient for the quantification of ciprofloxacin in the evaluated drugs. Considering the variation of 10 % permitted by the Brazilian Pharmacopoeia, all compounded drugs samples were approved in the quality control. On the other hand, one of the three analyzed samples of generic drugs and one of the three samples of similar drugs showed values above the allowed, indicating deficiency in the process of quality control.
Footnotes
Scherer, et al.: Ciprofloxacin Evaluation in Brazilian Formulations
REFERENCES
- 1.Guimarães DO, Momesso LS, Pupo MT. Antibiotics: therapeutic importance and perspectives for the discovery and development of new agents. Quím Nova. 2010;33:667–9. [Google Scholar]
- 2.Souza RB, Magnani M, Oliveira TC. Mechanisms of resistance to quinolones in Salmonella spp. Rev Semina: Ciências Agrárias. 2010;31:413–27. [Google Scholar]
- 3.Flurer CL. Analysis of antibiotics by capillary electrophoresis. Electrophoresis. 1997;18:2427–37. doi: 10.1002/elps.1150181233. [DOI] [PubMed] [Google Scholar]
- 4.Sun SW, Chen LY. Optimization of capillary electrophoretic separation of quinolones antibacterials using the overlapping resolution mapping scheme. J Chromatogr. 1997;766:215–24. [Google Scholar]
- 5.Fratini L, Schapoval EE. Ciprofloxacin determination by visible light spectrophotometry using iron(III) nitrate. Int J Pharm. 1996;127:279–82. [Google Scholar]
- 6.Belal F, Al-Majed AA, Al-Obaid AM. Methods of analysis of 4-quinolone antibacterials. Talanta. 1999;50:765–86. doi: 10.1016/s0039-9140(99)00139-3. [DOI] [PubMed] [Google Scholar]
- 7.Husain S, Khalid S, Nagaraju V, Rao RN. High-performance liquid chromatographic separation and determination of small amounts of process impurities of ciprofloxacin in bulk drugs formulations. J Chromatogr. 1995;705:380–4. [Google Scholar]
- 8.Torniainen K, Tammilehto S, Ulvi V. The effect of pH, buffer type and drug concentration on the photo degradation of ciprofloxacin. Int J Pharm. 1996;132:53–61. [Google Scholar]
- 9.Sowinski KM, Kays MB. Determination of ciprofloxacin concentrations in human serum and urine by HPLC with ultraviolet and fluorescence detection. J Clin Pharm Ther. 2004;29:381–7. doi: 10.1111/j.1365-2710.2004.00575.x. [DOI] [PubMed] [Google Scholar]
- 10.Samanidou VF, Christodoulou EA, Papadoyannis IN. Determination of fluoroquinolones in edible animal tissue samples by high performance liquid chromatography after solid phase extraction. J Sep Sci. 2005;28:555–65. doi: 10.1002/jssc.200401910. [DOI] [PubMed] [Google Scholar]
- 11.Vybiralova Z, Nobilis M, Zoulova J, Kvetina J, Petr P. High-performance liquid chromatographic determination of ciprofloxacin in plasma samples. J Pharm Biomed Anal. 2005;37:851–8. doi: 10.1016/j.jpba.2004.09.034. [DOI] [PubMed] [Google Scholar]
- 12.5th ed. Brasilia: 2010. Brazilian Pharmacopoiea II; p. 546. [Google Scholar]
- 13.Brasil. National Institute of Metrology, Quality and Technology (INMETRO) Guidance on validation of analytical methods. 2011 [Google Scholar]
- 14.Kassab NM, Singh AK, Kedor-Hackmam ER, Santoro MI. High-performance liquid chromatographic separation and determination of small amounts of process impurities of ciprofloxacin in bulk drugs formulations. Braz J Pharm Sci. 2005;41:507–13. [Google Scholar]
- 15.Dincel A, Yildirim A, Caglayan F, Bozkur A. Determination of ciprofloxacin In human gingival crevicular fluid By high-performance liquid chromatography. ACTA Chromatogr. 2005;15:308–14. [Google Scholar]
- 16.Wu SS, Chein CY, Wen YH. Analysis of Ciprofloxacin by a Simple High-Performance Liquid Chromatography Method. J Chromatogr Sci. 2008;46:490–5. doi: 10.1093/chromsci/46.6.490. [DOI] [PubMed] [Google Scholar]


