

Abstract
The present study aimed at verifying the usefulness of dietary 2.5% bee-pollen (BP) or propolis (PROP) to overcome the genotoxic and endocrine disruptive effects of malathion polluted water in Oreochromis niloticus (O. niloticus). The acute toxicity test was conducted in O. niloticus in various concentrations (0–8 ppm); mortality rate was assessed daily for 96 h. The 96 h-LC50 was 5 ppm and therefore 1/5 of the median lethal concentration (1 ppm) was used for chronic toxicity assessment. In experiment (1), fish (n = 8/group) were kept on a diet (BP/PROP or without additive (control)) and exposed daily to malathion in water at concentration of 5 ppm for 96 h “acute toxicity experiment”. Protective efficiency against the malathion was verified through chromosomal aberrations (CA), micronucleus (MN) and DNA-fragmentation assessment. Survival rate in control, BP and PROP groups was 37.5%, 50.0% and 100.0%, respectively. Fish in BP and PROP groups showed a significant (P < 0.05) reduction in the frequency of CA (57.14% and 40.66%), MN (53.13% and 40.63%) and DNA-fragmentation (53.08% and 30.00%). In experiment (2), fish (10 males and 5 females/group) were kept on a diet with/without BP for 21 days before malathion-exposure in water at concentration of 0 ppm (control) or 1 ppm (Exposed) for further 10 days “chronic toxicity experiment”. BP significantly (P < 0.05) reduced CA (86.33%), MN (82.22%) and DNA-fragmentation (93.11%), prolonged the sperm motility when exposed to 0.01 ppm of pollutant in vitro and increased the estradiol level in females comparing to control. In conclusion, BP can be used as a feed additive for fish prone to be raised in integrated fish farms or cage culture due to its potency to chemo-protect against genotoxicity and sperm-teratogenicity persuaded by malathion-exposure.
Keywords: Genotoxicity, Malathion, Nile tilapia, Pollen, Propolis
Introduction
Fish are being used as useful genetic models for evaluation of pollution in aquatic ecosystems. Fish as bio-indicators of pollutant effects are very sensitive to the changes in their environment and play significant roles in assessing potential risk associated with contaminations of new chemicals in aquatic environment [1]. The sub-lethal toxicity of pesticides decreases plankton abundance and water quality in fish ponds [2]. Moreover, pesticides have been noticed to interfere with fish health and reproduction [3].
Malathion (O, O-dimethyl phosphorodithioate of diethyl mercaptosuccinate) is a colorless to amber liquid with a skunk- or garlic-like odor [4]. It is a broad-spectrum insecticide widely used to control a variety of outdoor insects in both agricultural and residential settings [5] because of its effectiveness and shorter duration in the aquatic environment. In soil, malathion is not considered a persistent pesticide (log Kow 2.89, half-life 1–10 days) [6]. In water, the half-life of malathion has been estimated as 1.65 days at pH 8.16 and 17.4 days at pH 6.0 [7]. The degradation rate of malathion has been found to be 0.017 ppm/h [8]. Degradation of malathion in river, ground and seawater (avg. t1/2 = 4.7 d) is controlled by an elimination reaction, photolysis and biodegradation [9]. Malathion tends to be relatively non-mobile in aqueous environment because it absorbs into sediments [10] and once adsorbed it is typically degraded within 3 days [11].
When malathion is introduced into the environment, it may cause serious intimidation to the aquatic organisms as well as severe metabolic disturbances in non-target species like fish and fresh-water mussels [6]. Sub-lethal doses of malathion in Nile tilapia lead to a decrease in fish growth rate and deterioration in their physiological condition. Higher concentrations of this pesticide lower the production and profitability of freshwater fish farms [2]. O. niloticus exposed to malathion in feed (0.17 mg/kg) for long term (120 days) exhibits an alternation of sex steroid hormones, degenerative changes in gonads and poor milt quality [12].
Diverse methods have been adopted for evaluating the potential toxicological effects of aquatic pollutants. The incidence of micronuclei in fish peripheral erythrocytes [7], comet assay [13] as well as mitotic chromosomes of the head kidney [14] have been used as an imperative tool for monitoring genotoxicity in aquatic environments.
The frequency of micronucleus (MN) in the peripheral blood erythrocytes is one of the best established in vivo cytogenetic assays in the field of genetic toxicology, providing a convenient and reliable index of both chromosome breakage and chromosome loss [15]. Therefore, MN is recommended to be conducted as a part of the monitoring protocols in aquatic toxicological assessment programs [16].
Teleost head kidney (HK) has been considered as a haemopoietic organ similar to the bone marrow of higher vertebrates characterized by high proportion of actively dividing cells [17]. Standard procedures for mitotic chromosomal preparation from the HK tissue have been used to gain information about the nature and extent of the damage that may be produced by in vivo treatments [18]. The mitotic chromosomes from the HK of the fish Tilapia niloticus have been studied with an initiative to gain information about the nature and extent of the damage that may be produced by in vivo treatments [14].
Liver is the major site of xenobiotic accumulation and bio-transformation, analyses of initial molecular lesions elicited by pollutants in this organ gives early-warning and sensitive indicator of chemical induced carcinogenic lesions [19]. So, it was reliable to use the liver cells as an indicator for the genotoxic effect of malathion using comet assay.
Nowadays, a great concern is directed toward the use of natural products for improving fish health status, and consequently increasing the resistance to stressors including pollutants. Flavonoids are naturally produced in plants and stored in different forms such as propolis [20]. The biological activities of propolis depend on the presence of flavonoids, aromatic acids, diterpenic acids and phenolic compounds which have important pharmacological properties. Propolis is an alternative dietary antibiotic [21] that is effective against a variety of bacteria [22], viruses [23] and fungi [24], and is beneficial for improving the performance and immunity [25].
Bee pollen is considered as one of nature’s most completely nourishing foods since it contains essential substances such as carbohydrates, proteins, amino acids, lipids, vitamins, mineral substances and trace elements [26]. The main bioactive compounds reported from bee pollen are phenolic compounds and specifically quercetin, kaempferol, caffeic acid [27] and naringenin [28]. Globally bee pollen has been reported to provide a diverse array of bioactivities, such as anti-proliferative, anti-allergic, antibiotic, anti-diarrheic and antioxidant activities [29,30].
The present work aimed at verifying the protective effect of honeybee products (propolis and pollen) supplemented in the feed of Nile tilapia (Oreochromis niloticus) against the genotoxic and reproduction disruptive effects of acute and chronic exposure to malathion polluted water.
Material and methods
Fish
Oreochromis niloticus (O. niloticus) was obtained from a private fish farm in the Kafr El Sheikh Governorate, Egypt. They were stocked in fiberglass 750 L-tanks (n = 50 of both sex/tank) supplied with continuous aerated dechlorinated water (26 ± 2 °C) at the Faculty of Veterinary Medicine, Benha University, Egypt. Fish were fed with commercial pelleted diet (JOE Trade, Cairo, Egypt) at 5% of their body weight daily and kept for two months until they reached a mean weight of 63 g. The chemical compositions and proximate analysis of the ingredients used in the commercial diet (crude protein 30%) are shown in Table 1. Uneaten food particles and excreta were removed by the daily siphoning with exchanging of about 30% of the water. Fish were routinely monitored for health status and were sampled every two weeks for adjusting the daily diet requirements. All study protocols and all procedures were approved by the Committee of Graduate Studies and Research of Faculty of Veterinary Medicine, Benha University (place where experiments were conducted) as well as Ethical Research Committee of National Research Centre (where genetic assessment was achieved).
Table 1.
Composition and proximate analysis of basal diet.
| Ingredients | (g/1000 g total diet) |
| Fish meal | 100 |
| Wheat bran | 150 |
| Corn | 300 |
| Soybean | 407 |
| Vegetable oil | 40 ml |
| Mineral and Vitamin mixture* | 3 g |
| Total | 1000 |
| Composition | Proximate analysis (%) |
| Dry matter | 86.8 |
| Crude protein | 30 |
| Ether extract | 12.9 |
| Crude fiber | 4.8 |
| Ash | 5.2 |
| Gross energy (kcal/kg) | 4477.7 |
Diet preparation and feeding regimen
Honeybee pollen granules and propolis were kindly supplied by honeybee project, Faculty of Agriculture, Benha University. Water extract of propolis (40%) was prepared using 10 g of the specimens that were mixed with 15 ml of deionized water and the water level marked on the tubes, then shaked at 95 °C for 2 h in a water bath, and cooled to room temperature, water was added to the marked level and the contents centrifuged at 1400g to obtain the supernatant [31].
Crushed commercial basal diet was divided into three portions. The first one was left as control, while the second and third portions were thoroughly mixed with crude bee pollens (BP) and propolis-water extract (PROP) at concentration of 2.5% (w/w), respectively. Adequate amount of water was added to the ingredients of each diet to produce stiff dough and re-pelleted. The moist pellets were left for 24 h at room temperature for dryness, then packed and stored at 4 °C until used [32].
Stocked fish were randomly assigned to one of three treatment groups that were hand-fed with either basal diet, 2.5% BP or 2.5% PROP supplemented diets at twice daily (8 a.m. and 6 pm) at 3% of body weight for 21 days. Water temperature was maintained at 26 ± 2 °C, the excreta and uneaten food particles were siphoned daily and about half of the water was daily changed with will aerated water from stock.
Experiment I: (effect of pollen and propolis in controlling mortality and genotoxicity in O. niloticus exposed to lethal concentration (96 h-LC50)
Determination 96 h LC50 of malathion
An emulsifiable concentrate of malathion 57% (El Nasr co. for intermediate chemicals, Egypt) was used in this study. Acute toxicity assay to determine the 96 h-LC50 (median lethal dose) of malathion was conducted with definitive test by the static renewal bioassay method. Briefly, eight groups each of ten fish were randomly exposed to various concentration of malathion (1, 2, 3, 4, 5, 6, 7 and 8 mg/l (ppm)) in water (26 ± 2 °C) for 96 h without food supplementation to avoid the undesirable effect of excreta and feed [33]. Another group of 10 fish were also simultaneously maintained in dechlorinated water (0 mg/l) as the control. Daily water exchange and reconstitution of malathion level were carried out. The mortality rate (%) was assessed at 24, 48, 72 and 96 h post-exposure. The median lethal concentration (LC50) of malathion was calculated from the data obtained in acute toxicity bioassays following the Finney’s probit analysis method [34] and the Dragstedt-Beheren’s equation [35] as mentioned by Bhargava and Rawat [36]. The concentration at which 50% mortality occurred in malathion treated fishes was taken as the median lethal concentration (LC50) for 96 h, which was 50 mg/l. One fifth of the LC50 value (10 mg/L) was taken for the sub-lethal studies according to Sprague [37].
Genoprotective efficacy of pollen and propolis
Fish groups (control, pollen and propolis) were allotted into 3 replicate tanks (n = 8 fish/tank) and assigned into two main classes: malathion non-exposed i.e. groups treated with to 0 ppm (Class I; C, Gr1, Gr2 groups) and malathion exposed i.e. groups exposed to 5 mg/l (5 ppm) malathion (Class II; Gr3, Gr4, Gr5 groups) for 96 h (Table 2). Exchange of water (at temperatures of about 26 ± 2 °C) and reconstitution of pesticide level was carried out daily while no food was provided to fish during the exposure period. Behavioral changes, clinical signs, mortality rate and postmortem lesions were investigated daily [38]. At the end of the exposure period, a random fish samples (n = 5/group) from all treated groups were collected for chromosomal aberrations, micronucleus test and DNA fragmentation analysis.
Table 2.
Fish grouping and dietary regimen of Nile tilapia (O. niloticus) acutely (Exp. 1) or chronically (Exp. 2) exposed to malathion in water and supplemented with 2.5% bee pollen or propolis.
| Class | Fish group | Abbreviation | n | Diet composition before exposure | Dose of malathion | Duration of exposure | Protocol after exposure | |
|---|---|---|---|---|---|---|---|---|
| Experiment 1 | ||||||||
| Total period of the experiment was 25 days consisted of pre-exposure period (21 days) and exposure period (4 days) | Control (non malathion exposed groups) | Control | C | F = 8, M = 0 | Basal commercial pelleted diet | 0 mg/l (0 ppm) | 96 h | Genoprotective investigation: five fish from each group were investigated through evaluation of chromosomal aberrations, frequency of micronuclei and DNA fragmentation |
| Bee pollen | Gr1 | F = 8, M = 0 | Basal diet with 2.5% bee pollen | 0 mg/l (0 ppm) | 96 h | |||
| Propolis | Gr2 | F = 8, M = 0 | Basal diet with 2.5% Propolis | 0 mg/l (0 ppm) | 96 h | |||
| Exposed (Malathion exposed groups) | Control | Gr3 | F = 8, M = 0 | Basal commercial pelleted diet | 5 mg/l (5 ppm) | 96 h | ||
| Bee pollen | Gr4 | F = 8, M = 0 | Basal diet with 2.5% bee pollen | 5 mg/l (5 ppm) | 96 h | |||
| Propolis | Gr5 | F = 8, M = 0 | Basal diet with 2.5% Propolis | 5 mg/l (5 ppm) | 96 h | |||
| Experiment 2 | ||||||||
| Total period of the experiment was 31 days consisted of pre-exposure period (21 days) and exposure period (10 days) | Control (non malathion exposed groups) | Control | T1 | F = 10, M = 5 | Basal commercial pelleted diet during whole exerimental period | 0 mg/l (0 ppm) | 10 days | 1 – Genoprotective investigation: five females from each group were investigated through evaluation of chromosomal aberrations, frequency of micronuclei and DNA fragmentation 2 – semen analysis: five males from T1, T3, T4, T5 groups were used. 3 – hormonal assay: five males and five females of T1, T3, T4, T5 groups were used |
| Bee pollen | T2 | F = 10, M = 5 | Basal diet with 2.5% bee pollen during whole experimental period | 0 mg/l (0 ppm) | 10 days | |||
| Exposed (Malathion exposed groups) | Control | T3 | F = 10, M = 5 | Basal commercial pelleted diet during whole exerimental period | 1 mg/l (1 ppm) | 10 days | ||
| Bee pollen | T4 | F = 10, M = 5 | Basal diet with 2.5% bee pollen during whole experimental period | 1 mg/l (1 ppm) | 10 days | |||
| Pre-supplemented with bee pollen | T5 | F = 10, M = 5 | Basal diet with 2.5% bee pollen during for 21 days before malathion exposure and re-supplementation with basal diet during exposure period (10 days) | 1 mg/l (1 ppm) | 10 days | |||
Chromosome aberrations (CA)
Fish was injected with yeast suspension at a dose of 1 ml/100 g BW [39]. 24 h later; specimens were injected intramuscularly with freshly prepared colchicine at a dose of 0.01 ml of 0.03 mg/g BW. Head kidney samples were prepared using squash technique for studying chromosomal aberrations [40]. At least 50 metaphase spreads were examined per sample and the CA were detected using light microscope (×100). CA was expressed as the percentage of aberrant cells and total aberrations per sample.
Micronucleus preparation (MN)
A drop of blood collected from the caudal vein was mixed with a drop of fetal calf serum and smeared directly on slide then air dried, fixed in absolute methanol for 5 min and stained with 5% Giemsa for 7 min. 2000 cells per fish were analyzed for the frequency of MN in mature erythrocytes. The erythrocytes of O. niloticus were generally observed as round with a centrally located round nucleus and a considerable amount of cytoplasm. The diameter of the micronucleus (MN) was less than one-third of the main nucleus, separated from or marginally overlapped with main nucleus and had similar staining as the main nucleus. The number of MN was expressed per thousand erythrocytes [41].
DNA fragmentation test (DNA-frag)
Liver of fish was collected for DNA-frag quantification by diphenylamine (DPA) method according to Gibb et al. [42]. The amounts of both fragmented and intact DNA were determined by spectrophotometer that was set at 600 nm.
The fragmentation of DNA was calculated according to the equation
The reduction percentage in number of CA, MN or DNA-fragment were calculated according to the following formula [43]
where A = treatment, B = anti-mutagenic mixed with treatment and C = control.
Experiment II: (effect of pollen in controlling genotoxic and endocrine disruptive effects of sub-lethal dose of malathion in O. niloticus).
Based on the effectiveness of BP in controlling the acute toxicity of malathion, five fish groups: 2 control (T1 & T3) and 3 BP 2.5%-treated (T2, T4 & T5) (n = 10 males and 5 females/group) were assigned into two classes: malathion non-exposed groups (Class I; T1 & T2) and malathion exposed groups (Class II; T2 & T4). The later clasśs groups were exposed to 1 ppm malathion for 10 day. T5 group received BP diet for 21 days and was maintained on basal diet thereafter during malathion exposure (Table 2).
Water (set at 28 ± 1 °C) was exchanged, pesticide level was reconstituted as well as the excreta and/or uneaten food was siphoned daily.
Chromosome aberrations, micronucleus preparation and DNA fragmentation test
At the end of exposure to sub-lethal concentration of malathion (1 ppm), samples for studying CA, MN and DNA-frag were taken from each group and processed as mentioned before.
Semen characteristics and in vitro sperm motility
Semen (milt) samples were stripped from males (n = 5/group) by gentle pressure of the abdomen. During collection, special care was paid to collect all the available semen and to avoid any contamination by fecal matter, urine, blood, or scales. Semen samples were assessed by one observer as described previously [44]. Samples were diluted with sterile water for individual motility evaluation. Sperm cell concentration was evaluated by using a hemocytometer. For dead sperm count and sperm morphology, a smear was prepared from a mixture of diluted semen and eosin–nigrosin stain.
Protective efficacy of pollen on in vitro sperm motility against malathion water pollution
To verify the effect of in vitro malathion exposure on sperm motility after 2.5% pollen supplementation, milt collected from male O. niloticus (n = 5/group) received either basal diet (control) or pollen incorporated diet (pollen group) for three weeks was used. Milt was diluted 2:498 (v/v) in distilled water contained malathion of selected concentration (0.01, 0.10 and 1.00 ppm). 5 μl of the activated malathion-treated samples were transferred into glass slide, covered with a coverslip and immediately videotaped for 15 s. Initial motility (0 s) and motility after 20 s of exposure were scored and the duration of motility (sec) was recorded at 0, 30 and 60 s. Motility score was assessed as a percentage of the total number of spermatozoa following 10 s period of activation. The scoring is based on a subjective scale between 0 and five; zero being no motility and five maximum (80–100%).
Serum samples and hormonal analysis
At the end of the experiment, blood samples were collected from 5 fish per group. A sample of 1 ml whole blood was drawn from the caudal vein using syringe fitted with a 27G needle containing 0.1 ml of saline without anti-coagulant. Collected samples were centrifuged at 1400g for 15 min and the separated serum was used for hormonal estimation of follicle stimulating hormone (FSH), luteinizing hormone (LH), estradiol and testosterone in both male and female O. niloticus.
FSH was evaluated with Fish ELISA Kit (Catalog No: E0830f, EIAab®, Wuhan, China). The minimum detectable dose of fish FSH was less than 0.039 mIU/ml. Detection range 0.156–10 mIU/ml. LH was evaluated with LH ELISA Kit (Catalog No. CSB-E15791Fh, Cusabio Biotech Co., Ltd®, Wuhan, Hubei, China). The minimum detectable dose of fish LH was less than 2.5 mIU/ml.
Estradiol and testosterone were measured using commercially available kit (IBL, Hamburg, Germany), following the immunoenzymatic method in ELISA reader (Merck, Japan). The sensitivity of the estradiol assay (Catalog No. RE52041, IBL, Hamburg, Germany) was 9.71 pg/ml and the intra- and inter-assay coefficients of variation (CVs) were 2.7% and 7.2%, respectively. The sensitivity of the testosterone assay (Catalog No. RE52151, IBL, Hamburg, Germany) was 0.083 ng/mL, and the intra- and interassay coefficients of variation (CVs) were 3.3% and 6.7%, respectively.
Statistical analysis
Statistical analysis was performed with SPSS (ver. 16.0.2) software. Data were analyzed using one-way analysis of variance (ANOVA) followed by Duncan’s post hoc test for comparison between different treatments. Results were reported as mean ± S.E. and differences were considered as significant when P < 0.05.
Results
Experiment I: Effect of pollen and propolis in controlling mortality and genotoxicity in O. niloticus exposed to lethal concentration (96 h LC50).
Determination 96 h LC50 of malathion
Analysis of the data obtained after exposure of O. niloticus to different concentration of malathion for 96 h revealed that the 96 h-LC50 was 5 ppm and therefore 1/5 of the median lethal concentration (1 ppm) was used for chronic toxicity assessment.
Protective effect of honeybee products against health distress of malathion
Survival rate in fish fed on control, PROP and BP supplemented diets was 37.5%, 50% and 100%, respectively. During exposure to malathion for 96 h, health distress signs were lower in intensity in propolis treated group. Pollen treated fish were apparently normal except for slight congestion of the liver. Malathion exposed fish that maintained on control diet exhibited respiratory distress such as surfacing, frequent and rapid respiratory movement with opened mouth and erratic swimming movement. Skin was covered with excess mucus secretion and gills were congested and showed an accumulation of mucus secretion. Internally, liver, spleen and kidney were congested.
Chromosome aberrations assays
The typical metaphase complements of O. niloticus fish were found to consist of 44 chromosomes of different types as submetacentric, subtelocentric and telocentric. Besides, various forms of chromosome abnormalities as chromatid gaps, breaks, deletions, fragments, centromeric attenuation, endomitosis and aneuploidy were recorded (n ± 1 or 2).
The incorporation of BP (Gr1) and PROP (Gr2) in fish diet at the given concentration (2.5%) did not have mutagenic effects, as there was no significant difference in the rate of chromosomal aberrations when compared with control (C) (9.00 ± 0.71 and 9.40 ± 1.12 vs. 7.00 ± 1.05, respectively). Moreover, BP and PROP significantly (P < 0.05) reduced the frequency of CA induced after acute malathion exposure by 57.14% and 40.66%, respectively (Table 3).
Table 3.
Protective effects of bee pollen and propolis against acute malathion exposure (5 ppm) induced different types of chromosomal aberrations in fish head kidney cells of Oreochromis niloticus.
| Treatment classes | Group abbrev. | Types of chromosomal aberrations |
TCA | Reduction% | |||||||
|---|---|---|---|---|---|---|---|---|---|---|---|
| Gap | Break | Deletion | Fragment | C.A | End. | Aneuploidy | |||||
| Class I: Malathion Non-exposed | Control + 0 ppm Mal. | C | 0.80 ± 0.37c | 0.00 ± 0.00c | 0.40 ± 0.24c | 0.80 ± 0.37c | 1.60 ± 0.68c | 0.00 ± 0.00b | 3.40 ± 0.40a | 7.00 ± 1.05c | |
| Pollen + 0 ppm Mal. | Gr1 | 1.20 ± 0.58cb | 0.20 ± 0.20c | 0.80±.37c | 1.20 ± 0.20c | 2.60 ± 0.40cb | 0.00 ± 0.00b | 3.00 ± 0.63a | 9.00 ± 0.71c | ||
| Propolis + 0 ppm Mal. | Gr2 | 1.00 ± 0.55c | 0.40 ± 0.24c | 0.80 ± 0.37c | 0.60 ± 0.24c | 3.80 ± 0.66ab | 0.00 ± 0.00b | 2.80 ± 0.37a | 9.40 ± 1.12c | ||
| Class II: Malathion Exposed | Control + 5 ppm Mal. | Gr3 | 3.00 ± 0.55a | 3.00 ± 0.55a | 4.80 ± 0.58a | 4.20 ± 0.73a | 5.20 ± 0.97a | 1.00 ± 0.44a | 4.00 ± 0.89a | 25.20 ± 2.22a | |
| Pollen + 5 ppm Mal. | Gr4 | 2.80 ± 0.66ab | 1.60 ± 0.24b | 3.20 ± 0.48b | 1.40 ± 0.24cb | 2.80 ± 0.49cb | 0.20 ± 0.20b | 2.80 ± 0.37a | 14.80 ± 1.36b | 57.14% | |
| Propolis + 5 ppm Mal. | Gr5 | 3.00 ± 0.55a | 1.60 ± 0.24b | 4.00 ± 0.31ab | 2.40 ± 0.24b | 3.00 ± 0.63cb | 0.80 ± 0.37ab | 3.00 ± 0.55a | 17.80 ± 0.66b | 40.00% | |
C.A, End and TCA indicated Centromere attenuations, Endomitosis and total chromosomal aberrations, respectively. Mal.: malathion. Data were expressed as mean ± S.E. (n = 5 per each group) Values with different superscript letters (a, b, c) were significantly different (P < 0.05).
Break chromosomal (BCA) and centromeric attenuations (C.A.) were significantly (P < 0.05) decreased in BP (Gr4) and PROP (Gr5) groups (protected) than control group (Gr3). In the meantime, malathion exposure significantly (P < 0.05) increased gap chromosomal aberrations (GCA) in control (Gr3) as well as BP (Gr4) and PROP (Gr5) groups compared with non-exposed groups (C, Gr1, Gr2). BP group (Gr4) showed a significant (P < 0.05) decrease in deletion chromosomal (DCA) and endomitosis aberrations. Whereas PROP group (Gr5) had a significant (P < 0.05) lower fragment chromosomal aberration (FCA) in comparison with control group (Gr3).
Micronucleus assay
The size and position of micronuclei in the cytoplasm showed slight variation and normally one micronucleus per cell was observed. Malathion induced a significant (P < 0.05) increase in the frequency of MN in Gr3 group (fed a standard commercials diet) as compared with a placebo control (C) (9.00±.83 vs. 2.60 ± 0.40), confirming its genotoxic potential to fish. Feeding of BP (Gr4) and PROP (Gr5) significantly reduced the frequency of MN as compared with positive control (Gr3) by 53.13% and 40.63%, respectively, but still remains higher than in unexposed (negative) controls (Table 4).
Table 4.
Protective effects of bee pollen and propolis against acute malathion exposure (5 ppm) induced micronuclei (MN) and fragmentation liver DNA of Oreochromis niloticus.
| Treatment Classes | Treatment groups | Abbrev. | Erythrocytes MN (%) | Reduction% | Liver DNA fragmentation (%) | Reduction% |
|---|---|---|---|---|---|---|
| Class I: Malathion Non-exposed | Control + 0 ppm Mal. | C | 2.60 ± 0.40c | 10.73 ± 0.64d | ||
| Pollen + 0 ppm Mal. | Gr1 | 1.80 ± 0.37c | 9.46 ± 0.33d | |||
| Propolis + 0 ppm Mal. | Gr2 | 2.80 ± 0.37c | 10.79 ± 0.27d | |||
| Class II: Malathion Exposed | Control + 5 ppm Mal. | Gr3 | 9.00 ± 0.83a | 20.32 ± 0.57a | ||
| Pollen + 5 ppm Mal. | Gr4 | 5.60 ± 0.60b | 53.13% | 15.23 ± 0.37c | 53.08% | |
| Propolis + 5 ppm Mal. | Gr5 | 6.40 ± 0.51b | 40.63% | 17.38±.55b | 30.00% | |
Data were expressed as mean ± S.E (n = 5/group). Values with different superscript letters (a, b, c) within the same column were significantly different at P < 0.05.
DNA fragmentation assay
Analysis of DNA-frag demonstrated a non-significant difference in DNA-frag between BP (Gr1) and PROP (Gr2) fed groups (9.46 ± 0.33 and 10.79 ± 0.27) and that of those fed basal diet (C) (Table 2). DNA-frag was significantly (P < 0.05) elevated in Gr3 when compared with control (C) (20.23 ± 0.57 vs. 10.73 ± 0.64). Dietary BP (Gr4) and PROP (Gr5) significantly (P < 0.05) reduced the percent of DNA-frag induced by acute malathion exposure (53.08% and 30.00%, respectively) (Table 4).
Experiment II (effect of pollen in controlling genotoxic and endocrine disruptive effects of sub-lethal dose of malathion in O. niloticus).
Chromosomal aberrations
Pollen supplementation in chronic malathion exposed group (T4) significantly reduced the total CA by 86.33%, accorded to those fed basal diet under the same condition (T3) and reached to levels near to that in non-exposed groups (T1, T2) (Table 5).
Table 5.
Protective effects of bee pollen against chronic malathion exposure (1 ppm) induced different types of chromosomal aberrations in fish head kidney cells of Oreochromis niloticus.
| Treatment classes | Treatment groups | Abbrev. | Types of chromosomal aberrations |
TCA | Reduction% | ||||||
|---|---|---|---|---|---|---|---|---|---|---|---|
| Gap | Break | Deletion | Fragment | C.A | End. | Aneuploidy | |||||
| Class I: Malathion non exposed | Control + 0 ppm Mal. | T1 | 1.20 ± 0.20b | 0.20 ± 0.20c | 0.20 ± 0.20c | 0.80 ± 0.20c | 1.60 ± 0.68b | 0.00 ± 0.00b | 2.60 ± 0.24b | 6.60 ± 0.75c | |
| Pollen + 0 ppm Mal. | T2 | 1.20 ± 0.49b | 0.40 ± 0.24c | 0.60 ± 0.24c | 1.20 ± 0.20c | 1.80 ± 0.58b | 0.00 ± 0.00b | 2.80 ± 0.48ab | 8.00 ± 0.55c | ||
| Class II: Malathion Exposed | Control + 1 ppm Mal. | T3 | 3.60 ± 0.68a | 3.80 ± 0.37a | 7.80 ± 0.73a | 4.20 ± 0.37a | 5.00 ± 1.00a | 1.20 ± 0.37a | 4.40 ± 0.93a | 30.00 ± 1.38a | |
| Pollen + 1 ppm Mal. | T4 | 1.60 ± 0.51b | 0.60 ± 0.24c | 1.40 ± 0.60c | 1.60 ± 0.20b | 2.20 ± 0.37b | 0.00.±0.00b | 2.40 ± 0.24b | 9.80 ± 0.33c | 86.33% | |
| Pre-exposure Pollen supplement + 1 ppm Mal. | T5 | 2.20 ± 0.49ab | 2.60 ± 0.51b | 4.80 ± 0.80b | 1.60 ± 0.24cb | 3.60 ± 0.68ab | 0.40 ± 0.24b | 3.00 ± 0.32ab | 20.20 ± 0.80b | 41.88% | |
C.A, End and TCA indicated Centromere attenuations, Endomitosis and total chromosomal aberrations, respectively. Mal.: malathion. Data were expressed as mean ± S.E. (n = 5 per group) Values with different superscript letters (a, b, c) were significantly different (P < 0.05).
In the meantime, the mean value of CA in fish group supplemented with BP prior to toxin exposure (T5) was comparatively lower than T3 group (20.20 ± 0.80 vs. 30.00 ± 1.38), but still significantly higher when compared with unexposed groups (T1, T2).
Fish of T5 group showed a lowered Gap (GCA), fragment (FCA), centromeric attenuations (CA), endomitosis (End.), aneuploidy (ACA) and chromosomal aberrations that were likely similar to those fed BP in diet during Malathion exposure (T4). In the meantime, values of GCA, CA and ACA were not significantly different from T3 group (those non-protected malathion exposed).
Micronucleus assay
Pollen feed additive during chronic malathion exposure (T4) significantly (P < 0.05) reduced the genotoxicity of the toxin (T3) by 82.22% (Table 6). Such effect was also noticed in T5 group which was given BP before toxin treatment, but in lower rate (44.44%).
Table 6.
Protective effects of bee pollen against chronic malathion exposure (1 ppm) induced micronuclei (MN) in erythrocytes and fragmentation in liver DNA of Oreochromis niloticus.
| Treatment classes | Treatment groups | Abbrev. | Erythrocytes MN (%) | Reduction (%) | Liver DNA fragmentation (%) | Reduction (%) |
|---|---|---|---|---|---|---|
| Class I: Malathion non-exposed | Control + 0 ppm Mal. | T1 | 2.00 ± 0.32c | 10.33 ± 0.52c | ||
| Pollen + 0 ppm Mal. | T2 | 1.80 ± 0.20c | 9.24 ± 0..37c | |||
| Class II: Malathion exposed | Control + 1 ppm Mal. | T3 | 11.00 ± 0.84a | 25.29 ± 0.73a | ||
| Pollen + 1 ppm Mal. | T4 | 3.60 ± 0.40c | 82.22% | 11.36 ± 0.67c | 93.11% | |
| Pre-exposure pollen supplement + 1 ppm Mal. | T5 | 7.00 ± 0.55b | 44.44% | 18.03 ± 1.05b | 48.53% |
Data were expressed as mean ± S.E (n = 5/group). Values with different superscript letters (a, b, c) within the same column were significantly different at P < 0.05.
DNA fragmentation assay
The integration of BP in fish diet (T4) significantly (P < 0.05) reduced DNA-frag when introduced to malathion for 10 days by 93.11%. A continual protective effect of BP against DNA-frag was observed in T5 group (fed BP before toxin exposure) in terms of reduction of DNA-frag by 48.53 (Table 6).
Effect of pollen on semen characteristics after chronic malathion exposure
Assessment of the changes in milt characteristics of O. niloticus after exposure to sub-lethal dose of malathion for 10 days did not reveal any significant difference between the non-exposed (T1) and exposed groups (T3–T5) in terms of sperm cell concentration (Fig. 1A). Semen liveability appeared non-significantly differ after toxin treatment in BP supplemented groups (T4, T5) when compared to that in negative control (T1). Meanwhile, the positive control (T3) appeared the significantly (P < 0.01) lowest among treated groups (Fig. 1B). Head abnormalities showed tendency to differ between groups (P = 0.09). However, it was lower in T4 (BP fed) than T1 (P < 0.05), T3 (P ⩽ 0.05) and T5 (P = 0.09) groups (Fig. 1C). Tail abnormalities showed tendency to differ between groups (P = 0.06), however it was lower in T4 (BP fed) than T1 (P < 0.05) and T3 (P = 0.08) groups (Fig. 1D).
Fig. 1.
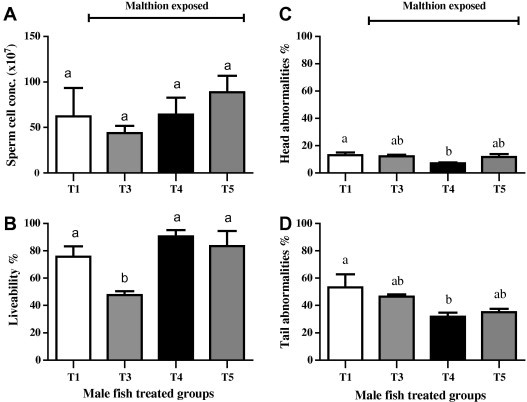
Semen characteristics in male Nile tilapia (O. niloticus) after exposure to 1 mg/l (1 ppm) of malathion for 10 days. T1 (□) was negative control (unexposed, fed basal diet). T3 () was positive control (exposed, fed basal diet). T4 () and T5 () were pollen fed, but the later was returned to diet during toxin treatment. Values (mean ± SE; n = 5 per group) with different letters were significantly different at P < 0.05.
Protective efficacy of pollen on in vitro sperm motility against malathion water pollution
In Fig. 2 malthion at 0.10 and 1.00 ppm was highly toxic and suppressive to sperm activity in control and pollen groups though clear numerical differences between groups still present. Sperms of BP fed group exposed to 0.10 ppm of toxin displayed a significant (P < 0.05) a longer motility duration at 0 s. On the other hand, feeding of BP prior to malathion 0.01 ppm treatment significantly improved initial motility (P < 0.01) and motility after 20 s (P < 0.05) of exposure as well as maintained sperm motility for longer duration (P < 0.05).
Fig. 2.
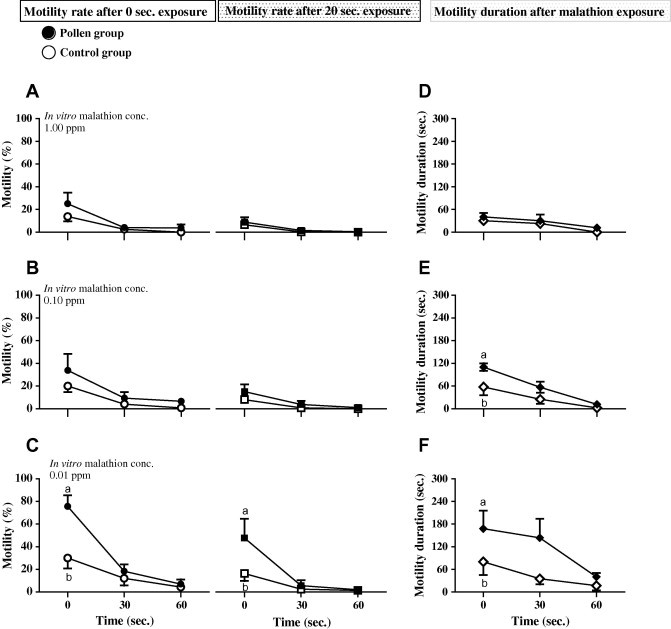
Effect of in vitro malathion exposure on motility rate (A–C) and duration (D–F) of male Nile tilapia (O. niloticus) semen fed control (○) or pollen (•) diet. Seminal fluid (2 μl) was diluted in distilled water (498 μl) contained malathion of selected concentration (1.00, 0.10 and 0.01 ppm). Initial motility (0 s.) and motility after 20 s. of exposure as well as the duration of motility (sec.) at 0, 30 and 60 s. were scored. Motility score was assessed as a percentage of the total number of spermatozoa following 10 s period of activation. Data were expressed as mean ± SE (n = 5) with different letters at the same time point were significantly different at P < 0.05 as compared with control.
Hormonal changes
Pituitary gonadotrophic hormones
LH and FSH in male and FSH in female O. niloticus did not differ significantly in malathion exposed groups even with pre-pollen (T5) or pollen (T4) supplementation, as compared to control non-exposed group (Fig. 3A, B and F, respectively).
Fig. 3.
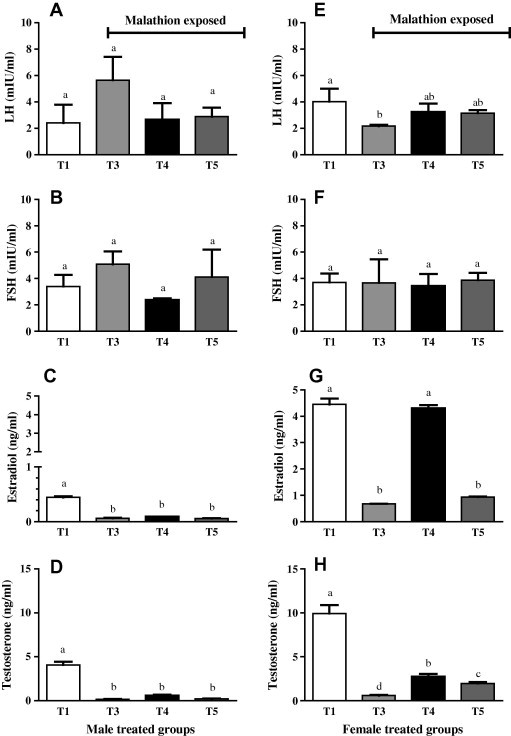
Changes in serum gonadotrophic and steroid hormones in male and female Nile tilapia (O. niloticus) fed basal diet (T1, T3), pollen (T4) or retrieved to basal diet after pre-feeding with pollen (T5). Fish in T3 (), T4 () and T5 () were exposed to 1 mg/l (1 ppm) of malathion for 10 days while T1 (□) was left as non-exposed control. Data were expressed as mean ± SE (n = 5 per group) with different letters were significantly different at P < 0.05.
In female O. niloticus, LH was considerably (P ⩽ 0.05) lowered in positive control group (T3). In the meantime, LH in T4 (exposed-pollen) and T5 (exposed-control with BP pre-supplement) was not significantly differed from negative control (T1) group (Fig. 3E).
Gonadal steroid hormones
Estradiol
Male exposed groups to malathion exhibited a significant (P < 0.05) decrease in estradiol levels compared with T1 group (control none-exposed). In the meantime, the lowered estradiol level tended (P = 0.07) to be significantly higher in BP fed group as compared to T3 group (control exposed) (Fig. 3C).
Female O. niloticus of T1 (control non-exposed) and T4 (pollen exposed) displayed a highly significant (P < 0.001) increase in estradiol levels as compared with those groups (T3, T5) exposed to malathion and fed basal diet (Fig. 3G).
Testosterone
All male malathion exposed groups including those fed BP (T3–T5) had significantly (P < 0.05) lowered testosterone levels compared to T1 group (control non-exposed) (Fig. 3D).
In female O. niloticus, there was a significant (P < 0.05) rise in estradiol level in T4 (BP) and T5 (pre-exposure pollen fed) groups as compared with T3 (positive control), though it was so far (P < 0.01) from those recorded in T1 group (Fig. 3H).
Discussion
The aquatic environment plays a vital role for functioning of ecosystem and is intimately related to human health. A majority of contaminants contain potentially genotoxic and endocrine disruptive substances. These chemicals are responsible for DNA damage in variety of aquatic organisms and fish causing malignancies, reduced survival of embryos, larvae and adults, eventually affecting the economy of fish production significantly. The present study supposed that honey bee products (propolis and pollen) are able to provide genoprotection and preserve male tilapia fecundity when acutely or chronically exposed to malathion. Acute toxicity testing is widely used in order to identify the exposure dose and the time associated with death of 50 percent of the fish (LC50) exposed to toxic materials. Current results showed that 96 h-LC50 of malathion for O. niloticus was 5 ppm and therefore 1/5 of the median lethal dose (1 ppm) was used for chronic toxicity assessment. These findings came in accordance with that the 96 h-lethal (LC50) dose for Nile tilapia was 4 mg/L [45] and the sub-lethal dose was 2 mg/L [2], but higher than that recorded in earlier studies which showed that the LC50 value for tilapia varied from 1.06 ppm [46] to 2.2 ppm [47]. In the meantime, Vittozi and De-Angelis [48] summarized the 96 h-LC50 values of malathion from 0.091 to 22.09 ppm for different species. Alkahem et al. [49] mentioned that the magnitude of toxic effects of pesticides depends on length and weight, corporal surface to body weight ration and breathing rate.
Exposure to pollutant is known to reduce the ‘fitness’ (i.e. growth, fertility and fecundity), causes mortality in fish populations, and poses risk to human health via food chain. In the current study, malathion exposed groups for 96 h showed various signs of health distress (respiratory manifestation, congestion of internal organs; gills, liver, kidney, spleen) that varied in intensity depending on feed supplement (i.e. slight in propolis group and absent in pollen group), a finding which came in association with higher survival rate (50.0% and 100%, respectively) as compared with control (37.5%). Malathion is a non-systemic, wide-spectrum organophosphate insecticide that inhibits acetylcholinesterase activity. Pollen is thought to have a wide range of health benefits. Several investigators stated that the extracts of the pollen are good scavengers of active oxygen species significantly inhibit tumor growth and enhance immunity when used as anti-tumor drug or adjuvant in the course of tumor patient’s clinic treatment [50]. Pollen also has nonspecific esterase and cholinesterases [51] which might be useful to neutralize the stopped acetylcholinesterase activity by malathion. Propolis also was found to have a partial recovery effect on brain acetylcholinesterase activity due to its content of caffeic acid phenethyl ester or partially due to its anti-oxidant effect [52]. Taken together, propolis and pollen incorporation is beneficial to facilitate the reduction of the toxic effects, to enhance the antioxidant system and to overcome the usual side effects of malathion on health status and survivability in O. niloticus.
Several techniques have been used for assessing the toxic effects of aquatic contaminants. Kumar [53] mentioned that the micronucleus test in fish erythrocyte is a sensitive indicator for evaluation and assessment of aquatic pollution with Chlorpyriphos and malathion. Chromosomal aberrations (CA) in kidney cells were studied by Al-Sabti et al. [40] in the rainbow trout exposed to detergent and benzene. Sharaf-Eldeen et al. [54] counted the fragmentation percent as indicator for DNA damage of hepatocytes in Tilapia zilli under the effect of the agricultural and industrial pollution in the River Nile. Results in the present work showed that chromosomal aberrations, frequency of micronuclei and DNA fragmentation appeared at the highest in malathion exposed group that maintained on control diet (Gr3). Such genotoxic effect of malathion was significantly (P < 0.05) reduced in BP (Gr4) and PROP (Gr5) supplemented groups (57.14% and 40.66%, 53.13% and 40.63%, 53.08% and 30.00%, respectively), and the chemo-protective efficacy of bee pollen was superior to propolis. This finding likewise to an earlier report [55] emphasized that propolis and pollen have chemoprotective potential against cisplatin induced genotoxicity in bone marrow cells of male albino mice and the chemoprotective frequency of pollen was much greater than propolis. It has been noticed that bee pollen extract contains significant amounts of polyphenolic substances mainly flavonoids [56], which have metal chelation properties [57] and sieve free radicals and genotoxic substances or carcinogenics [58]. Administration of propolis caused a significant decrease in the frequency of chromosome damage induced by chemotherapeutic agents [59]. This reduction might be, in part, due to the presence of phenolic compounds in the studied propolis, which are able to capture free radicals produced by chemotherapeutic agents [59]. These findings support their use as a safe food supplement and future chemoprotective/chemopreventive agents in aquatic organisms even though the exact mechanism is still unknown.
Bee pollen is often referred to as nature’s most complete food and current results revealed that pollen supplementation in fish diet timed with chronic malathion exposure significantly alleviated its mutagenicity close to levels recorded in non-exposed groups (T1) and that fish returned to control diet after pollen supplementation (T5) attenuated genotoxicity induced by chronic malathion in terms of reduced CA, MN and DNA-frag. This property of pollen has been ascribed first of all to its phenolic acid derivatives and polyphenolic compounds, mostly flavonoid glycosides. The flavonoids have different important physiological and pharmacological activities such as antioxidant, anti-carcinogen, anti-inflammatory and improve the endothelial function due to their intrinsic reducing capabilities [60]. Abdalla et al. [55] revealed that bee pollen have chemoprotective potential against cisplatin induced genotoxicity in bone marrow cells of male albino mice. Moreover, quercetin which is one of the main flavonoids in bee pollen antagonizes the inhibition of the hemopoietic system and reduces blood cells anemia [61]. Bee pollens were also found to be able to reduce the chromosome damage induced by the cancer drugs [62]. Our results as well as the aforementioned reports support the use of bee pollen as a safe food supplement and future chemoprotective/chemopreventive agents with sustainable activity in O. niloticus.
Pollen supplementation in male tilapia diet showed a reasonably protective value against damage to the renewing spermatogonia induced with sub-lethal dose of malathion, represented in lowering teratozoospermia (head abnormalities) and counteract the suppressive effect of in vitro exposure to 0.10 ppm of malathion on sperm activity (motility rate and duration) and suggesting that bee pollen able to ameliorate the testicular toxicity effect of malathion in fish. Earlier studies [12] in male tilapia showed that malathion meaningfully depress sperm motility, lower live-dead ratio and increased sperm abnormalities and this was associated with damage to the germ cells lining seminiferous tubules. Malathion inhibited sperm motility very quickly after exposure at relatively low, environmentally relevant concentrations (0.03 μM), through acetylcholinesterase, and cytochrome P450 activity in sperm [63]. On the other hand, it was noticed that the inclusion of bee pollen in the diet of male Nile tilapia was associated with an increase in sperm motility, sperm count and lower tail abnormalities [44].
Results in female O. niloticus revealed that co-administration of pollen at time of malathion exposure restored LH level that was significantly (P ⩽ 0.05) lowered after malathion exposure in T3 group. This finding might be attributed to its indirect action on pituitary function as a result of preserving or protecting of gonadal function against malathion toxicity. Pollen feeding to normal tilapia was associated with a marked increase in testicular weight and improved the semen quality in males, and higher egg population on the ovary in females [44]. Some authors delegated this activity to the effect of pollen on IGF-1 release, which is important for regulation of gonadal functions [64] or due to its contents form essential amino acids specially arginine which play a role in the release of insulin from pancreas, growth hormone from pituitary gland and is important in liver health [65].
In the current work, although malathion significantly suppressed estradiol and testosterone production in all male exposed groups, pollen supplementation showed a tendency (P = 0.07) to slightly increase estradiol as compared to T3 group (positive control). Pollen is the male reproductive spore of plants and the androgenic activity of bee pollen characterized by an increases testosterone levels has been shown in rats [66].
In female, the restoration of the estradiol level was very clear (P < 0.001) in pollen supplemented females exposed to malathion, while the elevation in testosterone hormone in T4 and T5 groups (pre-exposed or co-exposed pollen fed) still so far from those recorded in control non-exposed group, but higher than T3 group (positive control). These results indicated that the protective effect of pollen against endocrine disruptive effect of malathion is more evident in female O. niloticus. Equally, treatment of rats with bee pollen was associated with an increase in estradiol secretion [67]. In contrary, sub-lethal concentrations of malathion apparently affect sex steroid levels [68] and reduced the estrogen level in serum in female fish [27].
Conclusions
The multifunctional roles of bee pollen and propolis in minimizing the health hazardous of malathion (genotoxicity, endocrine disruption, mutagenicity and sperm-teratogenicity and dropped sperm activity in vitro) besides its high nutritional value acclaims the integration of pollen and propolis to the aquaculture feed specially in integrated fish farming or Agri-based systems e.g. rice-fish integration and cage culture, in which fish are susceptible for pesticides exposure.
Conflict of interest
The authors have declared no conflict of interest.
Footnotes
Peer review under responsibility of Cairo University.

References
- 1.Lakra W.S., Nagpure N.S. Genotoxicological studies in fishes: a review. Indian J Anim Sci. 2009;79:93–98. [Google Scholar]
- 2.Sweilum M.A. Effect of sublethal toxicity of some pesticides on growth parameters, haematological properties and total production of Nile tilapia (Oreochromis niloticus L.) and water quality of ponds. Aqua Res. 2006;37:1079–1089. [Google Scholar]
- 3.Mani V.G.T., Konar S.K. Pollution hazards of the pesticide chlorpyrifos on the aquatic ecosystem. Environ Ecol (India) 1988;6:460–462. [Google Scholar]
- 4.Hazardous Substances Data Bank (HSDB); Malathion; U.S. Department of Health and Human Services, National Institutes of Health, National Library Medicine: Bethesda, MD. <http://toxnet.nlm.nih.gov/cgi-bin/sis/htmlgen?HSDB>.
- 5.Heddle J.A., Salamone M.F., Hite M., Kirkhart B., Mavournin K., MacGregor J.G., Newell G.W. The induction of micronuclei as a measure of genotoxicity. Mutat Res. 1983;123:61–118. doi: 10.1016/0165-1110(83)90047-7. [DOI] [PubMed] [Google Scholar]
- 6.Environmental Protection Agency, U (EPA). Malathion. Environmental Fate and Effects; 2000.
- 7.Minissi S., Ciccoti E., Rizzoni M. Micronucleus test in erythrocytes of Barbus plebejus (Teleostei, Pisces) from two natural environments: a bioassay for the in situ detection of mutagens in freshwater. Mutat Res. 1996;367:245–251. doi: 10.1016/s0165-1218(96)90084-1. [DOI] [PubMed] [Google Scholar]
- 8.Ramsey HH. Assessment of malathion environmental kinetics using earthworm and salamander models. PhD thesis, Graduate Faculty of North Carolina State University, North Carolina, USA; 2007.
- 9.Miles C.J., Takashima S. Fate of malathion and O, O, S-trimethyl phosphorothioate by-product in Hawaiian soil and water. Arch Environ Contam Toxicol. 1991;20:325–329. [Google Scholar]
- 10.Khan S., Khan N.N. The mobility of some organophosphorus pesticides in soils as affected by some soil parameters. Soil Sci. 1986;142:214–224. [Google Scholar]
- 11.Bondarenko S., Gan J. Degradation and sorption of selected organophosphate and carbamate insecticides in urban stream sediments. Environ Toxicol Chem. 2004;23:1809–1814. doi: 10.1897/03-344. [DOI] [PubMed] [Google Scholar]
- 12.Abd El-Gawad EA, Kandiel MMM, Abbass AA, Shaheen AA. Impact of some organophosphorus insecticides on growth performance, fecundity and semen characteristics in Nile tilapia (Oreochromis niloticus). Lucrări Ştiinţifice, 54 seria Medicină Veterinară; 2011. p. 150–60.
- 13.Matsumoto S.T., Mantovani M.S., Rigonato J., Marin-Morales M.A. Evaluation of the genotoxic potential due to the action of an effluent contaminated with chromium, by the comet assay in cho-k1 cultures. Caryologia. 2005;58:40–46. [Google Scholar]
- 14.El-Sayed A.I.M., Soltani M.A., Radwan H.A., Mohamed M.G. Effect of oxytetracycline and florfenicol on the cytogenetic picture of Nile tilapia (Oreochromis niloticus) Fish. JABS. 2013;7:102–106. [Google Scholar]
- 15.Fenech M. The in vitro micronucleus technique. Mutat Res. 2000;455:81–95. doi: 10.1016/s0027-5107(00)00065-8. [DOI] [PubMed] [Google Scholar]
- 16.Udroiu I. The micronucleus test in piscine erythrocytes. Aquat Toxicol. 2006;79:201–204. doi: 10.1016/j.aquatox.2006.06.013. [DOI] [PubMed] [Google Scholar]
- 17.Tomonaga S., Hirokane T., Awaka K. Lymphoid cells in the hagfish. Zool Mag. 1973;82:133–135. [Google Scholar]
- 18.Rab P., Pokorny J., Roth P. Chromosome studies of common carp. I. Karyotype of Amurian carp (Cyprinus carpio) Haematoterus. Caryologia. 1989;42:27–36. [Google Scholar]
- 19.LeBlanc G.A., Bain L.J. Chronic toxicity of environmental contaminants: sentinels and biomarkers. Environ Health Perspect. 1997;105:65–80. doi: 10.1289/ehp.97105s165. [DOI] [PMC free article] [PubMed] [Google Scholar]
- 20.Hassig A., Liang W.X., Schwabl H., Stampfli K. Flavonoids and tannins: plant-based antioxidants with vitamin character. Med Hypotheses. 1999;52:479–481. doi: 10.1054/mehy.1997.0686. [DOI] [PubMed] [Google Scholar]
- 21.Ítavo C.C.B.F., Morais M.G., Costa C., Ítavo L.C.V., Franco G.L., Da Silva J.A., Reis F.A. Addition of propolis or momensin in the diet: behavior and productivity of lambs in feedlot. Anim Feed Sci Technol. 2011;165:161–166. [Google Scholar]
- 22.Velikova M., Bankova V., Tsvetkova I., Kujumgiev A., Marcucci M.C. Antibacterial entkaurene from Brazilian propolis of native stingless bees. Fytoterapia. 2000;71:693–696. doi: 10.1016/s0367-326x(00)00213-6. [DOI] [PubMed] [Google Scholar]
- 23.Amoros M., Lurton E., Boustie J., Girre L., Sauvager F., Cormier M. Comparison of the anti-Herpes Simplex Virus activities of propolis and 3-methyl-but-2-enyl caffeate. J Nat Prod. 1994;1994(57):644–647. doi: 10.1021/np50107a013. [DOI] [PubMed] [Google Scholar]
- 24.Ota C., Unterkicher C., Fantinato V., Shimuzu M.T. Antifungal activity of propolis on different species of Candida. Mycoses. 2001;44:375–378. doi: 10.1046/j.1439-0507.2001.00671.x. [DOI] [PubMed] [Google Scholar]
- 25.Galal A., Abd El-Motaal A.M., Ahmed A.M.H., Zaki T.G. Productive performance and immune response of laying hens as affected by dietary propolis supplementation. Int J Poult Sci. 2008;7:272–278. [Google Scholar]
- 26.Dutta H.M., Nath A., Adhikari S., Roy P.K., Singh N.K., Datta Munshi J.S. Sublethal malathion induced changes in the ovary of an air-breathing fish, Heteropneustes fossilis: a histological study. Hydrobiologia. 1994;294:215–218. [Google Scholar]
- 27.Saric A., Balog T., Sobocanec S., Kusic B., Sverko V., Rusak G., Likic S., Bubalo D., Pinto B., Reali D., Marotti T. Antioxidant effects of flavonoid from Croatian Cystus incanus L. rich bee pollen. Food Chem Toxicol. 2009;47:547–554. doi: 10.1016/j.fct.2008.12.007. [DOI] [PubMed] [Google Scholar]
- 28.LeBlanc B.W., Davis O.K., Boue S., Delucca A., Deeby T. Antioxidant activity of Sonoran desert bee pollen. Food Chem. 2009;115:1299–1305. [Google Scholar]
- 29.Graikou K., Kapeta S., Aligiannis N., Sotiroudis G., Chondrogianni N., Gonos E. Chinou I: chemical analysis of Greek pollen-antioxidant, antimicrobial and proteasome activation. Chem Central J. 2011;5:3. doi: 10.1186/1752-153X-5-33. [DOI] [PMC free article] [PubMed] [Google Scholar]
- 30.Medeiros K.C.P., Figueiredo C.A.V., Figueredo T.B., Freire K.R.L., Santos F.A.R., Alcantara-Neves N.M., Silva T.M.S., Piuvezam M.R. Anti-allergic effect of bee pollen phenolic extract and myricetin in ovalbumin-sensitized mice. J Ethnopharmacol. 2008;119:41–46. doi: 10.1016/j.jep.2008.05.036. [DOI] [PubMed] [Google Scholar]
- 31.Matsushige K., Basnet P., Hase K., Kadota S., Tanaka K., Namba T. Propolis protects pancreatic b-cells against the toxicity of streptozotocin (STZ) Phytomedicine. 1996;III:203–209. doi: 10.1016/S0944-7113(96)80037-7. [DOI] [PubMed] [Google Scholar]
- 32.Cuesta A., Rodríguez A., Esteban M.A., Meseguer J. In vivo effects of propolis, a honeybee product, on gilthead seabream innate immune responses. Fish Shellfish Immunol. 2005;18:71–80. doi: 10.1016/j.fsi.2004.06.002. [DOI] [PubMed] [Google Scholar]
- 33.Halte H. Effect of aluminum in hard, acid water on metabolic rate, blood gas tension and ionic status in the rainbow trout. J Fish Biol. 1986;29:187–198. [Google Scholar]
- 34.Finney D.J. 3rd ed. Cambridge University Press; London, UK: 1971. Probit analysis. p. 333. [Google Scholar]
- 35.Carpenter P.L. 3rd ed. W.B. Saunders Co. Philadelphia; London, Toronto: 1975. Immunology and serology. p. 254. [Google Scholar]
- 36.Bhargava S., Rawat M. Toxicity of some pesticides to the fish, Heteropneustes fossilis. Ad Bios. 1999;181:23–26. [Google Scholar]
- 37.Sprague J.B. Measurement of pollutant toxicity of fish, utilizing and applying bioassay results. Mars Res. 1973;4:3–32. [Google Scholar]
- 38.Amlaker E. T.F.S. Publication; New Jersey, USA: 1970. Textbook of fish diseases. p. 117–35. [Google Scholar]
- 39.Lee M.R., Elder F.F.B. Yeast stimulation of bone marrow mitosis for cytogenetic investigations. Cytogenet Cell Genet. 1980;26:36–40. doi: 10.1159/000131419. [DOI] [PubMed] [Google Scholar]
- 40.Al-Sabti K., Fijan N., Kurelec B. Frequency of chromosomal aberrations in the rainbow trout (Salmo gairdneri, Rich) exposed to detergent and benzene. Vet Arch. 1984;25:83–89. [Google Scholar]
- 41.De Flora S., Vigano L., Agostini F.D., Camoirano A., Bagnusio M., Bennieeli C. Multiple genotoxicity biomarkers fish exposed in situ to polluted river water. Mutat Res. 1993;319:167–177. doi: 10.1016/0165-1218(93)90076-p. [DOI] [PubMed] [Google Scholar]
- 42.Gibb R.K., Taylor D.D., Wan T., O’Connor D.M., Doering D.L., Gerçel-Taylor C. Apoptosis as a measure of chemosensitivity to cisplatin and taxol therapy in ovarian cancer cell lines. Gynecol Oncol. 1997;65:13–22. doi: 10.1006/gyno.1997.4637. [DOI] [PubMed] [Google Scholar]
- 43.Manoharan K., Banerjee M.R. Beta-carotene reduces sister chromatid exchange induce chemical carcinogens in mouse mammary cells in organ culture. Cell Biol Int Rep. 1985;9:783–789. doi: 10.1016/0309-1651(85)90096-7. [DOI] [PubMed] [Google Scholar]
- 44.Abbass A.A., El-Asely A.M., Kandiel M.M.M. Effects of dietary propolis and pollen on growth performance, fecundity and some hematological parameters of Oreochromis niloticus. Turkish J Fish Aquat Sci. 2012;12:851–859. [Google Scholar]
- 45.El-Elaimy I.A., Al-Sharkawi I.M., Elowa S.E. Evaluation of malathion toxicity using reverse electron transfer (RET) system in tissues of freshwater fish. Egy J Gen Soc Zool. 1994;14:317–387. [Google Scholar]
- 46.Al-Ghanim K.A. Acute toxicity and effects of sub-lethal malathion exposure on biochemical and haematological parameters of Oreochromis niloticus. Sci Res Essays. 2012;7:1674–1680. [Google Scholar]
- 47.Pathiratne A., George S.G. Toxicity of malathion to Nile tilapia, Oreochromis niloticus and modulation by other environmental contaminants. Aquat Toxicol. 1998;43:261–271. [Google Scholar]
- 48.Vittozi O.L., De-Angelis G. A critic review of comparative acute toxicity of data on fresh water fish. Aquat Toxicol. 1991;19:167–204. [Google Scholar]
- 49.Alkahem H.F., Ahmed Z., Al-Akel A.S., Shamsi M.J.K. Toxicity bioassay and changes in haematological parameter of Oriochromis niloticus induced by trichloroform. Arab Gulf J Sci Res. 1998;16:581–593. [Google Scholar]
- 50.Yang X., Guo D., Zhang J., Wu M. Characterization and anti-tumor activity of pollen polysaccharide. Int Immunopharmacol. 2007;7:401–408. doi: 10.1016/j.intimp.2006.11.001. [DOI] [PubMed] [Google Scholar]
- 51.Bednarska E. The localization of nonspecific esterase and cholinesterase activity in germinating pollen and pollen tube of Vicia faba L. The effect of actinomycin D and cycloheximide. Biol Plantarum. 1992;34:229–240. [Google Scholar]
- 52.El-Masry T.A., Emara A.M., Nagla A., El-Shitany N.A. Possible protective effect of propolis against lead induced neurotoxicity in animal model. J Evol Biol Res. 2011;3:4–11. [Google Scholar]
- 53.Kumar R., Nagpure N.S., Kushwaha B., Srivastava S.K., Lakra W.S. Investigation of the genotoxicity of malathion to freshwater teleost fish Channa punctatus (Bloch) using the micronucleus test and comet assay. Arch Environ Contam Toxicol. 2010;58:123–130. doi: 10.1007/s00244-009-9354-3. [DOI] [PubMed] [Google Scholar]
- 54.Sharaf-Eldeen K.M., El-Ezabi M., Al-Bohaissi A.M. The molecular changes of hepatocytes in Tilapia Zillh under the effect of the agricultural and industrial pollution in the River Nile, Egypt. J Aquat Biol Fish. 2006;10:55–76. [Google Scholar]
- 55.Abdella E.M., Tohamy A., Ahmad R.R. Antimutagenic activity of Egyptian propolis and bee pollen water extracts against cisplatin-induced chromosomal abnormalities in bone marrow cells of mice. Iran J Cancer Prev. 2009;2:175–181. [Google Scholar]
- 56.Leja M., Mareczek A., Wyzgolik G., Klepacz-Baniak J., Czekonska K. Antioxidative properties of bee pollen in selected plant species. Food Chem. 2007;100:237–240. [Google Scholar]
- 57.Rice-Evans C.A., Miller N.J., Paganga G. Structure antioxidant activity relationships of flavonoids and phenolic acids. Free Rad Biol Med, Los Angeles. 1996;20:933–956. doi: 10.1016/0891-5849(95)02227-9. [DOI] [PubMed] [Google Scholar]
- 58.Tang B., Zhang L., Geng Y. Determination of the antioxidant capacity of different food natural products with a new developed flow ingection spectrofluorimetry detecting hydroxyl radicals. Talanta. 2005;65:769–775. doi: 10.1016/j.talanta.2004.08.004. [DOI] [PubMed] [Google Scholar]
- 59.Tavares D.C., Lira W.M., Santini C.B., Takahashi C.S., Bastos J.K. Effects of propolis crude hydroalcoholic extract on chromosomal aberrations induced by doxorubicin in rats. Planta Med. 2007;73:1531–1536. doi: 10.1055/s-2007-993737. [DOI] [PubMed] [Google Scholar]
- 60.Han X., Shen T., Lou H. Dietary polyphenols and their biological significance. Int J Mol Sci. 2007;8:950–988. [Google Scholar]
- 61.Wang M.S., Fan H.F., Xu H.J. Effects of bee pollen on blood and hemopoietic system in mice and rats. Chin Trad Herbal Drugs. 1993;24:588–591. [Google Scholar]
- 62.Pinto B., Caciagli F., Riccio E., Reali D., Šarić A., Balog T. Antiestrogenic and antigenotoxic activity of bee pollen from Cystus incanus and Salix alba as evaluated by the yeast estrogen screen and micronucleus assay in human lymphocytes. Eur J Med Chem. 2010;45:4122–4128. doi: 10.1016/j.ejmech.2010.06.001. [DOI] [PubMed] [Google Scholar]
- 63.Musa N. Sperm activation in Nile tilapia Oreochromis niloticus and the effects of environmentally relevant pollutants on sperm fitness. PhD thesis. School of Natural Sciences Aquaculture, University of Stirling, United Kingdom; 2010.
- 64.Kolesarova A., Capcarova M., Bakova Z., Galik B., Juracek M., Simko M. The effect of bee pollen on secretion activity, markers of proliferation and apoptosis of porcine ovarian granulosa cells in vitro. J Environ Sci Health B. 2011;46:207–212. doi: 10.1080/03601234.2011.540202. [DOI] [PubMed] [Google Scholar]
- 65.Orzáez Villanueva M.T., Díaz Marquina A., Bravo Serrano R., Blazquez Abellán G. The importance of bee-collected pollen in the diet: a study of its composition. Int J Food Sci Nutr. 2002;53:217–224. doi: 10.1080/09637480220132832. [DOI] [PubMed] [Google Scholar]
- 66.Selmanoğlu G., Hayretdağ S., Kolankaya D., Tüylü A.O., Kadriye Sorkun K. The effect of pollen on some reproductive parameters of male rats. Pestic Fytomed (Belgrade) 2009;24:59–63. [Google Scholar]
- 67.Kolesarova A., Bakova Z., Capcarova M., Galik B., Juracek M., Simko M. Consumption of bee pollen affects rat ovarian functions. J Anim Physiol Anim Nutr (Berlin) 2013;97(6):1059–1065. doi: 10.1111/jpn.12013. [DOI] [PubMed] [Google Scholar]
- 68.Singh S., Singh T.P. Evaluation of toxicity limit and sex hormone production in response to cythion and BHC in the vitellogenic catfish Clarias batrachus. Environ Res. 1987;42:482–488. doi: 10.1016/s0013-9351(87)80215-3. [DOI] [PubMed] [Google Scholar]