

Abstract
Background and Purpose
Heteromerization of GPCRs is key to the integration of extracellular signals and the subsequent cell response via several mechanisms including heteromer-selective ligand binding, trafficking and/or downstream signalling. As the lysophosphatidylinositol GPCR 55 (GPR55) has been shown to affect the function of the cannabinoid receptor subtype 2 (CB2 receptor) in human neutrophils, we investigated the possible heteromerization of CB2 receptors with GPR55.
Experimental Approach
The direct interaction of human GPR55 and CB2 receptors heterologously expressed in HEK293 cells was assessed by co-immunoprecipitation and bioluminescence resonance energy transfer assays. The effect of cross-talk on signalling was investigated at downstream levels by label-free real-time methods (Epic dynamic mass redistribution and CellKey impedance assays), ERK1/2-MAPK activation and gene reporter assays.
Key Results
GPR55 and CB2 receptors co-localized on the surface of HEK293 cells, co-precipitated in membrane extracts and formed heteromers in living HEK293 cells. Whereas heteromerization led to a reduction in GPR55-mediated activation of transcription factors (nuclear factor of activated T-cells, NF-κB and cAMP response element), ERK1/2-MAPK activation was potentiated in the presence of CB2 receptors. CB2 receptor-mediated signalling was also affected by co-expression with GPR55. Label-free assays confirmed cross-talk between the two receptors.
Conclusions and Implications
Heteromers, unique signalling units, form in HEK293 cells expressing GPR55 and CB2 receptors. The signalling by agonists of either receptor was governed (i) by the presence or absence of the partner receptors (with the consequent formation of heteromers) and (ii) by the activation state of the partner receptor.
Table of Links
| TARGETS | LIGANDS |
|---|---|
| CB1 receptor | AM251 |
| CB2 receptor | AM630 |
| D4 receptor | cAMP |
| GPR55 | CP55940 |
| MAPK | LPI |
| SR141716A | |
| SR144528 |
This Table lists key protein targets and ligands in this document, which are hyperlinked to corresponding entries in http://www.guidetopharmacology.org, the common portal for data from the IUPHAR/BPS Guide to PHARMACOLOGY (Pawson et al., 2014) and are permanently archived in the Concise Guide to PHARMACOLOGY 2013/14 (Alexander et al., 2013a,b,).
Introduction
The cell environment is sensed by seven-transmembrane-domain GPCRs, which are one of the most populated families in the human proteome (Lander et al., 2001) and play a crucial role in development, neurotransmission, hormone function and cell proliferation and migration. Thus, due to their versatile roles in health and disease, GPCRs are important drug targets in pharmacotherapy (Fredriksson et al., 2003). Cannabinoid receptors are members of the class A GPCR subfamily and mediate many physiological effects exerted by endogenous cannabinoids, such as anandamide and 2-arachidonoyl-glycerol (2-AG; Pacher and Kunos, 2013). Cannabinoid receptor 1 (CB1 receptor), the GPCR most abundantly expressed in brain, is activated by 2-AG (Sugiura et al., 1999), with higher affinity by anandamide (Pacher et al., 2006) and also by the main psychoactive constituent of Cannabis sativa, Δ9-tetrahydrocannabinol (Matsuda et al., 1990). The CB2 receptor is also activated by endocannabinoids and modulates the function of immune cells (Basu et al., 2013; Ramirez et al., 2013). Both receptors are reported to couple to Gi heterotrimeric G-proteins and to inhibit cAMP production (Howlett, 2005; Pertwee et al., 2010).
Less than a decade ago, GPCR deorphanization studies led to the discovery of GPCR 55 (GPR55), a putative cannabinoid receptor that binds to some of the inverse agonists of CB1 receptors, such as SR141716A (rimonabant) and AM 251 (Petitet et al., 2006; Hiley and Kaup, 2007; Johns et al., 2007; Pertwee, 2007; Ryberg et al., 2007; Lauckner et al., 2008; Brown and Robin Hiley, 2009; Henstridge et al., 2009). However, it was reported that L-α-lysophosphatidylinositol (LPI) is the endogenous agonist of GPR55 (Oka et al., 2007). Upon activation, GPR55 induces intracellular calcium release via a Gα13/RhoA-mediated pathway (Oka et al., 2009; Balenga et al., 2011a), promotes proliferation via ERK1/2-MAPK activation (Henstridge et al., 2010; Andradas et al., 2011; Perez-Gomez et al., 2014) and regulates cytoskeletal rearrangement and migration (Balenga et al., 2011a; Obara et al., 2011).
The signalling pathways and subsequent physiological actions of endocannabinoids are further diversified by the occurrence of dimers and oligomers of cannabinoid receptors with other GPCRs. Interestingly, the CB1 receptor forms homomers (Wager-Miller et al., 2002) and also heteromers with CB2 receptors (Callen et al., 2012) or GPR55 (Kargl et al., 2012). We have previously reported a functional cross-talk between GPR55 and CB2 receptors in human blood neutrophils and HL60 cells (Balenga et al., 2011a). Therefore, the aim of the current study was to investigate the possible occurrence of heteromers between GPR55 and CB2 receptors. By means of molecular, biochemical and label-free approaches, early and late signalling events were compared in cells expressing CB2 receptors, GPR55 or both receptors. Our results suggest that GPR55 and CB2 receptors indeed interact, and that the activation of ERK1/2 and transcription factors [nuclear factor of activated T-cells (NFAT), NF-κB, cAMP response element (CRE) and serum response element (SRE)] is differentially modulated in cells co-expressing the two receptors.
Methods
N-terminal tagging of HA and FLAG epitopes to receptors
The receptors were tagged with either a triple haemagglutinin epitope (HA; 3xHA-GPR55; Henstridge et al., 2009) or a FLAG epitope (FLAG-CB2R) at the N terminus and were sub-cloned into a pcDNA 3.1 vector (Martini et al., 2007). All constructs were verified by DNA sequencing.
Cells
Cells were grown in DMEM (Invitrogen) supplemented with 10% FBS at 37°C in a humidified atmosphere of 5% CO2. For all functional assays, cells were starved in serum-free Opti-MEM (Invitrogen) overnight, unless mentioned otherwise.
Generation of stable cell lines
AD-293 (HEK293) cells were engineered to stably express 3xHA-GPR55 [HEK-GPR55; kindly provided by Andrew Irving from the University of Dundee (Scotland)] or FLAG-CB2 receptors (HEK-CB2 receptor). The HEK-GPR55 cells were transfected with FLAG-CB2 receptors and clones stably expressing GPR55 and CB2 receptors (HEK-CB2R/GPR55) were evaluated. Selection for expression of receptors was as follows: 0.3 mg·mL−1 G418 for GPR55 and 0.2 mg·mL−1 zeocin for CB2 receptors. Cell nomenclature was based on BJP's ‘Concise Guide to Pharmacology’ (Alexander et al., 2013a,2013b).
Transient transfection
HEK-GPR55 cells were transfected with pcDNA3.1 plasmid (empty or with the coding sequences for FLAG-hCB2R or -hCCR5) using Lipofectamine 2000 (Invitrogen) and were used 48 h post-transfection.
Immunocytochemistry
HEK293 cells were grown to 50% confluence on poly-D-lysin coated glass coverslips and starved in OptiMEM overnight. Antibody feeding experiments were performed as described previously (Kargl et al., 2012). In short, living cells were fed with anti-HA.11 (1:1000, Covance) and anti-FLAG M1 (1:1000, Sigma) antibodies for 30 min at 37°C and stimulated with LPI or vehicle for 45 min at 37°C. Subsequently, cells were fixed in 3.7% paraformaldehyde, permeabilized in blocking buffer (50 mM Tris-HCl, pH 7.5, 1 mM CaCl2, 0.3% Triton X-100 and 3% milk) and incubated with Alexa Fluor 488-conjugated IgG2b against the FLAG tag (1:1000, Invitrogen) and Alexa Fluor 594-conjugated IgG1 against the HA tag (1:1000, Invitrogen) for 20 min. Cells were finally mounted in DAPI-containing Vectashield mounting medium (Vector Laboratories Inc., Peterborough, UK). The immunolabelled receptors were imaged on a laser scanning confocal microscope (Zeiss LMS 510 META; Zeiss, Jena, Germany) with Plan-Neofluar (40×/1.3 Oil DIC) objective.
Flow cytometry
HEK293, HEK-GPR55, HEK-CB2 receptor and HEK-CB2R/GPR55 cells were grown in six-well plates (40 000 cells per well) and starved in serum-free Opti-MEM overnight. Cells were transferred to FACS tubes, incubated for 30 min with 1% BSA and stained with anti-FLAG antibody (M1; 1:1000) for CB2 receptors or anti-HA antibody (HA-11; 1:1000) for GPR55 labelling (60 min, at 4°C). Cells were washed twice and secondary antibodies (Alexa Fluor-488 anti-mouse IgG2b for CB2 receptors or Alexa Fluor-488 anti-mouse IgG1 for GPR55) were added for 45 min at 4°C. Finally, cells were washed twice, fixed and analysed in a FACSCalibur flow cytometer (Becton Dickinson, San Jose, CA, USA).
Co-immunoprecipitation (Co-IP) assay
HEK293, HEK-CB2 receptor, HEK-GPR55 and HEK-CB2R/GPR55 cells were grown in 10 cm dishes and starved in serum-free Opti-MEM overnight. Cells were washed twice with PBS and lysed in IPB buffer (10 mM Tris-HCl pH 7.4, 150 mM NaCl, 25 mM KCl, 1 mM CaCl2, 0.1% Triton X-100, pH 7.4) supplemented with a complete cocktail of protease inhibitors (Roche). Lysates were centrifuged and supernatants were incubated with 20 μL anti-FLAG M2 monoclonal antibody affinity matrix for 1 h; 30 μL of lysate was kept for FLAG, HA and β-actin control blots. Samples were washed, deglycosylated with PNGase for 1 h at 37°C and boiled with reducing sample buffer for 5 min. Precipitates and control lysates were resolved on a 4–20% Tris-Glycine gradient gel and then transferred to a PVDF membrane. Membranes were immunoblotted with anti-HA for GPR55 (HA-11, 1:1000), anti-FLAG for CB2 receptors (M2, 1:500, Sigma) or anti-β-actin (1:1000) for 2 h. All blots were incubated for 2 h with an HRP-conjugated anti-mouse antibody (1:4000). Films were developed using the ECL Western blotting substrate.
BRET
Fusion proteins and expression vectors
The human cDNA for GPR55, CB2 and dopamine D4.2 receptors cloned in pcDNA3.1 were amplified without their stop codons using sense and antisense primers harbouring either unique EcoRI and BamH1 sites (CB2 receptor, GPR55) or Xho1 and EcoR1 (D4.2 receptor). The fragments were then subcloned to be in-frame at the C-terminal end with Renilla luciferase (Rluc) into the EcoRI and BamH1 (GPR55) restriction site of an Rluc-expressing vector (pRluc-N1, PerkinElmer, Wellesley, MA, USA), or into the BamH1 and EcoRI (CB2 receptor) or Xho1 and EcoR1 (D4.2 receptor) restriction site of an EYFP expressing vector (EYFP-N1; enhanced yellow variant of GFP; Clontech, Heidelberg, Germany; GPR55-Rluc, CB2 receptor-YFP or D4.2 receptor-YFP). Expression of constructs was tested by confocal microscopy using a polyclonal anti-GPR55 antibody (1:100; 10224 Cayman Chemical) detected with an Alexa Fluor 546-conjugated goat anti-rabbit IgG antibody (1:600; Molecular Probes, Invitrogen) along with TO-PRO®-3 (1:400, T3605, Molecular Probes, Invitrogen) for nuclear staining. Cells were mounted in aqueous mounting medium and inspected under LSM 510 META (Zeiss) inverted confocal microscope equipped with a 40xP-Neofluar (NA 1.3). CB2 receptor-YFP was visualized directly following excitation with the argon laser at 488 nm. Images were acquired using the Zeiss software (Aim4). Receptor functionality was tested by performing ERK1/2 activation assays.
BRET assays
HEK293 cells growing in six-well plates or 60-mm-diameter dishes were transiently transfected with fusion protein cDNA and ramified PEI (PolyEthylenImine, Sigma, St. Louis, MO, USA). Cells were incubated with the corresponding cDNA together with ramified PEI (5 mL of 10 μM PEI for each μg cDNA) and 150 mM NaCl in a serum-free medium. After 4 h, the medium was changed to a fresh complete culture medium. For BRET assays, 48 h after transfection cells were washed twice in quick succession in HBSS (137 mM NaCl; 5 mM KCl; 0.34 mM Na2HPO4x12H2O; 0.44 mM KH2PO4; 1.26 mM CaCl2x2H2O; 0.4 mM MgSO4x7H2O; 0.5 mM MgCl2; and 10 mM HEPES pH 7.4) supplemented with 0.1% glucose (w v-1), detached by gently pipetting and resuspended in the same buffer. To control the cell number, sample protein concentration was determined using a Bradford assay kit (Bio-Rad, Munich, Germany) using BSA dilutions as standards. To quantify receptor-fluorescence expression, cells (20 μg protein) were distributed in 96-well microplates (black plates with a transparent bottom; Porvair, Leatherhead, UK) and fluorescence was read using a Mithras LB 940 (Berthold, Bad Wildbad, Germany) equipped with a high-energy xenon flash lamp, using an excitation filter of 485 nm. Receptor-fluorescence expression was determined as fluorescence of the sample minus the fluorescence of cells expressing protein-Rluc alone. For BRET measurements, the equivalent of 20 μg of cell suspension was distributed in 96-well microplates (white plates; Porvair) and 5 μM coelenterazine H (PJK GMBH, Kleinblittersdorf, Germany) was added. After 1 min of adding coelenterazine H, readings were collected using a Mithras LB 940 (Berthold, Bad Wildbad, Germany) that allows the integration of the signals detected in the short-wavelength filter at 485 nm (440–500 nm) and the long-wavelength filter at 530 nm (510–590 nm). To quantify receptor-Rluc expression, luminescence readings were performed after 10 min of adding 5 μM coelenterazine H. Cells expressing BRET donors alone were used to determine background. The net BRET is defined as [(long-wavelength emission)/(short-wavelength emission)]-Cf where Cf corresponds to [(long-wavelength emission)/(short-wavelength emission)] for the Rluc construct expressed alone in the same experiment. BRET curves were fitted by using a non-linear regression equation, assuming a single phase with GraphPad Prism software (San Diego, CA, USA). BRET values are given as milli BRET units (mBU: 1000 X net BRET).
Gene reporter assays
HEK293, HEK-CB2 receptor, HEK-GPR55 and HEK-CB2R/GPR55 cells were seeded (20 000 cells·per well) in 96-well plates and were transiently transfected with pNFAT-, NF-kB-, pCRE- or pSRE-Luc reporter plasmids (PathDetect; Stratagene, Santa Clara, CA, USA) using Lipofectamine 2000 as described by the manufacturer (Invitrogen). Twenty four hours later, cells were incubated with ligands for 6 h in serum-free Opti-MEM medium at 37°C. For gene-dose experiments, HEK-GPR55 cells were transiently transfected with a combination of reporter plasmids with pcDNA, pcDNA-CB2R or pcDNA-CCR5 and incubation with ligands was performed 48 h post-transfection. In some experiments, cells were pre-incubated with PTX (100 ng·mL−1) overnight and then stimulated with ligands in the presence of PTX (25 ng·mL−1) for 6 h. Luciferase activity was visualized by using the steadylite plus Kit (PerkinElmer, Waltham, MA, USA) as described previously (Henstridge et al., 2009). Luminescence was measured in a TopCounter (Top Count NXT; Packard) for 5 s. Luminescence values are given as relative light units.
Transcription factor translocation
Cells were seeded on glass coverslips in six-well plates. Cells were subsequently transfected with 3 μg of GFP-NFAT4 or EGFP-p65 (NF-κB) plasmid vectors with Lipofectamine 2000 and then deprived of serum overnight in serum-free Opti-MEM. After that, cells were treated with 5 μM LPI in serum-free Opti-MEM for 30 min and then fixed with 3.7% paraformaldehyde. Coverslips were mounted onto a slide with Vectashield Mounting Medium with DAPI (Vector Laboratories Inc.) and images of translocation of GFP-tagged proteins were taken using an Olympus fluorescence microscope (Olympus, Vienna, Austria) equipped with a Hamamatsu ORCA CCD camera (Hamamatsu, Herrsching am Ammersee, Germany).
ERK immunoblotting
Six-well plates of confluent HEK293, HEK-CB2 receptor, HEK-GPR55 and HEK-CB2R/GPR55 cells were incubated overnight with serum-free Opti-MEM media and then treated with and without the indicated ligands for the indicated time (see corresponding figure legends) at 37°C. Cells were rinsed with ice-cold PBS and lysed by the addition of 100 μL of ice-cold lysis buffer (50 mM Tris-HCl pH 7.4; 50 mM NaF; 150 mM NaCl; 45 mM β-glycerophosphate; 1% Triton X-100; 0.4 mM Na3VO4; and protease inhibitor mixture). The cellular debris was removed by centrifugation at 13 000× g for 5 min at 4°C, and protein was quantified by the bicinchoninic acid method using BSA dilutions as standard. To determine the level of ERK1/2 phosphorylation, equivalent amounts of protein (15 μg) were mixed with 6× Laemmli sample buffer, separated by electrophoresis on a denaturing 10% SDS-polyacrylamide gel and transferred onto nitrocellulose membranes (BioTrace™ NT Nitrocellulose Transfer Membrane, 66485; PALL, Port Washington, NY, USA). After that, Odyssey blocking buffer (LI-COR Biosciences, Lincoln, NE, USA) was added, and the membranes were rocked for 60 min. Membranes were then probed with a mixture of a mouse anti-phospho-ERK1/2 antibody (1:1000 dilution; M8159; Sigma Chemical Co) and rabbit anti-ERK1/2 antibody that recognizes both phosphorylated and non-phosphorylated ERK1/2 (1:20 000; M5670; Sigma Chemical Co) in blocking buffer for 2–3 h at room temperature. After being washed three times with TBS/Tween20, membranes were incubated with a mixture of IRDye®CW 800 (anti-mouse) antibody (1:15 000; 926–32210 LI-COR Biosciences, Lincoln, Nebraska, USA) and IRDye 680RD (anti-rabbit) antibody (1:15 000; 926–68071; LI-COR Biosciences) for 1 h at room temperature. Bands were visualized by the Odyssey® Fc Imaging System (LI-COR Biosciences) and their densities quantified using the Image Studio software 1.1 (LI-COR Biosciences). The level of phosphorylated ERK1/2 isoforms was normalized for differences in loading using the total ERK1/2 protein band intensities.
Label-free dynamic mass redistribution (DMR) assay
DMR assays were performed as previously described (Henstridge et al., 2010; Schroder et al., 2010; Balenga et al., 2011a). Briefly, 48 h before the assay, cells were seeded at a density of 7500 cells per well in 384-well Epic® (Corning®, NY, USA) sensor microplates with 30 μL growth medium (DMEM, 10% FCS) and cultured for 24 h (37°C, 5% CO2). Cells were deprived of serum for 24 h in 30 μL HBSS with 20 mM HEPES (pH 7.15). Before the assay, cells were washed once with assay buffer [HBSS with 20 mM HEPES and 0.1% BSA-faf (pH 7.15)]. Thereafter, the sensor plate was scanned by the Epic reader (Corning) at 28°C and a baseline optical signature was recorded. Then 10 μL of LPI, dissolved in the assay buffer, was added to the cells and DMR responses were monitored for 3600 s. Data were normalized and expressed as % of maximum activation induced by LPI. For analysis of DMR data, the AUC values of DMR signals between the 0 and 3600 s time points with mean and SEM were used to calculate agonist activity. AUC values were transformed into relative AUC units to give equivalent baseline optical recordings for all dose–response curves from any given assay plate. Data were then normalized and expressed as % of maximum (100%) activation induced by a saturating concentration of LPI. Data were additionally analysed by determining the slopes of tangents to the origin of the real-time traces to capture the steepness of the initial ascending parts.
Label-free impedance assay
CellKey® (Molecular Devices, Madrid, Spain) system provides a universal, label-free, cell-based assay platform that uses cellular dielectric spectroscopy to measure endogenous and transfected receptor activation in real time in live cells (Scott and Peters, 2010). Changes in the complex impedance (ΔZ or dZ) of a cell monolayer in response to receptor stimulation are measured. Impedance (Z) is defined by the ratio of voltage/current as described by Ohm's law (Z = V/I). Cells stably expressing GPR55, CB2 receptors or both receptors were grown to confluence in a CellKey Standard 96-well microplate that contains electrodes at the bottom of each well. In these cells, medium was replaced 24 h later by HBSS buffer (Invitrogen) supplemented with 20 mM HEPES and 0.1% BSA for 30 min before running the cell equilibration protocol. A baseline was recorded for 5 min, and then cells were treated with different reagents, and data were acquired for the following 15 min. To calculate the impedance, small voltages at 24 different measurement frequencies were applied to cells. At low frequencies, extracellular currents that pass around individual cells in the layer were induced. At high frequencies, transcellular currents that penetrate the cellular membrane were induced, and the ratio of the applied voltage and the measured current were computed for each well as the impedance. The output data refer to the maximum change in extracellular currents in response to the added drug.
cAMP accumulation assay
cAMP accumulation in HEK293 cells stably expressing GPR55 was performed using the HTRF-cAMP dynamic kit (CisBio, Codolet, France) according to manufacturer's instructions. Briefly, cells were treated with the indicated ligands for 10 min, incubated in lysis buffer (20 mM Tris, 1% Triton X-100, pH 7.5) for 30 min and dispensed in white 384-well microplates at a density of 30 000 cells per well. The cellular lysates were incubated for 60 min at room temperature containing HTRF assay reagents, and time-resolved Förster's resonance energy transfer signals were measured after excitation at 320 nm using the Envision 2104 Multilabel Reader (PerkinElmer). Data analysis was made based on the fluorescence ratio emitted by the labelled cAMP probe (665 nm) over the light emitted by the europium cryptate-labelled anti-cAMP antibody (620 nm). A standard curve was used to calculate cAMP concentration.
Statistical analysis
Data are presented as mean ± SEM where applicable and were analysed by one- or two-way anova or Student's t-test using GraphPad Prism software. We considered a P value < 0.05 statistically significant.
Reagents
G418, Zeocin, DMEM, PBS and HBSS were purchased from Invitrogen (Carlsbad, CA, USA). NFAT cytoplasmic calcineurin-dependent 3 (GFP-NFATc3) plasmid was kindly supplied by Dr. Masamitsu Iino (Tokyo University, Tokyo, Japan; Henstridge et al., 2009). EGFP-tagged NFκB p65 plasmid was provided by Dr. Wolfgang Graier (Medical University of Graz, Austria; Waldeck-Weiermair et al., 2008). A-836339 ([2,2,3,3-tetramethyl-cyclopropanecarboxylic acid [3-(2-methoxy-ethyl)-4,5-dimethyl-3H-thiazol-(2Z)-ylidene]- amide]), AM 630 (6-iodo-2-methyl-1-[2-(4-morpholinyl)ethyl]-1H-indol-3-yl](4-methoxyphenyl)methanone), AM 251 (N-(piperidin-1-yl)-5-(4-iodophenyl)-1-(2,4-dichlorophenyl)-4-methyl-1H-pyrazole-3-carboxamide), CP 55,940 ((-)-cis-3-[2-hydroxy-4-(1,1-dimethylheptyl)phenyl]-trans-4-(3-hydroxypropyl)cyclohexanol) and WIN 55,212-2 mesylate ((R)-(+)-[2,3-dihydro-5-methyl-3-(4-morpholinylmethyl)pyrrolo[1,2,3-de]-1,4-benzoxazin-6-yl]-1-naphthalenylmethanone mesylate) were purchased from Tocris Bioscience (Bristol, UK) and SR144528 (5-(4-chloro-3-methylphenyl)-1-[(4-methylphenyl)methyl]-N-[(1S,2S,4R)-1,3,3-trimethylbicyclo[2.2.1]hept-2-yl]-1H-pyrazole-3-carboxamide) was purchased from Cayman Chemical (Ann Arbor, MI, USA). Anti-FLAG M1, anti-FLAG M2 monoclonal antibody affinity matrix, Pertussis toxin (PTX), fatty acid-free BSA (BSAfaf), LPI, IBMX (3-isobutyl-1-methylxanthine), poly-D-lysine and cholera toxin were purchased from Sigma (Munich, Germany). HA-11 antibody was from Covance (Vienna, VA, USA).
Results
GPR55 and CB2 receptors co-localize on the cell surface
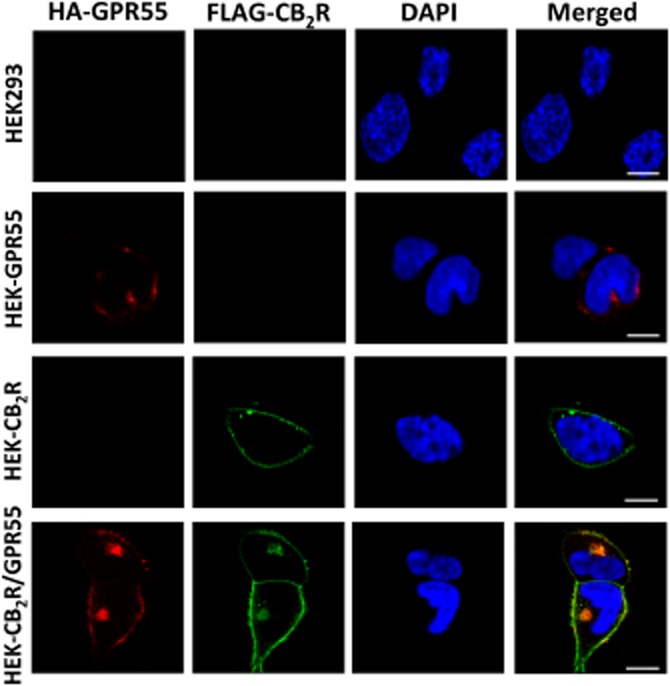
To investigate a possible physical interaction and consequent modulation of signalling cascades by co-expression of CB2 receptors and GPR55, transient transfection of HEK293 cells as well as stable expression of receptors were performed. The two GPCRs were expressed mainly on the cell surface of HEK-GPR55 and HEK-CB2 receptor cells, as well as in HEK-CB2R/GPR55 cells and displayed profound co-localization (Figure 1A). Moreover, quantitative measurement by flow cytometry revealed that surface expression was not significantly affected by the presence of the second receptor (Figure 1B).
Figure 1.

GPR55 and CB2 receptors co-localize on the surface of HEK293 cells and form heteromers. (A) HEK293 cells stably expressing HA-tagged GPR55 (HEK-GPR55), FLAG-tagged CB2 receptor (HEK-CB2R), both receptors (HEK-CB2R/GPR55) or none (HEK293) were fed with anti-HA and anti-FLAG antibodies for 30 min, followed by staining with Alexa Fluor 594-conjugated goat anti-mouse IgG1a (red) and Alexa Fluor 488-conjugated goat anti-mouse IgG2b (green) antibodies and nuclei were counterstained with DAPI. Images were captured and analysed with Zeiss LSM510 META Axioplan confocal microscope and are representative of 2–3 experiments. Original magnification: 40×. Scale bar: 20 μm. (B) Cells were stained with anti-FLAG and/or anti-HA antibody and appropriate secondary antibodies in FACS tubes, fixed and measured in a FACSCalibur flow cytometer (Becton Dickinson, CA, USA). Mean fluorescence intensity (MFI) of GPR55 staining in HEK-GPR55 cells and CB2 receptors in HEK-CB2R cells were considered as 100%, respectively, and were used to normalize receptor expression in double-expressing cells. Data are mean ± SEM from two independent experiments performed in duplicate. (C) Lysates from stable cells lines were centrifuged and parts of the supernatants were kept at −20°C for FLAG, HA and β-actin control blots while the rest of the supernatant was subjected to Co-IP. After SDS-PAGE and transferring to PVDF membranes HA-GPR55, FLAG-CB2R and β-actin were detected using anti-HA, anti-FLAG or anti-β-actin antibody respectively. Representative blots from five independent experiments are shown. (D) Analysis of Co-IP results was conducted by densitometry of protein bands in blots using ImageJ. Data are mean ± SEM from four independent experiments. (E) BRET saturation experiments showing CB2R-GPR55 heteromerization were performed using cells transfected with 0.5 μg of cDNA corresponding to GPR55-Rluc and increasing amounts of cDNA (0–3 μg cDNA) corresponding to CB2R-YFP. As negative control, cells were also transfected with cDNA corresponding to GPR55-Rluc (0.5 μg) and dopamine D4.2R-YFP (0 to 4 μg cDNA). Both fluorescence and luminescence for each sample were measured before each experiment to confirm similar donor expressions (approximately 150 000 bioluminescence units) while monitoring the increase in acceptor expression (100 to 80 000 net fluorescence units). The relative amount of BRET is given as the ratio between the fluorescence of the acceptor minus the fluorescence detected in cells expressing only the donor and the luciferase activity of the donor. BRET data are expressed as the mean ± SEM of 4–8 different experiments; data are grouped according to the signal provided by the BRET acceptor. mBU, mili BRET units. (F) HEK293 cells transiently co-transfected with GPR55-Rluc and CB2R-YFP were fixed and incubated with polyclonal anti-GPR55 antibody followed by staining with Alexa Fluor 546-conjugated goat anti-rabbit IgG antibody, for GPR55-Rluc receptor visualization (red channel). Cell nuclei were stained with TO-PRO-3 (blue channel). Cells were inspected under LSM 510 META (Zeiss, Jena, Germany) inverted confocal microscope equipped with a 40xP-Neofluar (NA 1.3). CB2R-YFP was visualized directly following excitation with the argon laser at 488 nm (green channel). Images were acquired using the Zeiss software (Aim4) and are representative of 2–3 experiments. Original magnification: 40×. Scale bar: 7 μm.
GPR55 forms a heteromer with CB2 receptors
It is well accepted now that the heteromerization of GPCRs can result in both novel ligand binding properties and/or heteromer-specific signalling patterns (Waldhoer et al., 2005; Rivero-Muller et al., 2010; Renner et al., 2012; Sedej et al., 2012). The possible heteromerization of CB2 receptors and GPR55 was explored by two complementary approaches. We conducted a Co-IP assay in whole-cell lysate preparations of HEK293 cells expressing GPR55 and CB2 receptors alone (HEK-GPR55 and HEK-CB2 receptors, respectively) or in combination (HEK-CB2R/GPR55). By using the anti-FLAG antibody we precipitated the CB2 receptor and immunoblotted for the presence of HA-tagged GPR55 in the precipitate. We found that the two GPCRs in fact co-precipitated in lysates from HEK-CB2R/GPR55 cells (Figure 1C and D). In addition, a direct interaction between GPR55 and CB2 receptors was assessed by a BRET biophysical approach. BRET studies in HEK293 cells transfected with GPR55-Rluc and CB2 receptor-YFP indicated a strong energy transfer, that is, close proximity of the donor and acceptor placed in the C-terminus of the two fusion proteins (Figure 1E). The analysis of the expression constructs by confocal microscopy showed that the two receptors, fused to Rluc or YFP, were expressed mainly on the cell surface of transiently transfected (HEK-GPR55-Rluc, HEK-CB2R-YFP and HEK-CB2R-YFP/GPR55-Rluc) cells. As in cells stably expressing CB2 receptors and GPR55 (Figure 1A), co-localization of the two proteins were observed in transiently transfected HEK-CB2R-YFP/GPR55-Rluc cells (Figure 1F). Transient transfection led to functional CB2 receptor-YFP (Callen et al., 2012) and GPR55-Rluc (Supporting Information Fig. S1) proteins as determined by ERK1/2 activation analysis. Saturation of the BRET signal -when the amount of the acceptor (CB2R-YFP) was increased – indicated that the interaction between CB2 receptors and GPR55 to form CB2 receptor/GPR55 heteromers was specific. Fitting the data using a non-linear regression equation allowed calculation of the BRET parameters: BRETmax = 80 ± 10 mBU; BRET50 = 40 ± 10 mBU. The linear relationship between the BRET and YFP/Rluc ratios that was obtained by using D4.2R-YFP (4.2 isoform of the human dopamine D4 receptor) as a negative control, also confirmed the specificity of the CB2 receptor/GPR55 interaction in living HEK293 cells (Figure 1E).
LPI-induced co-internalization
Stimulation of HEK-GPR55 cells with LPI led to the internalization of GPR55 (Figure 2), confirming our previous report (Kargl et al., 2012). The agonist of a receptor in a heteromer may or may not induce co-internalization of the two receptors (Hillion et al., 2002; Kargl et al., 2012). To explore whether GPR55 and CB2 receptors retain their interaction upon GPR55 stimulation, we pre-labelled cells with respective anti-tag antibodies. Whereas LPI treatment did not modify the surface localization of CB2 receptors in HEK-CB2 receptors cells, it induced co-internalization of receptors in HEK-CB2R/GPR55 cells (Figure 2). Expression of CB2 receptors and GPR55 in the absence of LPI stimulation was similar to that displayed in Figure 1. These results suggest a strong interaction of receptors in the heteromer, which results in co-internalization after activation of GPR55.
Figure 2.
LPI-induced co-internalization of CB2 receptors and GPR55. HEK293 cell lines were fed with anti-HA and anti-FLAG antibodies for 30 min followed by stimulation with 2.5 μM LPI for 45 min. Fixed cells were then stained with Alexa Fluor 594-conjugated goat anti-mouse IgG1a (red) and Alexa Fluor 488-conjugated goat anti-mouse IgG2b (green) antibodies and their nuclei were counterstained with DAPI. Images were captured and analysed with Zeiss LSM510 META Axioplan confocal microscope and are representative of 2–3 experiments. Original magnification: 40×. Scale bar: 20 μm.
CB2 receptor-GPR55 cross-talk in transiently transfected cells
As heteromerization can affect signalling by cross-talk within the complex, HEK-GPR55 cells were used to investigate whether activation of NFAT, a transcription factor downstream of GPR55 (Henstridge et al., 2009), is affected by co-expression of CB2 receptors. The results show that activation of NFAT -induced by 1 μM of the GPR55 agonist LPI- was reduced in a dose-dependent manner upon transient expression of CB2 receptors (Figure 3A). This reduction was attributable to the expression of the cannabinoid receptor because transfection with pcDNA3 or a plasmid encoding the unrelated chemokine receptor CCR5 did not affect NFAT activation (Figure 3A). Transcription factors NF-κB and CRE are also activated by GPR55-mediated signalling (Henstridge et al., 2010). Therefore, similar assays were performed using reporter systems specific for NF-κB and CRE, and the results indicate that the effect of 1 μM LPI (Figure 3B and C) in HEK-GPR55 cells was reduced in a dose-dependent fashion by the transient co-expression of CB2 receptors. These results suggest a decreased GPR55-mediated activation of the above-described transcription factors when the two receptors are co-expressed.
Figure 3.

The CB2 receptor reduces the GPR55-mediated activation of transcription factors. HEK-GPR55 cells seeded in 96-well plates were transiently transfected with increasing amounts of pcDNA3, pcDNA-CB2R or pcDNA-CCR5 plasmids along with constant amounts of (A) pNFAT-Luc (B) pNF-κB-Luc or (C) pCRE-Luc plasmids for 48 h. Cells were then stimulated with 1 μM LPI for 6 h in a serum-free medium. Luciferase activity was visualized using Steadylite plus kit (PerkinElmer). Luminescence expressed as relative light units (RLU) was measured in a TopCounter (Top Count NXT; Packard) for 5 s. Data are mean ± SEM of a representative experiment out of 2–3 independent experiments performed in quadruplicate. (D) Cells were transiently transfected with GFP-tagged NFATc3 or EGFP-tagged p65 subunit of NF-κB and after serum starvation cells were stimulated with either vehicle or 5 μM LPI for 30 min. Translocation of GFP-tagged transcription factors was visualized using an Olympus fluorescence microscope equipped with a Hamamatsu ORCA CCD camera. Cell nuclei were stained with DAPI (blue). Representative cells of four independent experiments are shown. Original magnification: 60×. Scale bars: 20 μm.
CB2 receptor-GPR55 cross-talk in stably transfected cells
Activation of NFAT and NF-κB results in their translocation to the nucleus, where they regulate the expression of a variety of genes involved in inflammation, immune response, cell growth and development (Napetschnig and Wu, 2013; Robbs et al., 2013; Stefos et al., 2013; Zaslavsky et al., 2013). HEK293 and stable HEK-CB2 receptor, HEK-GPR55 and HEK-CB2R/GPR55 cells were transiently transfected with either GFP-tagged NFATc3 or GFP-tagged NF-κB p65 plasmids and the nuclear translocation in response to vehicle or LPI was investigated by fluorescence microscopy. Whereas both NFAT and NF-kB displayed exclusively cytosolic localization in all vehicle-treated cells, stimulation of GPR55 in HEK-GPR55 cells led to their nuclear translocation. However, merely cytosolic GFP localization was observed in HEK-CB2 receptor and HEK-CB2R/GPR55 cells after LPI stimulation (Figure 3D).
To further investigate the cross-talk between the two receptors, the effect of LPI was compared in the three stable cell lines along with parental HEK293 cells by using the reporter assay for NFAT activity. NFAT activation was significantly reduced at several LPI concentrations in HEK-CB2 receptor/GPR55 cells compared with its activation in HEK-GPR55 cells (Figure 4A); LPI did not induce NFAT activation in HEK-CB2 receptor cells. To test whether the cross-talk on NFAT activation depends on the type of GPR55 agonist, the synthetic cannabinoid agonist AM251 which also activates GPR55 (Henstridge et al., 2009; 2010) was also used. AM 251-induced NFAT activation was significantly reduced in HEK-CB2R/GPR55 cells (Supporting Information Fig. S2), indicating that the cross-talk in this specific downstream pathway does depend on GPR55 engagement.
Figure 4.

Effect of stable expression of CB2 receptors on GPR55-mediated activation of transcription factors and ERK1/2-MAP kinase. Stable cell lines seeded in 96-well plates were transfected with (A) pNFAT-Luc or (B) pSRE-Luc. Twenty four hours post-transfection, cells were stimulated with increasing concentrations of LPI in serum-free media for 6 h. Luciferase activity was measured as in Figure 3. Data are mean ± SEM of a representative experiment out of 3–5 independent experiments performed in quadruplicate. Statistical analysis was performed to compare SRE responses in HEK-GPR55 versus HEK-CB2R/GPR55 cells by two-way anova followed by Bonferroni's post hoc multiple comparison test. *P < 0.05; **P < 0.01; ***P < 0.001. (C) HEK-GPR55 and HEK-CB2R/GPR55 cells were seeded on six-well plates and 24 h post-serum starvation cells were stimulated with 2.5 μM LPI for 10 min or pretreated for 10 min with the CB2 receptor antagonist SR144528 (250 nM) before agonist treatment. Total ERK1/2 and phosphorylated ERK1/2 in cell lysates were analysed by Western blotting. One representative blot from three independent experiments is shown. (D) Phosphorylated ERK1/2 and ERK1/2 bands in the blots from panel C were analysed by Image Studio software 1.1 (LI-COR Biosciences). Data were normalized to the basal ratio of pERK1/2 to ERK1/2 in HEK-GPR55 cells and are mean ± SEM from three independent experiments. Significant differences were determined by one-way anova followed by post hoc Tukey's t-test (##P < 0.01, ###P < 0.001 compared with control; ***P < 0.001 compared with HEK-CB2R/GPR55 cells treated with LPI) or a Student's t-test (&&&P < 0.001 HEK-GPR55 cells compared with HEK-CB2R/GPR55).
We have previously shown that activation of GPR55 in HEK293 cells leads to cytoskeletal rearrangement (filamentous actin formation; Balenga et al., 2011a). SRE sense F-actin formation and replenish cytoskeletal protein repertoire via gene expression regulation (Miralles et al., 2003; Kuwahara et al., 2005). Given that LPI induces SRE via GPR55 (Kargl et al., 2012), we tested whether CB2 receptor expression regulates this pathway by carrying out a reporter gene assay. Over a wide range of concentrations, LPI had no effect in HEK293 or HEK-CB2 receptor cells, but potently induced SRE in HEK-GPR55 cells. As expected, this response was significantly reduced in HEK-CB2R/GPR55 compared with HEK-GPR55 cells (Figure 4B). Overall, these results in stable transfectants indicate that LPI has no effect on HEK-CB2 receptor cells and reinforces the idea that co-expression of CB2 receptors with GPR55 selectively attenuates signalling pathways downstream of GPR55.
As it may be involved in SRE induction, ERK1/2 phosphorylation (Yang et al., 1999; Buchwalter et al., 2004) in response to LPI was assessed in these cells. There was a significantly higher phosphorylation of ERK1/2 in HEK-CB2R/GPR55 cells as compared with HEK-GPR55 cells after 10 min LPI (2.5 μM) treatment (Figure 4C and D). It is also noteworthy that in HEK-CB2R/GPR55 cells the LPI-mediated (2.5 μM) ERK1/2 activation was significantly attenuated in the presence of SR144528 (250 nM), a specific CB2 receptor antagonist (Figure 4C and D).
To test whether the signalling pathways originating from CB2 receptors are regulated by heteromer formation, we first explored the suitability of CRE reporter assay to study CB2 receptor downstream cascades. WIN 55,212-2 (Figure 5A) and CP 55,940 (Supporting Information Fig. S3) behaved as agonists in HEK-CB2 receptor cells and reduced a 5 μM forskolin-induced CRE activation, proving the functionality of the CB2 receptors in HEK-CB2 receptor cells. In addition, WIN 55,212-2 did not attenuate the forskolin-induced CRE in the absence of CB2 receptors in HEK293 and HEK-GPR55 cells (Figure 5A). The inhibition of forskolin-induced CRE by WIN 55,212-2 was comparable between HEK-CB2 receptor and HEK-CB2R/GPR55 cells (Figure 5B), indicating that CB2 receptor-mediated CRE inhibition is not modulated by heteromer formation. Moreover, NFAT activation by LPI in HEK-CB2R/GPR55 and HEK-GPR55 cells was not significantly affected by either PTX treatment (Figure 5C) or the CB2 receptor inverse agonist AM 630 (Figure 5D), suggesting that CB2 receptors-mediated inhibition of GPR55 signalling to NFAT is Gi-independent and the inverse agonist of CB2R does not restore the GPR55-mediated NFAT activation.
Figure 5.

Gi signalling downstream of CB2 receptors is not involved in the receptor cross-talk that affects transcription factors. (A) Stable cell lines seeded in a 96-well plate were transfected with pCRE-Luc. Twenty four hours post-transfection, cells were pre-incubated with 1 mM IBMX for 10 min in serum-free media. Cells were then treated with increasing concentrations of WIN 55, 212-2 for 30 min followed by stimulation with 5 μM forskolin for 10 min. Luciferase activity was measured as in Figure 3. (B) CRE activation was measured in HEK-CB2 receptor and HEK-CB2R/GPR55 cells in response to several concentrations of WIN 55, 212-2, as described in panel A. (C) HEK-GPR55 and HEK-CB2R/GPR55 cells seeded in 96-well plates were transfected with pNFAT-Luc. Twenty four hours post-transfection, cells were pre-incubated with 100 ng·mL−1 PTX overnight. Thereafter, cells were stimulated with increasing concentrations of LPI in serum-free media containing 25 ng·mL−1 PTX for 6 h. (D) HEK-GPR55 and HEK-CB2R/GPR55 cells were seeded as in panel C and were then pre-incubated with either 5 μM AM 630 or the vehicle (DMSO) for 30 min. Cells were then stimulated with increasing concentrations of LPI as in panel C. Luciferase activity was measured as in Figure 3. Data are mean ± SEM from a representative experiment from three independent experiments performed in quadruplicate.
In addition to the reporter gene assays, we also analysed the ERK1/2 phosphorylation in response to CB2 receptor activation in the three stable cell lines (Figure 6A and B). The effect of the CB2 receptor agonist CP 55,940 on ERK1/2 phosphorylation was significantly reduced in HEK-CB2R/GPR55 cells compared with its activation in HEK-CB2 receptor. Similarly, we did not observe any differential effect induced by SR144528 or AM 630 (CB2 receptor antagonists) in HEK-CB2R/GPR55 cells treated with CP 55,940. These results indicate that the CB2 receptor downstream pathway implicated in ERK1/2 phosphorylation is modulated by heteromer formation. Overall these results indicate that heteromer formation modulates signalling events.
Figure 6.
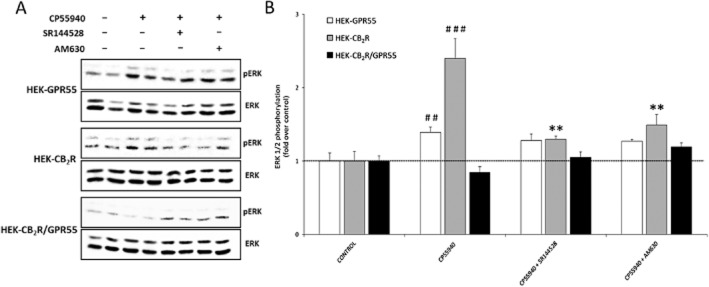
Effect of stable expression of GPR55 on CB2 receptor-mediated activation of ERK1/2-MAP kinase. (A) HEK-GPR55, HEK-CB2 receptor and HEK-CB2R/GPR55 cells were seeded on six-well plates and 24 h post-serum starvation, cells were stimulated with CP 55,940 (100 nM) for 10 min or pretreated for 10 min with CB2 receptor antagonists SR144528 (250 nM) and AM 630 (250 nM) before agonist treatment. Total ERK1/2 and phosphorylated ERK1/2 in cell lysates were analysed by Western blotting with respective antibodies. One representative blot from three independent experiments is shown. (B) Phosphorylated ERK1/2 and ERK1/2 bands in the blots from panel A were analysed by using the Image Studio software 1.1 (LI-COR Biosciences). Data were normalized to the basal ratio of pERK1/2 to ERK1/2 and are mean ± SEM from three independent experiments. Significant differences were analysed by one-way anova followed by post hoc Tukey's t-test (##P < 0.01, ###P < 0.001 compared with control; **P < 0.01 compared with cells treated with CP 55,940).
Label-free approaches to study HEK-CB2R/GPR55 cell responses
In order to assess the modulation of GPR55 signalling cascades under less manipulated conditions, that is, unlabelled live cells, we exploited two label-free assays that provide real-time monitoring of cell mass redistribution or electric impedance respectively. We have previously proven the suitability of DMR assays for studies with GPR55 (Henstridge et al., 2010; Schroder et al., 2010; Balenga et al., 2011a) and with some other – Gi-coupled – GPCRs (Schroder et al., 2010). Therefore, we used this methodology first to compare LPI effects in the absence or presence of CB2 receptors. In fact, DMR responses to a variety of LPI concentrations in HEK-CB2R/GPR55 cells were significantly smaller in amplitude and delayed as compared with those in HEK-GPR55 cells (Figure 7A and B). Impairment of GPR55 signalling in the presence of CB2 receptors is well reflected if the AUC is utilized to compute concentration–effect relationships (Figure 7C). An essentially identical conclusion is derived from data utilizing the slope values of tangents to the origins of the DMR traces (Supporting Information Fig. S5). While LPI did not induce DMR responses either in HEK293 or in HEK-CB2 receptor cells, both cell lines were responsive to ATP used as a positive control (Supporting Information Fig. S4A and B). Similar to our results in the NFAT reporter assay, the CB2 receptor inverse agonist AM 630 (1 μM) did not restore the GPR55-mediated DMR responses (Figure 7D). The DMR response was also analysed in all cell lines using the endogenous CB1/CB2 receptor agonist, 2-AG, and the results show that co-expression of the two receptors blunts the small but measurable response seen in HEK-CB2 receptor cells (Figure 8). Taken together, these results indicate that the CB2 receptor- and the GPR55-mediated responses in holistic DMR recordings are reduced (Figure 7) or even blunted (Figure 8) by co-expression of the two receptors.
Figure 7.

Assessment of cross-talk between GPR55 and CB2R by DMR label-free technology. All stable cell lines were stimulated with increasing concentrations of LPI and the resulting picometer shifts (pm) of reflected light wavelength against time (s) were monitored and are shown for (A) HEK-GPR55 cells and (B) HEK-CB2R/GPR55 cells. (C) Transformation of optical signatures was made by using the AUC values between the 0 and 3600 s time points. Data were normalized and expressed as % of maximum activation induced by LPI in HEK-GPR55 cells. Data are the mean ± SEM of at least three independent experiments each performed in triplicate. Statistical analysis was performed for LPI-mediated responses in HEK-GPR55 versus HEK-CB2R/GPR55 cells by two-way anova followed by Bonferroni's post hoc multiple comparison test. **P < 0.01; ***P < 0.001. (D) HEK-GPR55 and HEK-CB2R/GPR55 cells were seeded as in panel A–C and were then pre-incubated with either 1 μM AM 630 or the vehicle (DMSO) for 1 h. Cells were then stimulated with increasing concentrations of LPI as in panel A–C. Data are analysed as in panel C and are the mean ± SEM of three independent experiments each performed in triplicate. Dashed curves represent data that are taken from Figure 7C and are depicted again to facilitate comparison.
Figure 8.

Assessment of CB2 receptor function in the absence and presence of GPR55 using label-free DMR technology. All stable cell lines were stimulated with 1 μM of the mixed CB1/CB2 receptor agonist, 2-AG, or DMSO as vehicle and the resulting picometer shifts of reflected light wavelength were monitored over time as in Figure 7. Shown are mean values ± SEM of one out of four independent experiments each performed in triplicate.
Impedance traces suggest a complex interaction between GPR55 and CB2 receptors (Figure 9). Treatment of HEK-GPR55 cells with LPI (5 μM) led to a very rapid negative response that was not affected by A-836339, a potent and selective CB2 receptor agonist (Figure 9A). Parental HEK293 cells used as a control failed to respond to LPI or A-836339, but responded to LPA, which was used as a positive control for cell response (Supporting Information Fig. S4C). Also of note was the lack of significant signal in HEK-CB2 receptor cells treated with the potent and selective CB2 receptor agonist, A-836339 (Figure 9C). As a decrease in impedance was reported to be associated with Gs signalling cascade (Peters et al., 2010), cAMP accumulation assays were performed. While forskolin led to a marked increase in intracellular cAMP in HEK-GPR55 cells, LPI failed to significantly increase cAMP levels (Supporting Information Fig. S6), confirming our previous results that GPR55 does not couple to Gαs protein (Schroder et al., 2010). In line with this, the decrease in impedance was not abolished by pretreatment of cells with cholera toxin (data not shown). Intriguingly, in the presence of CB2 receptors (HEK-CB2R/GPR55 cells), the LPI-stimulated induction of the negative response was significantly enhanced compared with HEK-GPR55 cells (Figure 9B). However, a negative cross-talk following CB2 receptor activation was again noticed, since the CB2 receptor agonist A-836339 was able to significantly reduce the LPI-triggered signal in HEK-CB2R/GPR55, but not in HEK-GPR55 cells (Figure 9A–C). These real-time measurements confirm that CB2 receptor activation reduces the signal provided by an agonist-activated GPR55 receptor.
Figure 9.

Assessment of cross-talk between GPR55 and CB2 receptors by impedance determinations. CellKey label-free assays were performed in HEK-GPR55 and HEK-CB2R/GPR55 cells, treated with 1 nM of A-836339 (CB2 receptor agonist), 5 μM of LPI or both. Results correspond to the maximal decrease in impedance with respect to basal levels. Representative traces for individual assays are shown for (A) HEK-GPR55 and (B) HEK-CB2R/GPR55 cells (traces corresponding to 2 s interval recordings of impedance in four different wells). (C) The maximum decay in impedance that is, for each well, automatically provided by the equipment is depicted as bar graph (data for HEK-CB2 receptor also shown). Data are mean ± SEM from 4–8 independent experiments performed in quadruplicates. Statistical significance was calculated by one-way anova followed by Bonferroni's post hoc multiple comparison test (#P < 0.05 with respect to A-836339; *P < 0.05 with respect to LPI).
Discussion
The signalling pathways and function of GPR55 have been under investigation in recent years in several host systems, either in heterologous expression systems such as HEK293 cells (Ryberg et al., 2007; Henstridge et al., 2009), and CHO cells (Lauckner et al., 2008), or in endogenous receptor-expressing B cells (Oka et al., 2010), tumours (Hu et al., 2011; Pineiro et al., 2011; Perez-Gomez et al., 2014), neutrophils (Balenga et al., 2011a), neurons (Lauckner et al., 2008; Obara et al., 2011) or platelets (Kargl et al., 2013). Despite the controversial pharmacology of GPR55 reported in HEK293 cells by different groups, its signalling and function are also confounded by the cell type endogenously expressing this receptor. The last decade has seen a plethora of reports on dimerization and oligomerization of GPCRs, which lead to alteration of individual GPCR signalling, trafficking and thereby function (Rozenfeld and Devi, 2011; Tadagaki et al., 2012). We have recently reported the heteromerization of CB1 receptors and GPR55 in HEK293 cells and their cross-talk with respect to downstream signalling pathways (Kargl et al., 2012). Moreover, we have studied the regulatory function of GPR55 on CB2 receptors in human neutrophils and have reported a putative functional interaction at the level of small GTPases (Balenga et al., 2011a). Here, we tested the hypothesis that GPR55 heteromerizes with CB2 receptors and assessed the signalling cascades in cells expressing the heteromer.
Using various technologies, we demonstrate that GPR55 and CB2 receptor interact when co-expressed in HEK293 cells. We identified receptor heteromers using both Co-IP and BRET assays. We showed that GPR55 specifically heteromerizes with CB2 receptors, but not with an unrelated receptor; in fact co-expression of the dopamine D4.2 receptor with GPR55 did not result in significant and/or saturable BRET. Furthermore, immunofluorescence staining showed the co-localization of both CB2 receptors and GPR55 on the surface of cells. In addition, we could observe a co-internalization of the CB2 receptor with GPR55 when the cells were stimulated with LPI. We next explored the possible modulation of GPR55 signalling by CB2 receptors. When the CB2 receptor was co-expressed with GPR55, the induction of transcription factors downstream of GPR55 by LPI was significantly reduced. This inhibitory effect of CB2 receptors was expression level-dependent, since a gene-dose experiment with CB2 receptor-cDNA resulted in a proportional reduction of the GPR55-mediated NFAT, NF-κB and CRE activation. Similar to its heteromerization with GPR55, the CB2 receptor-mediated effect on GPR55 signalling was specific because co-expression of increasing cDNA doses of CCR5, a constitutively active Gi-coupled GPCR (Lagane et al., 2005), did not alter GPR55 signalling to NFAT. The results in these transiently transfected cells demonstrate that co-expression of CB2 receptors affects the GPR55-mediated signalling.
In addition to the luminescence-based reporter gene assay, we visualized the activation/nuclear translocation of NFAT and NF-κB upon stimulation of GPR55 in the presence and absence of CB2 receptors by fluorescence microscopy. Whereas LPI-stimulated HEK-GPR55 cells showed a predominantly nuclear localization of NFAT and NF-κB, HEK-CB2R/GPR55 cells displayed exclusively cytoplasmic localization of these factors, thus corroborating the CB2 receptor-GPR55 cross-talk detected in luciferase-based assays.
Cross-talk between CB2 receptors and GPR55 also affects the cytoskeletal rearrangement and migration of neutrophils, which express the two receptors (Balenga et al., 2011a). Serum response factor is a downstream transcription factor involved in the regulation of cytoskeletal protein expression (Miano et al., 2007) and proliferation (Vickers et al., 2004) through binding to SRE in the promoter region of respective genes. As SRE is also activated downstream of GPR55 (Kargl et al., 2012), we assessed the induction of SRE to broaden our investigation on the signalling cascades, which are affected by heteromer formation, and found that co-expression of CB2 receptors significantly reduced the LPI/GPR55-mediated SRE induction. We also performed Western blot analysis of ERK1/2 activation by which we showed a potentiation of the LPI effect in HEK-CB2R/GPR55 cells. Also by the ERK1/2 activation analysis we demonstrated a clear cross-antagonism between receptors in co-transfected cells, which by constituting a particular fingerprint, further confirms the formation of CB2 receptor-GPR55 heteromers.
In the present study, we measured the CB2 receptor-mediated inhibition of forskolin-induced CRE that – together with ERK1/2 phosphorylation – is a good readout for CB2 receptor signalling studies in HEK cells. CB2 receptor activation inhibited the CRE induction initiated by forskolin in a concentration-dependent manner in HEK-CB2R cells, proving the functionality of the receptors in the HEK293 cell system. The inhibitory action of CB2 receptors on cAMP-related CRE induction was not significantly modulated in the presence of GPR55 in HEK-CB2R/GPR55 cells. However, exposure of these cells to a CB2 receptor agonist demonstrated that CB2 receptor-induced ERK1/2 activation is inhibited by heteromer formation. In contrast to these observations, we previously found that GPR55 augments the CB2 receptor-mediated chemotaxis and decreases CB2 receptor-mediated reactive oxygen species production (Balenga et al., 2011a). This may imply that GPR55 does not necessarily alter, in the same way, all signalling cascades initiated by Gi-coupled CB2 receptors. It is well-known that the CB2 receptor couples to a PTX-sensitive Gαi protein and there are reports on its constitutive activity (Atwood et al., 2012). We explored the possibility of such downstream cross-talk between CB2 receptors and GPR55 by pre-incubating HEK-GPR55 and HEK-CB2R/GPR55 cells with either PTX to inhibit the Gi-mediated signalling or a CB2 receptor inverse agonist AM 630. We did not detect any change in potency or efficacy of LPI in activating NFAT either in HEK-GPR55 or HEK-CB2R/GPR55 cells by any of these molecules, first corroborating previous reports on Gi-independent signalling of GPR55 (Nevalainen and Irving, 2010) and secondly, proving that the inhibitory effect of CB2 receptors on GPR55 signalling to NFAT is not mediated by any Gi-dependent constitutive activity.
Label-free high-throughput systems have been recently used for deorphanization and delineating the coupling features of GPCRs (Rocheville et al., 2013). We have shown the suitability of DMR assay to study several GPCRs, including GPR55, coupling to various G-proteins (Henstridge et al., 2010; Schroder et al., 2010; Blattermann et al., 2012). Here, we compared the LPI-induced mass redistribution in all of our stable cell lines and found similar results as in the NFAT reporter assay. Namely, the presence of CB2 receptors significantly reduced the overall LPI-mediated signalling and also the response was slowed down as indicated by slope analysis of the initial phase of the DMR traces. Interestingly, the results obtained using the impedance-based label-free system provided evidence of stronger signalling via GPR55 in cells co-expressing CB2 receptors. However, an enhanced signalling capacity of LPI on the heteromer was, again, attenuated by the CB2 receptor activation, suggesting that heteromer formation modulates GPR55 function and that CB2 receptors activation further affects the signalling of the partner receptor. It should also be noted that the reduction in impedance, which seems to represent a characteristic feature for Gs-coupled receptors (Scott and Peters, 2010), was not due to coupling of GPR55 to Gs. Apart from the lack of reports linking GPR55 to Gs, LPI failed to induce cAMP production and cholera toxin at a concentration of 100 ng·mL−1 was not able to block the label-free signal. As GPR55 is likely to be coupled to G12/13 and/or Gq-proteins (Lauckner et al., 2008; Henstridge et al., 2009), our data suggest that coupling to these G-proteins may give impedance reductions qualitatively similar to those obtained upon coupling to Gs. Noteworthy, we have previously shown that co-activation of GPR55 (by LPI) and CB2 receptors (by 2-AG) will increase the NFAT activation and DMR responses in HEK-CB2R/GPR55 cells (Balenga et al., 2011a). Therefore, whereas GPR55-mediated DMR responses are reduced or augmented, respectively, when the CB2 receptor is in a ligand-free state or co-activated, the impedance results show a reverse behaviour; the presence of ligand-free CB2 receptor leads to a marked negative response and co-activation of the two receptors reduces this negative response.
Previous reports have shown that some of the compounds used in the current study may bind to GPR55 and to cannabinoid receptors, and this partly explains why GPR55 was even considered as a third cannabinoid receptor (Johns et al., 2007; Brown and Robin Hiley, 2009). The natural cannabinoid, tetrahydrocannabinol, was suggested to also bind to GPR55 (Lauckner et al., 2008). CP 55,940, a non-selective CB1/CB2 cannabinoid receptor agonist (Felder et al., 1995; Showalter et al., 1996; Thomas et al., 1998), was initially reported to be an agonist for GPR55 (Ryberg et al., 2007) but subsequent studies from three independent laboratories have identified it as a GPR55 antagonist (Henstridge et al., 2009; Kapur et al., 2009; Brown et al., 2011). Moreover, although the endogenous CB1/CB2 receptor agonist, 2-AG, was reported as potent GPR55 agonist (Ryberg et al., 2007), others have not found GPR55 stimulation by this compound (Lauckner et al., 2008; Henstridge et al., 2009; Kapur et al., 2009). All these data show the complexity of characterizing GPR55 ligands and signalling pathways. Importantly, the potential interaction of ligands with both CB2 receptors and GPR55 does not affect the conclusions of this paper. Moreover a CB2-GP55 receptor-heteromer-selectivity may explain some of the conflicting results. This possibility merits further experimental effort.
Taken together, the results indicate that different pathways are engaged by either CB2 receptors or GPR55 and that they are differentially regulated when these receptors are co-expressed. A scheme of events based on our results is depicted in Figure 10. Our biochemical and reporter assays provided data that were qualitatively different from those obtained by label-free measurements. This convergent approach taking advantage of a wide spectrum of tools to analyse GPCR-mediated signalling gives valuable complementary information. Co-expression of the two receptors reduces many aspects of GPR55-mediated signalling. The experimental approaches show that simply by receptor co-expression, that is, without activation of CB2 receptors, the LPI-induced signalling may be attenuated. DMR data also indicate that the relatively small signal due to CB2 receptor activation is blunted just by co-expression with GPR55 receptors. Therefore, it seems that heteromer formation leads to a distinct coupling to the signalling machinery and that further activation of one receptor leads to conformational changes (inter-receptor cross-talk) that affect coupling to the transducer proteins (G-proteins or else in G-independent signalling). Interestingly, the effect of the heteromer is not always antagonistic as GPR55-mediated ERK1/2 activation is augmented upon heteromer formation and as LPI produces a more marked negative impedance signal in heteromer-expressing cells. The shape of the impedance signal is not the one expected for Gi-mediated coupling and would rather be consistent with a Gs-mediated effect. As the negative impedance was not significantly affected by cholera toxin it may be due to another G-protein or it may result from G-protein-independent coupling. Although impedance signal triggered by LPI is higher in HEK-CB2R/GPR55 than in HEK-GPR55 cells, CB2 receptor agonists negatively regulated the GPR55-mediated effects. Of note CB2 receptor agonists, in DMR or impedance assays, had little effect in HEK-CB2 receptor cells, while they significantly reduced the GPR55-induced signalling. Studies on HEK cells may provide more information about such cross-talk than other cells in which CB2 receptors are more responsive to agonists (data in preparation). As an example, one of the agonists used, A-836339, behaves as a potent selective CB2 receptor agonist (Yao et al., 2009) in HEK293 cells, but screening/functional assays require stable co-expression with a chimeric, Gαq/o5, protein (Yao et al., 2008). The HEK-CB2 receptor cells used here indeed have functional receptors with marked responses in ERK1/2 and reporter assays, small response in DMR assays and no significant response in impedance read-outs. Cross-modulation may result from intermolecular interactions within the heteromer, from agonist-induced conformational changes transmitted to the partner receptor in the heteromer and from differential coupling of the heteromer to the G-protein-dependent/independent transduction machinery. Interestingly, the reduction of forskolin-induced CRE activation by CB2 receptor agonists was not affected by heteromer expression thus suggesting that CB2 receptor-GPR55 heteromers do not couple to Gi.
Figure 10.

Scheme of signalling modulation in the CB2 receptor-GPR55 heteromer. (A) Modification of LPI-induced signalling in the heteromer and inhibition of LPI-induced ERK1/2 activation by CB2 receptor antagonists (cross-antagonism). (B) Modification of CB2 receptor agonist-induced signalling in the heteromer; although co-expression of GPR55 does not modulate the Gi-mediated CB2 receptor signalling to oppose cAMP production, it suppresses the CB2 receptor-initiated ERK1/2 activation. (C) Summary of label-free responses (DMR and impedance: dZiec) upon activation by cannabinoid agonists and/or LPI.
We have previously shown that the CB2 receptor-mediated production of reactive oxygen species and migration of human neutrophils are regulated by GPR55 (Balenga et al., 2011a). This cross-talk is likely to be due to receptor heteromerization. As heteromers are functionally different entities, that is, signalling has properties specific for the heteromer that cannot be provided by the individual receptors (Ferre et al., 2009), it is likely that neutrophils display CB2 receptor-GPR55 heteromers and heteromer-specific signalling. Other cells of the immune system and microglial cells of the CNS are candidates to express the two receptors and, probably, also CB2 receptor and GPR55 heteromers. Furthermore, CB2 receptors and GPR55 are targets for analgesic therapy (Cheng and Hitchcock, 2007; Staton et al., 2008; Guindon and Hohmann, 2009; Balenga et al., 2011b) and, consequently, further work may help to elucidate the role of CB2 receptor-GPR55 heteromers in pain control. Some types of cancer are reported to be enriched in either of the receptors, which are being considered in the therapy of malignant proliferation (Andradas et al., 2011; Guindon and Hohmann, 2011). Therefore, tumour cells expressing the two receptors may display CB2 receptor-GPR55 heteromers, whose differential link to the cell signalling machinery may result in novel heteromer-based strategies to combat cancer. Elucidating such possibilities in primary tumour cells and leukocytes are currently in progress.
Acknowledgments
The authors would like to thank Ainhoa Oñatibia-Astibia for her technical support, Dr. J. Silvio Gutkind for providing pSRE-Luc plasmid, Dr. Masamitsu Iino for providing GFP-NFATc3 plasmid, Dr. Wolfgang Graier for providing EGFP-tagged NF-κB p65 plasmid and Dr. Andrew J. Irving for providing the HEK-GPR55 cells. N. A. B. would like to dedicate this article to Arya Balenga, who was born the morning after N. A. B. accomplished the major findings of this article. This research was supported by grant support from the Austrian Science Fund FWF (P22521) and the Jubiläumsfonds of the Austrian National Bank (14263) (all to A. H.), a fellowship from the ‘Molecular Medicine PhD program’ from the Medical University of Graz (to N. A. B. and J. K.) and grant (SAF2012-39875-C02-01) from the Spanish Ministry and Economy and Competitivity SAF (to R. F.). SAF2012-39875-C02-01 includes FEDER (fondo Europeo de desarrollo regional) funds. M. P. was supported by the Doctoral College DK-MOLIN (W1241) granted by the Austrian Science Fund FWF. We are grateful to Corning Inc. for their support on the Epic DMR system.
Glossary
- A-836339
[2,2,3,3-tetramethyl-cyclopropanecarboxylic acid [3-(2-methoxy-ethyl)-4,5-dimethyl-3H-thiazol-(2Z)-ylidene]- amide]
- AM 251
N-(piperidin-1-yl)-5-(4-iodophenyl)-1-(2,4-dichlorophenyl)-4-methyl-1H-pyrazole-3-carboxamide
- AM 630
6-iodo-2-methyl-1-[2-(4-morpholinyl-)ethyl]-1H-indol-3-yl](4-methoxyphenyl)methanone
- CB2 receptor
cannabinoid receptor 2
- CP 55,940
((-)-cis-3-[2-hydroxy-4-(1,1-dimethylheptyl)phenyl]-trans-4-(3-hydroxypropyl)cyclohexanol)
- CRE
cAMP response element
- DMR
dynamic mass redistribution
- GPR55
GPCR 55
- LPI
L-α-lysophosphatidylinositol
- NFAT
nuclear factor of activated T-cells
- RLU
relative light unit
- Rluc
Renilla luciferase
- SR144528
5-(4-chloro-3-methylphenyl)-1-[(4-methylphenyl)methyl]-N-[(1S,2S,4R)-1,3,3-trimethylbicyclo[2.2.1]hept-2-yl]-1H-pyrazole-3-carboxamide
- SRE
serum response element
- WIN 55
212-2 (R)-(+)-[2,3-dihydro-5-methyl-3-(4-morpholinylmethyl)pyrrolo[1,2,3-de]-1,4-benzoxazin-6-yl]-1-naphthalenylmethanone
Author contributions
N. A. B. proposed the hypothesis, designed, executed and analysed the following experiments: stable cell line generation, flow cytometry, immunofluorescence staining, fluorescence microscopy, Co-IP, DMR assay, ERK phosphorylation and reporter gene assays. N. A. B. wrote the manuscript. E. M-P. designed, performed and analysed the following assays: ERK phosphorylation, cAMP accumulation and bioluminescence resonance energy transfer. A. R. and M. Z. conducted the CellKey label-free impedance experiments. A. R. also performed a part of ERK phosphorylation assays. J. M. P-O. conducted and analysed label-free impedance experiments. I. D-R. contributed to the assays of co-localization by confocal microscopy after immunocytochemistry. R. F. contributed in formulating the initial hypothesis, directing the work in CIMA (Pamplona), coordinating efforts from different laboratories and writing the manuscript. J. K. performed and analysed Co-IP assays. R. S. conducted and analysed the DMR assays. M. P. performed the receptor internalization assay, immunofluorescence staining, fluorescence and confocal microscopy. W. P. assisted in generating the stable cell lines. Z. B. assisted in confocal microscopy imaging and analysis. E. K. supervised the DMR assays and contributed in scientific discussions and manuscript writing. M. W. and A. K. supervised the project and contributed in scientific discussions and manuscript writing.
Conflict of interest
None.
Supporting Information
Additional Supporting Information may be found in the online version of this article at the publisher's web-site: http://dx.doi.org/10.1111/bph.12850
HEK293 cells transiently transfected with GPR55-Rluc were seeded on six-well plates and 24 h post serum starvation cells were stimulated with 1 μM LPI for 10 min. Total ERK1/2 and phosphorylated ERK1/2 in cell lysates were analysed by Western blotting. Data are normalized to the basal ratio of pERK1/2 to ERK1/2 and are mean ± SEM from three independent experiments. Data were tested for significant differences by Students& t-test, **P < 0.01.
Figure S2 All stable cell lines seeded in 96-well plates were transfected with pNFAT-Luc. Twenty four hours post-transfection, cells were stimulated with increasing concentrations of AM 251 in serum-free media for 6 h. Luciferase activity was measured as in Figure 3. Data are mean ± SEM of a representative experiment out of three independent experiments performed in duplicate. Statistical analysis was performed by two-way anova followed by Bonferroni&s post hoc multiple comparison test. ***P < 0.001.
Figure S3 HEK-CB2 receptor cells seeded in a 96-well plate were transfected with pCRE-Luc. Twenty-four hours post transfection, cells were pre-incubated with 1 mM IBMX for 10 min in serum-free media. Cells were then treated with 1 or 10 μM CP 55,904 for 30 min followed by stimulation with 5 μM forskolin for 10 min. Luciferase activity was measured as in Figure 3. Data are mean ± SEM of a representative experiment out of three independent experiments performed in quadruplicate.
Figure S4 (A) HEK293 or (B) HEK-CB2 receptor cells were stimulated with increasing concentrations of LPI or 100 μM ATP and the resulting picometer shifts of reflected light wavelength against time (s) were monitored in DMR assay as in Figure 7. (C) Real-time impedance recordings for HEK293 treated with A-836339 (5 μM), LPI (5 μM) or LPA (5 μM).
Figure S5 Quantitative comparison of CB2 receptor-GPR55 cross-talk using label-free whole-cell DMR recordings. (A) Concentration-effect relationship for LPI stimulating GPR55 in the absence and presence of CB2 receptor. Curves were computed by utilizing the AUC between 0 and 3600 s. Curves are presented as dashed lines and were taken from Figure 7C to facilitate comparison with panel B. (B) Concentration–effect relationships as shown in A but derived from the slope of tangents to the origins of each real-time recording. (C and D) Representative real-time recordings including the tangents for calculation of slope values to compute concentration–effect curves. Data in A and B show mean values ± SEM of at least three independent experiments; data in C and D are mean values ± SEM of one representative dataset. Statistical analysis was performed for LPI-mediated responses in HEK-GPR55 versus HEK-CB2R/GPR55 cells by two-way anova followed by Bonferroni&s post hoc multiple comparison test. **P < 0.01; ***P < 0.001.
Figure S6 cAMP determination in HEK-GPR55 cells. LPI did not induce cAMP accumulation in HEK293 stably expressing GPR55 receptor; forskolin was used as positive control. cAMP levels were determined using the HTRF® cAMP assay kit as indicated in Methods. Data are the mean ± SEM from at least three independent experiments. ***P < 0.001.
References
- Alexander SP, Benson HE, Faccenda E, Pawson AJ, Sharman JL, Spedding M, et al. The Concise Guide to PHARMACOLOGY 2013/14: G protein-coupled receptors. Br J Pharmacol. 2013a;170:1459–1581. doi: 10.1111/bph.12445. [DOI] [PMC free article] [PubMed] [Google Scholar]
- Alexander SP, Benson HE, Faccenda E, Pawson AJ, Sharman JL, Spedding M, et al. The Concise Guide to PHARMACOLOGY 2013/14: Enzymes. Br J Pharmacol. 2013b;170:1797–1867. doi: 10.1111/bph.12451. [DOI] [PMC free article] [PubMed] [Google Scholar]
- Andradas C, Caffarel MM, Perez-Gomez E, Salazar M, Lorente M, Velasco G, et al. The orphan G protein-coupled receptor GPR55 promotes cancer cell proliferation via ERK. Oncogene. 2011;30:245–252. doi: 10.1038/onc.2010.402. [DOI] [PubMed] [Google Scholar]
- Atwood BK, Straiker A, Mackie K. CB(2): therapeutic target-in-waiting. Prog Neuropsychopharmacol Biol Psychiatry. 2012;38:16–20. doi: 10.1016/j.pnpbp.2011.12.001. [DOI] [PMC free article] [PubMed] [Google Scholar]
- Balenga NA, Aflaki E, Kargl J, Platzer W, Schroder R, Blattermann S, et al. GPR55 regulates cannabinoid 2 receptor-mediated responses in human neutrophils. Cell Res. 2011a;21:1452–1469. doi: 10.1038/cr.2011.60. [DOI] [PMC free article] [PubMed] [Google Scholar]
- Balenga NA, Henstridge CM, Kargl J, Waldhoer M. Pharmacology, signaling and physiological relevance of the G protein-coupled receptor 55. Adv Pharmacol. 2011b;62:251–277. doi: 10.1016/B978-0-12-385952-5.00004-X. [DOI] [PubMed] [Google Scholar]
- Basu S, Ray A, Dittel BN. Cannabinoid receptor 2 (CB2) plays a role in the generation of germinal center and memory B cells, but not in the production of antigen-specific IgG and IgM, in response to T-dependent antigens. PLoS ONE. 2013;8:e67587. doi: 10.1371/journal.pone.0067587. [DOI] [PMC free article] [PubMed] [Google Scholar]
- Blattermann S, Peters L, Ottersbach PA, Bock A, Konya V, Weaver CD, et al. A biased ligand for OXE-R uncouples Galpha and Gbetagamma signaling within a heterotrimer. Nat Chem Biol. 2012;8:631–638. doi: 10.1038/nchembio.962. [DOI] [PubMed] [Google Scholar]
- Brown AJ, Robin Hiley C. Is GPR55 an anandamide receptor? Vitam Horm. 2009;81:111–137. doi: 10.1016/S0083-6729(09)81005-4. [DOI] [PubMed] [Google Scholar]
- Brown AJ, Daniels DA, Kassim M, Brown S, Haslam CP, Terrell VR, et al. Pharmacology of GPR55 in yeast and identification of GSK494581A as a mixed-activity glycine transporter subtype 1 inhibitor and GPR55 agonist. J Pharmacol Exp Ther. 2011;337:236–246. doi: 10.1124/jpet.110.172650. [DOI] [PubMed] [Google Scholar]
- Buchwalter G, Gross C, Wasylyk B. Ets ternary complex transcription factors. Gene. 2004;324:1–14. doi: 10.1016/j.gene.2003.09.028. [DOI] [PubMed] [Google Scholar]
- Callen L, Moreno E, Barroso-Chinea P, Moreno-Delgado D, Cortes A, Mallol J, et al. Cannabinoid receptors CB1 and CB2 form functional heteromers in brain. J Biol Chem. 2012;287:20851–20865. doi: 10.1074/jbc.M111.335273. [DOI] [PMC free article] [PubMed] [Google Scholar]
- Cheng Y, Hitchcock SA. Targeting cannabinoid agonists for inflammatory and neuropathic pain. Expert Opin Investig Drugs. 2007;16:951–965. doi: 10.1517/13543784.16.7.951. [DOI] [PubMed] [Google Scholar]
- Felder CC, Joyce KE, Briley EM, Mansouri J, Mackie K, Blond O, et al. Comparison of the pharmacology and signal transduction of the human cannabinoid CB1 and CB2 receptors. Mol Pharmacol. 1995;48:443–450. [PubMed] [Google Scholar]
- Ferre S, Baler R, Bouvier M, Caron MG, Devi LA, Durroux T, et al. Building a new conceptual framework for receptor heteromers. Nat Chem Biol. 2009;5:131–134. doi: 10.1038/nchembio0309-131. [DOI] [PMC free article] [PubMed] [Google Scholar]
- Fredriksson R, Lagerstrom MC, Lundin LG, Schioth HB. The G-protein-coupled receptors in the human genome form five main families. Phylogenetic analysis, paralogon groups, and fingerprints. Mol Pharmacol. 2003;63:1256–1272. doi: 10.1124/mol.63.6.1256. [DOI] [PubMed] [Google Scholar]
- Guindon J, Hohmann AG. The endocannabinoid system and pain. CNS Neurol Disord Drug Targets. 2009;8:403–421. doi: 10.2174/187152709789824660. [DOI] [PMC free article] [PubMed] [Google Scholar]
- Guindon J, Hohmann AG. The endocannabinoid system and cancer: therapeutic implication. Br J Pharmacol. 2011;163:1447–1463. doi: 10.1111/j.1476-5381.2011.01327.x. [DOI] [PMC free article] [PubMed] [Google Scholar]
- Henstridge CM, Balenga NA, Ford LA, Ross RA, Waldhoer M, Irving AJ. The GPR55 ligand L-alpha-lysophosphatidylinositol promotes RhoA-dependent Ca2+ signaling and NFAT activation. FASEB J. 2009;23:183–193. doi: 10.1096/fj.08-108670. [DOI] [PubMed] [Google Scholar]
- Henstridge CM, Balenga NA, Schroder R, Kargl JK, Platzer W, Martini L, et al. GPR55 ligands promote receptor coupling to multiple signalling pathways. Br J Pharmacol. 2010;160:604–614. doi: 10.1111/j.1476-5381.2009.00625.x. [DOI] [PMC free article] [PubMed] [Google Scholar]
- Hiley CR, Kaup SS. GPR55 and the vascular receptors for cannabinoids. Br J Pharmacol. 2007;152:559–561. doi: 10.1038/sj.bjp.0707421. [DOI] [PMC free article] [PubMed] [Google Scholar]
- Hillion J, Canals M, Torvinen M, Casado V, Scott R, Terasmaa A, et al. Coaggregation, cointernalization, and codesensitization of adenosine A2A receptors and dopamine D2 receptors. J Biol Chem. 2002;277:18091–18097. doi: 10.1074/jbc.M107731200. [DOI] [PubMed] [Google Scholar]
- Howlett AC. Cannabinoid receptor signaling. Handb Exp Pharmacol. 2005;168:53–79. doi: 10.1007/3-540-26573-2_2. [DOI] [PubMed] [Google Scholar]
- Hu G, Ren G, Shi Y. The putative cannabinoid receptor GPR55 promotes cancer cell proliferation. Oncogene. 2011;30:139–141. doi: 10.1038/onc.2010.502. [DOI] [PubMed] [Google Scholar]
- Johns DG, Behm DJ, Walker DJ, Ao Z, Shapland EM, Daniels DA, et al. The novel endocannabinoid receptor GPR55 is activated by atypical cannabinoids but does not mediate their vasodilator effects. Br J Pharmacol. 2007;152:825–831. doi: 10.1038/sj.bjp.0707419. [DOI] [PMC free article] [PubMed] [Google Scholar]
- Kapur A, Zhao P, Sharir H, Bai Y, Caron MG, Barak LS, et al. Atypical responsiveness of the orphan receptor GPR55 to cannabinoid ligands. J Biol Chem. 2009;284:29817–29827. doi: 10.1074/jbc.M109.050187. [DOI] [PMC free article] [PubMed] [Google Scholar]
- Kargl J, Balenga N, Parzmair GP, Brown AJ, Heinemann A, Waldhoer M. The cannabinoid receptor CB1 modulates the signaling properties of the lysophosphatidylinositol receptor GPR55. J Biol Chem. 2012;287:44234–44248. doi: 10.1074/jbc.M112.364109. [DOI] [PMC free article] [PubMed] [Google Scholar]
- Kargl J, Brown AJ, Andersen L, Dorn G, Schicho R, Waldhoer M, et al. A selective antagonist reveals a potential role of G protein-coupled receptor 55 in platelet and endothelial cell function. J Pharmacol Exp Ther. 2013;346:54–66. doi: 10.1124/jpet.113.204180. [DOI] [PubMed] [Google Scholar]
- Kuwahara K, Barrientos T, Pipes GC, Li S, Olson EN. Muscle-specific signaling mechanism that links actin dynamics to serum response factor. Mol Cell Biol. 2005;25:3173–3181. doi: 10.1128/MCB.25.8.3173-3181.2005. [DOI] [PMC free article] [PubMed] [Google Scholar]
- Lagane B, Ballet S, Planchenault T, Balabanian K, Le Poul E, Blanpain C, et al. Mutation of the DRY motif reveals different structural requirements for the CC chemokine receptor 5-mediated signaling and receptor endocytosis. Mol Pharmacol. 2005;67:1966–1976. doi: 10.1124/mol.104.009779. [DOI] [PubMed] [Google Scholar]
- Lander ES, Linton LM, Birren B, Nusbaum C, Zody MC, Baldwin J, et al. Initial sequencing and analysis of the human genome. Nature. 2001;409:860–921. doi: 10.1038/35057062. [DOI] [PubMed] [Google Scholar]
- Lauckner JE, Jensen JB, Chen HY, Lu HC, Hille B, Mackie K. GPR55 is a cannabinoid receptor that increases intracellular calcium and inhibits M current. Proc Natl Acad Sci U S A. 2008;105:2699–2704. doi: 10.1073/pnas.0711278105. [DOI] [PMC free article] [PubMed] [Google Scholar]
- Martini L, Waldhoer M, Pusch M, Kharazia V, Fong J, Lee JH, et al. Ligand-induced down-regulation of the cannabinoid 1 receptor is mediated by the G-protein-coupled receptor-associated sorting protein GASP1. FASEB J. 2007;21:802–811. doi: 10.1096/fj.06-7132com. [DOI] [PubMed] [Google Scholar]
- Matsuda LA, Lolait SJ, Brownstein MJ, Young AC, Bonner TI. Structure of a cannabinoid receptor and functional expression of the cloned cDNA. Nature. 1990;346:561–564. doi: 10.1038/346561a0. [DOI] [PubMed] [Google Scholar]
- Miano JM, Long X, Fujiwara K. Serum response factor: master regulator of the actin cytoskeleton and contractile apparatus. Am J Physiol Cell Physiol. 2007;292:C70–C81. doi: 10.1152/ajpcell.00386.2006. [DOI] [PubMed] [Google Scholar]
- Miralles F, Posern G, Zaromytidou AI, Treisman R. Actin dynamics control SRF activity by regulation of its coactivator MAL. Cell. 2003;113:329–342. doi: 10.1016/s0092-8674(03)00278-2. [DOI] [PubMed] [Google Scholar]
- Napetschnig J, Wu H. Molecular basis of NF-kappaB signaling. Annu Rev Biophys. 2013;42:443–468. doi: 10.1146/annurev-biophys-083012-130338. [DOI] [PMC free article] [PubMed] [Google Scholar]
- Nevalainen T, Irving AJ. GPR55, a lysophosphatidylinositol receptor with cannabinoid sensitivity? Curr Top Med Chem. 2010;10:799–813. doi: 10.2174/156802610791164229. [DOI] [PubMed] [Google Scholar]
- Obara Y, Ueno S, Yanagihata Y, Nakahata N. Lysophosphatidylinositol causes neurite retraction via GPR55, G13 and RhoA in PC12 cells. PLoS ONE. 2011;6:e24284. doi: 10.1371/journal.pone.0024284. [DOI] [PMC free article] [PubMed] [Google Scholar]
- Oka S, Nakajima K, Yamashita A, Kishimoto S, Sugiura T. Identification of GPR55 as a lysophosphatidylinositol receptor. Biochem Biophys Res Commun. 2007;362:928–934. doi: 10.1016/j.bbrc.2007.08.078. [DOI] [PubMed] [Google Scholar]
- Oka S, Toshida T, Maruyama K, Nakajima K, Yamashita A, Sugiura T. 2-Arachidonoyl-sn-glycero-3-phosphoinositol: a possible natural ligand for GPR55. J Biochem. 2009;145:13–20. doi: 10.1093/jb/mvn136. [DOI] [PubMed] [Google Scholar]
- Oka S, Kimura S, Toshida T, Ota R, Yamashita A, Sugiura T. Lysophosphatidylinositol induces rapid phosphorylation of p38 mitogen-activated protein kinase and activating transcription factor 2 in HEK293 cells expressing GPR55 and IM-9 lymphoblastoid cells. J Biochem. 2010;147:671–678. doi: 10.1093/jb/mvp208. [DOI] [PubMed] [Google Scholar]
- Pacher P, Kunos G. Modulating the endocannabinoid system in human health and disease–successes and failures. FEBS J. 2013;280:1918–1943. doi: 10.1111/febs.12260. [DOI] [PMC free article] [PubMed] [Google Scholar]
- Pacher P, Batkai S, Kunos G. The endocannabinoid system as an emerging target of pharmacotherapy. Pharmacol Rev. 2006;58:389–462. doi: 10.1124/pr.58.3.2. [DOI] [PMC free article] [PubMed] [Google Scholar]
- Pawson AJ, Sharman JL, Benson HE, Faccenda E, Alexander SP, Buneman OP, et al. NC-IUPHAR. The IUPHAR/BPS Guide to PHARMACOLOGY: an expert-driven knowledgebase of drug targets and their ligands. Nucl. Acids Res. 42(Database Issue):D1098–1106. doi: 10.1093/nar/gkt1143. [DOI] [PMC free article] [PubMed] [Google Scholar]
- Perez-Gomez E, Andradas C, Flores JM, Quintanilla M, Paramio JM, Guzman M, et al. The orphan receptor GPR55 drives skin carcinogenesis and is upregulated in human squamous cell carcinomas. Oncogene. 2014;32:2534–2542. doi: 10.1038/onc.2012.278. 2013. [DOI] [PubMed] [Google Scholar]
- Pertwee RG. GPR55: a new member of the cannabinoid receptor clan? Br J Pharmacol. 2007;152:984–986. doi: 10.1038/sj.bjp.0707464. [DOI] [PMC free article] [PubMed] [Google Scholar]
- Pertwee RG, Howlett AC, Abood ME, Alexander SP, Di Marzo V, Elphick MR, et al. International union of basic and clinical pharmacology. LXXIX. Cannabinoid receptors and their ligands: beyond CB(1) and CB(2) Pharmacol Rev. 2010;62:588–631. doi: 10.1124/pr.110.003004. [DOI] [PMC free article] [PubMed] [Google Scholar]
- Peters MF, Vaillancourt F, Heroux M, Valiquette M, Scott CW. Comparing label-free biosensors for pharmacological screening with cell-based functional assays. Assay Drug Dev Technol. 2010;8:219–227. doi: 10.1089/adt.2009.0232. [DOI] [PubMed] [Google Scholar]
- Petitet F, Donlan M, Michel A. GPR55 as a new cannabinoid receptor: still a long way to prove it. Chem Biol Drug Des. 2006;67:252–253. doi: 10.1111/j.1747-0285.2006.00370.x. [DOI] [PubMed] [Google Scholar]
- Pineiro R, Maffucci T, Falasca M. The putative cannabinoid receptor GPR55 defines a novel autocrine loop in cancer cell proliferation. Oncogene. 2011;30:142–152. doi: 10.1038/onc.2010.417. [DOI] [PubMed] [Google Scholar]
- Ramirez SH, Reichenbach NL, Fan S, Rom S, Merkel SF, Wang X, et al. Attenuation of HIV-1 replication in macrophages by cannabinoid receptor 2 agonists. J Leukoc Biol. 2013;93:801–810. doi: 10.1189/jlb.1012523. [DOI] [PMC free article] [PubMed] [Google Scholar]
- Renner U, Zeug A, Woehler A, Niebert M, Dityatev A, Dityateva G, et al. Heterodimerization of serotonin receptors 5-HT1A and 5-HT7 differentially regulates receptor signalling and trafficking. J Cell Sci. 2012;125(Pt 10):2486–2499. doi: 10.1242/jcs.101337. [DOI] [PubMed] [Google Scholar]
- Rivero-Muller A, Chou YY, Ji I, Lajic S, Hanyaloglu AC, Jonas K, et al. Rescue of defective G protein-coupled receptor function in vivo by intermolecular cooperation. Proc Natl Acad Sci U S A. 2010;107:2319–2324. doi: 10.1073/pnas.0906695106. [DOI] [PMC free article] [PubMed] [Google Scholar]
- Robbs BK, Lucena PI, Viola JP. The transcription factor NFAT1 induces apoptosis through cooperation with Ras/Raf/MEK/ERK pathway and upregulation of TNF-alpha expression. Biochim Biophys Acta. 2013;1833:2016–2028. doi: 10.1016/j.bbamcr.2013.04.003. [DOI] [PubMed] [Google Scholar]
- Rocheville M, Martin J, Jerman J, Kostenis E. Mining the potential of label-free biosensors for seven-transmembrane receptor drug discovery. Prog Mol Biol Transl Sci. 2013;115:123–142. doi: 10.1016/B978-0-12-394587-7.00003-8. [DOI] [PubMed] [Google Scholar]
- Rozenfeld R, Devi LA. Exploring a role for heteromerization in GPCR signalling specificity. Biochem J. 2011;433:11–18. doi: 10.1042/BJ20100458. [DOI] [PMC free article] [PubMed] [Google Scholar]
- Ryberg E, Larsson N, Sjogren S, Hjorth S, Hermansson NO, Leonova J, et al. The orphan receptor GPR55 is a novel cannabinoid receptor. Br J Pharmacol. 2007;152:1092–1101. doi: 10.1038/sj.bjp.0707460. [DOI] [PMC free article] [PubMed] [Google Scholar]
- Schroder R, Janssen N, Schmidt J, Kebig A, Merten N, Hennen S, et al. Deconvolution of complex G protein-coupled receptor signaling in live cells using dynamic mass redistribution measurements. Nat Biotechnol. 2010;28:943–949. doi: 10.1038/nbt.1671. [DOI] [PubMed] [Google Scholar]
- Scott CW, Peters MF. Label-free whole-cell assays: expanding the scope of GPCR screening. Drug Discov Today. 2010;15:704–716. doi: 10.1016/j.drudis.2010.06.008. [DOI] [PubMed] [Google Scholar]
- Sedej M, Schroder R, Bell K, Platzer W, Vukoja A, Kostenis E, et al. D-type prostanoid receptor enhances the signaling of chemoattractant receptor-homologous molecule expressed on T(H)2 cells. J Allergy Clin Immunol. 2012;129:492–500. doi: 10.1016/j.jaci.2011.08.015. , 500 e491-499. [DOI] [PubMed] [Google Scholar]
- Showalter VM, Compton DR, Martin BR, Abood ME. Evaluation of binding in a transfected cell line expressing a peripheral cannabinoid receptor (CB2): identification of cannabinoid receptor subtype selective ligands. J Pharmacol Exp Ther. 1996;278:989–999. [PubMed] [Google Scholar]
- Staton PC, Hatcher JP, Walker DJ, Morrison AD, Shapland EM, Hughes JP, et al. The putative cannabinoid receptor GPR55 plays a role in mechanical hyperalgesia associated with inflammatory and neuropathic pain. Pain. 2008;139:225–236. doi: 10.1016/j.pain.2008.04.006. [DOI] [PubMed] [Google Scholar]
- Stefos GC, Soppa U, Dierssen M, Becker W. NGF upregulates the plasminogen activation inhibitor-1 in neurons via the calcineurin/NFAT pathway and the down syndrome-related proteins DYRK1A and RCAN1 attenuate this effect. PLoS ONE. 2013;8:e67470. doi: 10.1371/journal.pone.0067470. [DOI] [PMC free article] [PubMed] [Google Scholar]
- Sugiura T, Kodaka T, Nakane S, Miyashita T, Kondo S, Suhara Y, et al. Evidence that the cannabinoid CB1 receptor is a 2-arachidonoylglycerol receptor. Structure-activity relationship of 2-arachidonoylglycerol, ether-linked analogues, and related compounds. J Biol Chem. 1999;274:2794–2801. doi: 10.1074/jbc.274.5.2794. [DOI] [PubMed] [Google Scholar]
- Tadagaki K, Jockers R, Kamal M. History and biological significance of GPCR heteromerization in the neuroendocrine system. Neuroendocrinology. 2012;95:223–231. doi: 10.1159/000330000. [DOI] [PubMed] [Google Scholar]
- Thomas BF, Gilliam AF, Burch DF, Roche MJ, Seltzman HH. Comparative receptor binding analyses of cannabinoid agonists and antagonists. J Pharmacol Exp Ther. 1998;285:285–292. [PubMed] [Google Scholar]
- Vickers ER, Kasza A, Kurnaz IA, Seifert A, Zeef LA, O'Donnell A, et al. Ternary complex factor-serum response factor complex-regulated gene activity is required for cellular proliferation and inhibition of apoptotic cell death. Mol Cell Biol. 2004;24:10340–10351. doi: 10.1128/MCB.24.23.10340-10351.2004. [DOI] [PMC free article] [PubMed] [Google Scholar]
- Wager-Miller J, Westenbroek R, Mackie K. Dimerization of G protein-coupled receptors: CB1 cannabinoid receptors as an example. Chem Phys Lipids. 2002;121:83–89. doi: 10.1016/s0009-3084(02)00151-2. [DOI] [PubMed] [Google Scholar]
- Waldeck-Weiermair M, Zoratti C, Osibow K, Balenga N, Goessnitzer E, Waldhoer M, et al. Integrin clustering enables anandamide-induced Ca2+ signaling in endothelial cells via GPR55 by protection against CB1-receptor-triggered repression. J Cell Sci. 2008;121(Pt 10):1704–1717. doi: 10.1242/jcs.020958. [DOI] [PMC free article] [PubMed] [Google Scholar]
- Waldhoer M, Fong J, Jones RM, Lunzer MM, Sharma SK, Kostenis E, et al. A heterodimer-selective agonist shows in vivo relevance of G protein-coupled receptor dimers. Proc Natl Acad Sci U S A. 2005;102:9050–9055. doi: 10.1073/pnas.0501112102. [DOI] [PMC free article] [PubMed] [Google Scholar]
- Yang SH, Shore P, Willingham N, Lakey JH, Sharrocks AD. The mechanism of phosphorylation-inducible activation of the ETS-domain transcription factor Elk-1. EMBO J. 1999;18:5666–5674. doi: 10.1093/emboj/18.20.5666. [DOI] [PMC free article] [PubMed] [Google Scholar]
- Yao BB, Hsieh GC, Frost JM, Fan Y, Garrison TR, Daza AV, et al. In vitro and in vivo characterization of A-796260: a selective cannabinoid CB2 receptor agonist exhibiting analgesic activity in rodent pain models. Br J Pharmacol. 2008;153:390–401. doi: 10.1038/sj.bjp.0707568. [DOI] [PMC free article] [PubMed] [Google Scholar]
- Yao BB, Hsieh G, Daza AV, Fan Y, Grayson GK, Garrison TR, et al. Characterization of a cannabinoid CB2 receptor-selective agonist, A-836339 [2,2,3,3-tetramethyl-cyclopropanecarboxylic acid [3-(2-methoxy-ethyl)-4,5-dimethyl-3H-thiazol-(2Z)-ylidene]-amide], using in vitro pharmacological assays, in vivo pain models, and pharmacological magnetic resonance imaging. J Pharmacol Exp Ther. 2009;328:141–151. doi: 10.1124/jpet.108.145011. [DOI] [PubMed] [Google Scholar]
- Zaslavsky A, Chou ST, Schadler K, Lieberman A, Pimkin M, Kim YJ, et al. The calcineurin-NFAT pathway negatively regulates megakaryopoiesis. Blood. 2013;121:3205–3215. doi: 10.1182/blood-2012-04-421172. [DOI] [PMC free article] [PubMed] [Google Scholar]
Associated Data
This section collects any data citations, data availability statements, or supplementary materials included in this article.
Supplementary Materials
HEK293 cells transiently transfected with GPR55-Rluc were seeded on six-well plates and 24 h post serum starvation cells were stimulated with 1 μM LPI for 10 min. Total ERK1/2 and phosphorylated ERK1/2 in cell lysates were analysed by Western blotting. Data are normalized to the basal ratio of pERK1/2 to ERK1/2 and are mean ± SEM from three independent experiments. Data were tested for significant differences by Students& t-test, **P < 0.01.
Figure S2 All stable cell lines seeded in 96-well plates were transfected with pNFAT-Luc. Twenty four hours post-transfection, cells were stimulated with increasing concentrations of AM 251 in serum-free media for 6 h. Luciferase activity was measured as in Figure 3. Data are mean ± SEM of a representative experiment out of three independent experiments performed in duplicate. Statistical analysis was performed by two-way anova followed by Bonferroni&s post hoc multiple comparison test. ***P < 0.001.
Figure S3 HEK-CB2 receptor cells seeded in a 96-well plate were transfected with pCRE-Luc. Twenty-four hours post transfection, cells were pre-incubated with 1 mM IBMX for 10 min in serum-free media. Cells were then treated with 1 or 10 μM CP 55,904 for 30 min followed by stimulation with 5 μM forskolin for 10 min. Luciferase activity was measured as in Figure 3. Data are mean ± SEM of a representative experiment out of three independent experiments performed in quadruplicate.
Figure S4 (A) HEK293 or (B) HEK-CB2 receptor cells were stimulated with increasing concentrations of LPI or 100 μM ATP and the resulting picometer shifts of reflected light wavelength against time (s) were monitored in DMR assay as in Figure 7. (C) Real-time impedance recordings for HEK293 treated with A-836339 (5 μM), LPI (5 μM) or LPA (5 μM).
Figure S5 Quantitative comparison of CB2 receptor-GPR55 cross-talk using label-free whole-cell DMR recordings. (A) Concentration-effect relationship for LPI stimulating GPR55 in the absence and presence of CB2 receptor. Curves were computed by utilizing the AUC between 0 and 3600 s. Curves are presented as dashed lines and were taken from Figure 7C to facilitate comparison with panel B. (B) Concentration–effect relationships as shown in A but derived from the slope of tangents to the origins of each real-time recording. (C and D) Representative real-time recordings including the tangents for calculation of slope values to compute concentration–effect curves. Data in A and B show mean values ± SEM of at least three independent experiments; data in C and D are mean values ± SEM of one representative dataset. Statistical analysis was performed for LPI-mediated responses in HEK-GPR55 versus HEK-CB2R/GPR55 cells by two-way anova followed by Bonferroni&s post hoc multiple comparison test. **P < 0.01; ***P < 0.001.
Figure S6 cAMP determination in HEK-GPR55 cells. LPI did not induce cAMP accumulation in HEK293 stably expressing GPR55 receptor; forskolin was used as positive control. cAMP levels were determined using the HTRF® cAMP assay kit as indicated in Methods. Data are the mean ± SEM from at least three independent experiments. ***P < 0.001.