

Abstract
Background and Purpose
PGE2 is a major prostanoid that regulates inflammation by stimulating EP1–4 receptors. However, how PGE2 induces an initial inflammatory response to vascular hyper-permeability remains unknown. Here we investigated the role of the PGE2-EP receptor signal in modulating vascular permeability both in vivo and in vitro.
Experimental Approach
We used a modified Miles assay and intravital microscopy to examine vascular permeability in vivo. Endothelial barrier property was assessed by measuring transendothelial electrical resistance (TER) in vitro.
Key Results
Local administration of PGE2, an EP2 or EP4 receptor agonist into FVB/NJcl mouse ear skin caused vascular leakage, indicated by dye extravasation. Intravital microscopy and laser Doppler blood-flow imaging revealed that these treatments dilated peripheral vessels and increased local blood flow. Pretreatment with the vasoconstrictor phenylephrine inhibited the PGE2-induced blood flow increase and vascular leakage. In contrast to the EP2 and EP4 receptor agonists, administration of an EP3 receptor agonist suppressed vascular leakage without altering vascular diameter or blood flow. In isolated HUVECs, the EP3 receptor agonist elevated TER and blocked thrombin-induced dextran passage. Inhibiting PKA restored the hypo-permeability induced by the EP3 receptor agonist.
Conclusions and Implications
Activation of the PGE2-EP2 or -EP4 receptor signal induces vasodilatation in mural cells, resulting in increased local blood flow and hyper-permeability. In contrast, activation of the PGE2-EP3 receptor signal induces a cAMP-dependent enhancement of the endothelial barrier, leading to hypo-permeability. We provide the first evidence that endothelial cells and mural cells cooperate to modulate vascular permeability.
Table of Links
| TARGETS | LIGANDS |
| EP1receptor | PGE2 |
| EP2receptor | ONO-AE-248 |
| EP3receptor | L798106 |
| EP4receptor | PF04418948 |
| AH23848 | |
| Thrombin | |
| VEGF | |
| Phenylephrine | |
| Isoprenaline |
This Table lists key protein targets and ligands in this document, which are hyperlinked to corresponding entries in http://www.guidetopharmacology.org, the common portal for data from the IUPHAR/BPS Guide to PHARMACOLOGY (Pawson et al., 2014) and are permanently archived in the Concise Guide to PHARMACOLOGY 2013/14 (Alexander et al., 2013).
Introduction
Blood vessels run all over the human body and maintain the homeostasis of all tissues by supplying nutrients and oxygen (Mehta and Malik, 2006). The vasculature is composed of mainly two types of cells: vascular endothelial cells and vascular mural cells. Endothelial cells cover the inner surface of the vasculature, and mural cells such as vascular smooth muscle cells and pericytes cover the outside of the endothelial monolayer. The composition of mural cells varies depending on the type of blood vessel. Some blood vessels, including the aorta, large veins, arteries, veins and arterioles, are covered by at least one layer of vascular smooth muscle cells. Peripheral vessels such as venules are covered by pericytes. Capillaries do not have any mural cells, being composed solely of endothelial cells (Armulik et al., 2011).
Vascular mural cells contract or relax to regulate local BP and blood flow. Endothelial cells are well known for secreting bioactive agents such as NO and endothelin-1 that modulate contraction of mural cells and leukocyte adhesion (Hirase and Node, 2011). Thus, these two types of cells work together to effect a variety of vascular functions.
Modulation of permeability is also an important function of the vasculature. Injurious stimuli such as physical damage and infection stimulate tissue-resident cells to secrete inflammatory cytokines. Secreted cytokines make the vasculature hyper-permeable and then leukocyte and plasma components leak into the interstitium. These responses are essential for removing these injurious stimuli and to initiate the healing process (Ley et al., 2007). However, excessive and/or persistent vascular hyper-permeability causes tissue oedema and leads to further disease progression. As persistent vascular hyper-permeability is a predominant symptom of acute lung injury (Ware and Matthay, 2000) and peritonitis (Zhou et al., 2012), investigators have been exploring new agents for restricting vascular permeability for therapeutic applications. Recent studies have suggested that blood vessels are continuously and excessively hyper-permeable in solid tumours (Weis, 2008) and rheumatoid arthritis (Szekanecz and Koch, 2008), and that vascular hyper-permeability is an exacerbating factor of these diseases. Thus, vascular permeability has emerged as a therapeutic target for various types of diseases involving chronic inflammation as well as acute inflammation.
There seem to be two major factors that determine tissue vascular permeability: the endothelial barrier and blood flow. The endothelial barrier is formed by cell-to-cell adherens junctions consisting of VE-cadherin, catenins and the cytoskeleton (Dejana et al., 2008). Thrombin is known to disrupt adherens junctions and decreases endothelial barrier function via activation of calcium/RhoA-signal (Wang et al., 2010). VEGF promotes endothelial cell permeability by producing NO (Thibeault et al., 2010). In contrast to these barrier disrupting factors, Lee et al. discovered that sphingosine-1-phosphate (S1P) enhanced the endothelial barrier (Lee et al., 1999). A subsequent study revealed that S1P-induced barrier enhancement was due to Gi/PI3K/Akt-signal activation (Morales-Ruiz et al., 2001). We have also previously reported that PGD2 tightens adherens junctions and enhances the endothelial barrier property through a cAMP/PKA-dependent signal pathway (Murata et al., 2008; Kobayashi et al., 2013).
Mural cells are also implicated in the modulation of vascular permeability. Previous studies have inferred that vascular contraction diminishes downstream blood flow and then limits vascular leakage. For example, clinical research has shown that administering phenylephrine, a vasoconstrictor, ameliorated rhinorrhoea in cases of human allergic rhinitis (Nathan, 2008). In contrast, administration of bradykinin, a vasodilator evoked dye extravasation by increasing local blood flow in hamster cheek pouch vessels (Feletou et al., 1996; Curry and Adamson, 2010). Although these results implicate the role of mural cells on vascular permeability, there are few studies that clearly show its functional contribution.
PGE2 is one major prostanoid that is abundantly produced upon inflammation. The biological effects of PGE2 are mediated through four types of prostanoid receptor, EP1–4. Secreted PGE2 induces a variety of inflammatory responses such as cytokine/chemokine production and leukocyte infiltration through an EP receptor-mediated signal (Funk, 2001). Using human pulmonary artery endothelial cells, Birukova et al. showed that PGE2-EP2/4 receptor signalling enhanced the endothelial barrier by stimulating the cAMP/PKA signal (Birukova et al., 2007). However, how PGE2 induces an initial inflammatory response to vascular hyper-permeability, especially in vivo, remains unknown. On the basis of these previous findings, in this study we attempted to elucidate how the PGE2-EP receptor signal regulates vascular permeability in vivo, focusing on the functional contribution of both vascular mural cells and endothelial cells. We demonstrated that PGE2, an EP2 receptor agonist and an EP4 receptor agonist induced vasodilatation, resulting in increased local blood flow and vascular hyper-permeability. In contrast, EP3 agonism enhanced endothelial barrier, resulting in hypo-permeability.
Methods
Modified miles assay
All animal experiments were approved by the institutional animal care and use committees of the University of Tokyo and are reported in accordance with the ARRIVE guidelines for reporting experiments involving animals (Kilkenny et al., 2010; McGrath et al., 2010). General anaesthesia was induced with 4% isoflurane via a nose cone and continued with 2% isoflurane during procedures. Pedal withdrawal reflex test is performed to assess the depth of anaesthesia. A total of 144 animals were used. Six to eight-week-old FVB/NJcl mice (18–22 g), purchased from Clea Japan, Inc. (Tokyo, Japan), were anaesthetized and their body temperatures were maintained at 37°C. Each EP receptor agonist, PGE2 or VEGF was injected into the ears of the mice as previously described (Murata et al., 2008; Kobayashi et al., 2013). Fifteen minutes later, 50 mg kg−1 Evans Blue dye was injected into the tail vein. Mice were killed by cervical dislocation 30 min after the Evans blue injection. The ears were excised and dried in a constant-temperature oven. Evans Blue that had extravasated in the ear was extracted in formamide, and the content was quantified spectrophotometrically at 610 nm.
Tissue or cell staining
For ear staining, mice were killed by cervical dislocation and immediately perfusion-fixed with 4% paraformaldehyde. Mouse ears were then dissected and skinned. Samples were permeabilized with 0.15% Triton X-100, and incubated with blocking buffer containing 5% BSA for 30 min. For cell staining, HUVECs were seeded onto coverslips. Cells were fixed, permeabilized and incubated with blocking buffer as mentioned earlier. Samples were then incubated for 3 h at room temperature or overnight at 4°C with the following primary antibodies: rabbit anti-desmin (1:200, Abcam, Cambridge, UK), rat anti-mouse CD31 (1:200, Biocare Medical, Inc., Concord, CA, USA), or goat anti-VE-cadherin (1:100, Santa Cruz Biotechnology, Inc., Santa Cruz, CA, USA). After being washed twice, samples were incubated with Alexa Fluor 594 anti-rabbit antibody (1:500), Alexa Fluor 488 anti-rat antibody (1:500), anti-actin, α-smooth muscle-Cy3 clone 1A4 (1:500, Sigma-Aldrich, St. Louis, MO, USA), Alexa Fluor 488 anti-goat antibody (1:200), or rhodamine-phalloidin (3:100, Life Technologies, Rockville, MD, USA,) for 2 h at room temperature. Thereafter, nuclei were labelled with DAPI (1 μg mL−1) for 30 min. The images were captured with an Eclipse E800 fluorescence microscope (Nikon, Tokyo, Japan).
Intravital microscopy of microvessels
EP receptor agonists or PGE2 were injected i.d. into the ear of anaesthetized FVB/NJcl mice. Five minutes later, 70 kDa FITC-dextran (2 mg mL−1, 100 μL, Sigma-Aldrich) was injected i.v. Mice were then positioned on the stage of a confocal microscope (ECLIPSE Ti with C1 confocal system, Nikon) and their body temperatures were maintained at 37°C. Pictures were taken every minute. For vascular diameter measurement, both proximal vessels (second branching point of vessels, Figure 2A) and distal vessels (fourth branching point of vessels, Figure 2A) were monitored. The change in vascular diameter was measured 10 min after stimulation and presented as the average percentage change of three randomly selected areas.
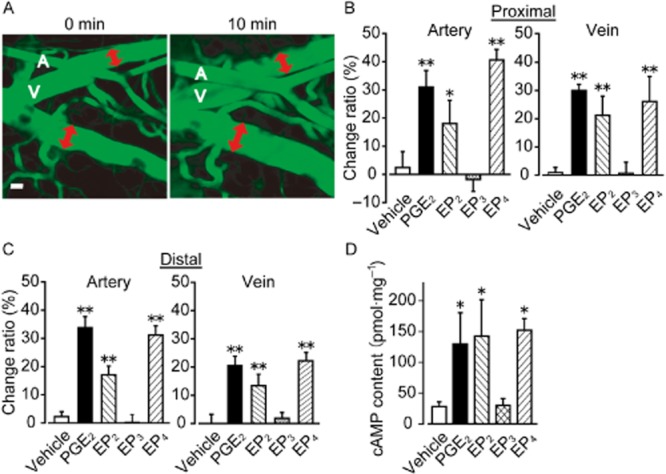
Figure 2.

PGE2, EP2 and EP4 receptor agonists increase local blood flow in vivo. (A) Illustration of mouse left ear vessel. (B) Typical pictures of whole mount immunostaining of PECAM (left panels, green), αSMA (upper middle panel, red), and desmin (lower middle panel, red). Right panels show merged pictures of PECAM, αSMA or desmin, and DAPI (blue) staining. Scale bar, 100 μm. (C) Typical pictures of changes in local blood flow. Treatment with vehicle (upper panel, left ear), PGE2 (upper panel, right ear), and EP2-4 receptor agonists (lower panels). (D) Effect of PGE2 or EP2-4 receptor agonists on blood flow change (n = 5). * P < 0.05, ** P < 0.01 significantly different from the results of the vehicle treatment. Data are presented as means ± SEM.
Blood flow measurement
After the mice had been anaesthetized, either vehicle, an EP receptor agonist or PGE2 was administered i.d. Changes in mouse ear blood flow were monitored for 1 h with an Omegazone laser Doppler blood-flow imaging system (Omegawave, Inc., Tokyo, Japan). Increases in blood flow were quantified 10 min after stimulation and expressed as the difference in intensity between the right and left ear.
Measurement of cAMP content
After the mice had been killed by an overdose (i.p. injection) of sodium pentobarbital, the aortas were isolated and the endothelial layer was removed by gently rubbing the intimal surface with forceps. In the preliminary experiments, we confirmed that this procedure removed endothelial cells by observing the disappearance of endothelial cell-dependent relaxation in a myograph system, as previously described (Kobayashi et al., 2011). The aortic sections were pretreated with IBMX (200 μM, 15 min). After treatment with PGE2 or each EP receptor agonist, the aortic sections were immediately frozen in liquid nitrogen, homogenized in 6% trichloroacetic acid solution, and centrifuged at 2000× g for 15 min at 4°C. The cAMP content of the supernatants was analysed with a cAMP complete EIA kit (Enzo Life Sciences, Inc., Farmingdale, NY, USA), according to the manufacturer's instructions. The results were normalized to the total protein content. To measure endothelial intracellular cAMP concentration in vitro, HUVECs were pretreated with IBMX for 3 min before stimulation. Intracellular cAMP level was measured as shown earlier.
Cell culture procedure and gene depletion
HUVECs were cultured in an endothelial growth medium-2 Bulletkit medium (Lonza, Visp, Switzerland) containing FBS at 37°C in a humidified atmosphere including 5% CO2. The confluent cells (passages 3–9) were used 4 h after being deprived of serum, in endothelial basal medium-2 supplemented with 2% FBS. To deplete the endogenously expressed EP3 receptors, HUVECs were transfected with 30 nM siGENOME SMARTpool siRNA (Thermo Scientific, Tokyo, Japan) targeting the human gene PTGER3, with Lipofectamine RNAiMAX (2% v v−1). The cells were used 48 h after the transfection.
Transendothelial electrical resistance (TER) measurement
TER was measured using an xCELLigence Real-Time Cell Analyzer DP system (Roche, Basel, Switzerland). This system monitors changes in TER over time across an interdigitated micro-electrode integrated onto the bottom of tissue culture E-plates. Each well was seeded with 8000 cells and incubated for 24 h before being deprived of serum. HUVECs were stimulated with each reagent while TER was measured every 30 s. The TER was normalized to the value at 1 h before stimulation with each EP receptor agonist or PGE2.
Transwell permeability assay
HUVECs (75 000 cells per well) were seeded onto gelatin-coated 1.0 μm pore size transwell inserts and grown to confluence. After being deprived of nutrients, cells were stimulated with an EP3 receptor agonist (ONO-AE-248), thrombin, or an EP3 antagonist (L798106). FITC-dextran (20 μg mL−1) was added to the transwell inserts. Forty minutes after FITC-dextran addition, media were collected from the bottom chambers and the fluorescence intensity was measured. The intensities measured 10 min after FITC-dextran addition in untreated HUVECs, and 40 min after FITC-dextran addition in thrombin-treated HUVECs, were taken as 0 and 100% respectively.
Statistical analysis
Data are shown as means ± SEM. Statistical evaluation of the data was performed by one-way or two-way anova followed by Tukey's test. Student's t-test was used when samples were composed of two groups. A value of P < 0.05 was taken to be significant.
Chemicals
The chemicals used were as follows: PGE2 (Cayman Chemical Company, Ann Arbor, MI, USA); IBMX, (R)-(–)-phenylephrine hydrochloride, L798106; PKAi, thrombin and AH23848 (Millipore, Billerica, MA, USA); PF 04418948 (Tocris Bioscience, Ellisville, MO, USA); VEGF-A165 (Wako, Tokyo, Japan); ONO-DI-004, ONO-AE1-259-01, ONO-AE-248; and ONO-AE1-329 were kindly donated by the Ono Pharmaceutical Company (Osaka, Japan).
Results
Effect of PGE2 signal on vascular permeability in vivo
mRNA expressions of all EP receptors were detected in mouse ear tissue (Supporting Information Figure S1). We first investigated the effect of PGE2-EP receptor signal on vascular permeability in vivo by quantifying dye extravasation of mouse ear skin. Local administration of 20 ng PGE2 (i.d., 15 min before Evans Blue injection) did not influence vascular permeability (Figure 1B). Treatment with 200 ng PGE2 extravasated the dye into the interstitium, and its leakage was observed in almost all parts of the ear (Figure 1A and B). An EP2 receptor agonist (ONO-AE1-259-01, 200 ng, 15 min) and an EP4 receptor agonist (ONO-AE1-329, 200 ng, 15 min) increased vascular leakage soon after administration (Figure 1A and B). The amounts of extravasated dye were less than that of PGE2, and there was no significant difference between EP2 and EP4 receptor-mediated dye extravasation. In contrast, neither administration of an EP1 receptor agonist (ONO-DI-004, 200 ng, 15 min) nor an EP3 receptor agonist (ONO-AE-248, 200 ng, 15 min) induced vascular leakage (Figure 1A and B).
Figure 1.
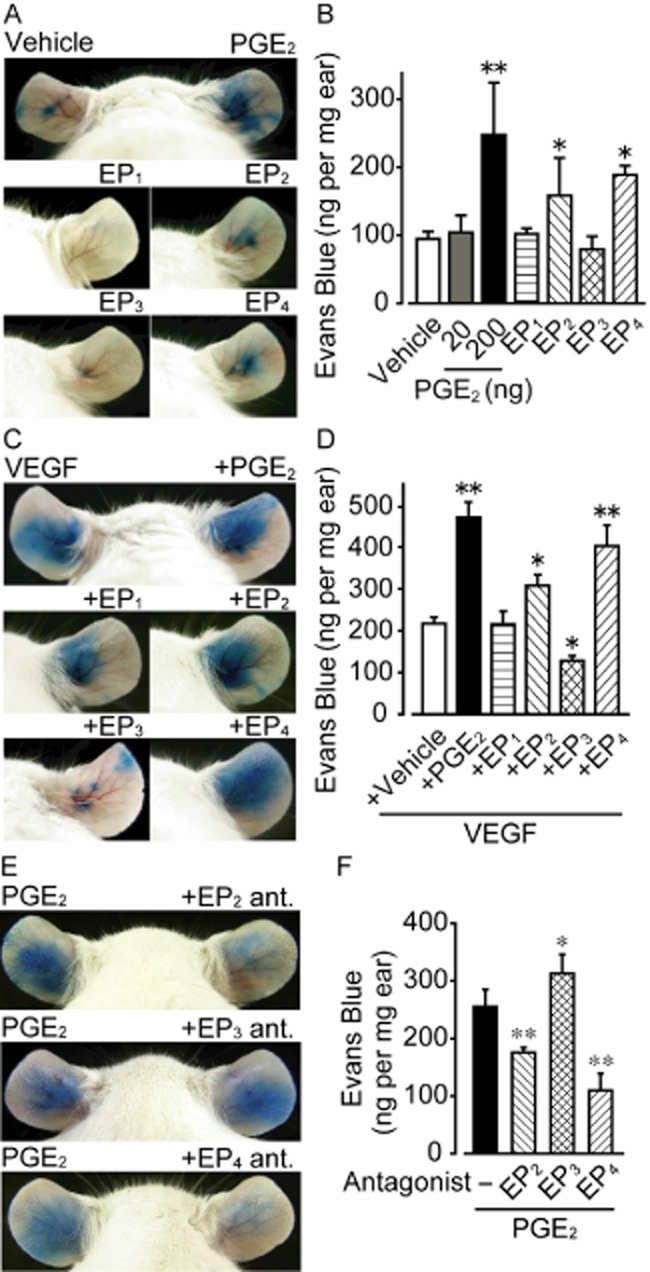
Effect of PGE2 or EP receptor agonists on vascular permeability in vivo. (A) Representative pictures of Evans Blue extravasation. Treatment with vehicle (left ear), PGE2 (right ear), EP1 receptor agonist (ONO-DI-004), EP2 receptor agonist (ONO-AE1-259-01), EP3 receptor agonist (ONO-AE-248) or EP4 receptor agonist (ONO-AE1-329). (B) Effect of PGE2 and EP receptor agonists on Evans Blue dye extravasation (n = 6). (C) Representative pictures of VEGF-induced Evans Blue extravasation. Treatment with VEGF (upper panel, left ear), VEGF and PGE2 (upper panel, right ear), or VEGF and each EP receptor agonist (middle and lower panels). (D) Effect of PGE2 and EP receptor agonists on VEGF-induced Evans Blue dye extravasation (n = 6). (E) Representative pictures of PGE2-induced Evans Blue extravasation. Treatment with PGE2 (left ear), PGE2 and EP2 receptor antagonist (PF 04418948, right ear), PGE2 and EP3 receptor antagonist (L798106, right ear), or PGE2 and EP4 receptor antagonist (AH23848, right ear). (F) Effect of EP2-4 receptor antagonists on PGE2-induced Evans Blue extravasation (4 ≤ n ≤ 12). * P < 0.05, ** P < 0.01significantly different from the results in vehicle treatment. Data are presented as means ± SEM.
VEGF is known to directly stimulate endothelial cells and disrupt the barrier (Bates, 2010). As shown in Figure 1C and D, administration of VEGF (30 ng, 15 min, i.d.) extravasated blue dye in all parts of the mouse ears. Concurrent administration of PGE2, an EP2 receptor agonist or an EP4 receptor agonist further increased the VEGF-induced dye extravasation; however, administering an EP1 receptor agonist did not (Figure 1C and D). In particular, PGE2 and the EP4 receptor agonist strongly accelerated it. In sharp contrast to the other EP receptor agonists, concurrent administration of an EP3 receptor agonist significantly suppressed VEGF-induced vascular leakage (Figure 1C and D). Consistently, the EP2 receptor antagonist, PF 04418948, significantly inhibited and the EP4 receptor antagonist, AH23848, almost abolished the PGE2-induced vascular leakage (Figure 1E and F, both 200 ng, i.d., 30 min before PGE2 administration). The EP3 receptor antagonist, L798106 (200 ng, i.d., 30 min) further increased the dye extravasation (Figure 1E and F). These results indicate that PGE2-EP2/4 receptor signalling mediates vascular hyper-permeability while the PGE2-EP3 receptor axis mediates hypo-permeability in vivo.
Effect of PGE2 signal on local blood flow
Immunofluorescent staining revealed that in a relatively proximal vessel (shown in Figure 2A), platelet endothelial cell adhesion molecule (PECAM)–1-positive endothelium is mainly surrounded by α-smooth muscle actin-positive smooth muscle layers (Figure 2B). These vessels were also covered by pericytes labelled by anti-desmin antibody (Supporting Information Figure S2). In relatively distal vessels, endothelium was covered by pericytes (Figure 2B), but not by smooth muscle cells (Supporting Information Figure S2).
There are two main factors that can affect vascular permeability in vivo: local blood flow and endothelial barrier function. We examined whether the PGE2-EP receptor signal affects blood flow by using laser Doppler blood-flow imaging. I.d. administration of PGE2 immediately increased blood flow in the ear (Figure 2C and D). This increase lasted for about 1 h. Administration of an EP2 receptor agonist or an EP4 receptor agonist, but not an EP3 receptor agonist, increased the blood flow (Figure 2C and D). Similar to the results of the dye extravasation (Figure 1), increases in blood flow induced by EP4 receptor agonist were greater than those induced by the other EP receptor agonists.
Close examination of the PGE2-induced vascular hyper-permeability
The time-dependent changes in vascular permeability and its morphology were examined by intravital microscopy.
Consistent with the results shown in Figure 1, i.d. administration of PGE2 into mouse ears strongly induced FITC-dextran leakage (Supporting Information Figure S3A: representative pictures, Supporting Information Figure S3B and C: summary). Dextran leakage was first seen in distal vessels after 10 min, and spread to proximal vessels within 30 min. Administration of an EP2 or EP4 receptor agonist, but not an EP3 receptor agonist, also caused vascular leakage (Supporting Information Figure S3B and C).
As shown in Supporting Information Figure S4A–D, a commonly used inflammatory stimulant, croton oil (5% in acetone) induced FITC-dextran leakage from both distal vessels and proximal vessels. Pretreatment with an EP3 receptor agonist (for 5 min) significantly suppressed the croton oil-induced vascular leakage (Supporting Information Figure S4A–D).
Effect of PGE2 signal on mouse ear vascular contractility
Local blood flow change is dependent to a large extent on vessel contraction or dilation. I.d. injection of PGE2 strongly increased vascular diameter both in proximal (Figure 3A: representative pictures; Figure 3B: summary) and distal vessels (Figure 3C) in the mouse ear. This vasodilatation was observed soon after the stimulation and lasted for at least 30 min. The extent of PGE2-induced vasodilatation in distal veins was less than that of the other vessels. Treatment of capillaries with PGE2 did not change their diameters (data not shown). Local blood flow may be affected by change in BP. However, i.d. administration of PGE2 did not affect systemic BP (78.2 ± 4.9 mmHg) compared with vehicle-treated mice (76.9 ± 3.0 mmHg) (n = 3 each). Treatment with an EP2 or EP4 receptor agonist, but not an EP3 receptor agonist, increased vascular diameter in both proximal and distal vessels (Figure 3B and C). EP4 receptor stimulation induced greater vasodilatation than that of EP2 receptor.
Figure 3.
PGE2, EP2 and EP4 receptor agonist increase vascular diameter in vivo. (A) Representative pictures of PGE2-induced vascular diameter increase. Vascular diameter was measured as indicated by the red double-headed arrows. A, indicates artery and V indicates vein. Scale bar, 50 μm. (B) Effect of PGE2 and EP2-4 receptor agonists on vascular diameter of proximal vessels (n = 4). (C) Effect of PGE2 and EP2-4 receptor agonists on vascular diameter of distal vessels (n = 4). (D) Content of cAMP in sections of endothelium-denuded mouse aorta. The sections were treated with PGE2 or EP2-4 receptor agonists (n = 4). *P < 0.05, **P < 0.01 significantly different from the results of the vehicle treatment. Data are presented as means ± SEM.
PGE2-EP2 receptor and -EP4 receptor signals are known to induce cAMP-mediated vasodilatation in vascular smooth muscle (Armstead, 1995). As shown in Figure 3D, PGE2, an EP2 or EP4 receptor agonist (10 μM each, 15 min) increased cAMP content in vascular smooth muscle in endothelium-denuded mouse aortas.
The vasoconstrictor phenylephrine (1 μg, 30 min before PGE2, i.d.) significantly suppressed the PGE2-induced all vascular leak, blood flow increase, and vasodilatation in proximal/distal vessels (Figure 4A-D). Treatment with the vasodilator isoprenaline (1 μg, 15 min, i.d.) increased dye extravasation, local blood flow and vascular diameter (Supporting Information Figure S5A–C). These results suggest that the PGE2-induced vasodilatation is linked to vascular leakage in vivo.
Figure 4.
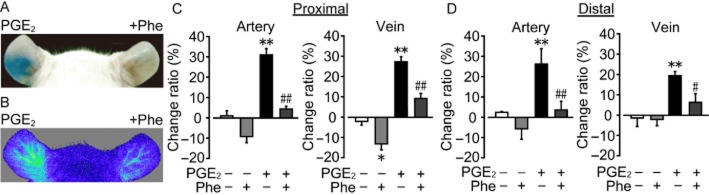
Phenylephrine suppresses PGE2-induced vasodilatation and hyper-permeability. (A) Representative pictures of Evans Blue dye extravasation. Treatment with PGE2 with (right ear) or without (left ear) phenylephrine (Phe) pretreatment. (B) Representative pictures of changes in local blood flow. (C) Effect of Phe on PGE2-induced vasodilatation in proximal vessels (n = 4). (D) Effect of Phe on PGE2-induced vasodilatation in distal vessels (n = 4). *P < 0.05, **P < 0.01 significantly different from the results of the vehicle treatment. #P < 0.05, ##P < 0.01 significantly different from the results of PGE2 stimulation with vehicle pretreatment (C, D). Data are presented as means ± SEM.
Effect of PGE2 signal on endothelial barrier function
We measured TER to evaluate the barrier property of HUVECs. PGE2 (1–100 nM) dose-dependently increased TER to a peak at about 10 min after the stimulation, indicating endothelial barrier enhancement (Figure 5A, the maximum increase is summarized in Figure 5B). The PGE2-induced TER response was not influenced by the other prostanoid receptor antagonists (Supporting Information Figure S6A). The EP2 receptor agonist (1–10 μM), EP3 receptor agonist (1–10 μM) and EP4 receptor agonist (10–100 nM) also increased TER (Figure 5B), and these responses were abolished by their own receptor antagonists (Supporting Information Figure S6B and Figure 6A and B). The treatments that caused an increase in TER are, in descending order, PGE2, an EP4 receptor agonist, an EP3 receptor agonist, and an EP2 receptor agonist. An EP1 receptor agonist (1–10 μM) did not affect TER. These results indicate that PGE2 or EP2-4 receptor stimulation enhanced the endothelial barrier property. Similar observations were obtained in human dermal micro-vascular endothelial cells (HMVECs-d, Supporting Information Figure S7). PGE2 (1–100 nM), EP4 (10–100 nM) or EP3 receptor agonist (1–10 μM) increased TER in a concentration-dependent manner. Of interest, the EP2 receptor agonist (1–10 μM) did not affect TER of HMVECs-d.
Figure 5.
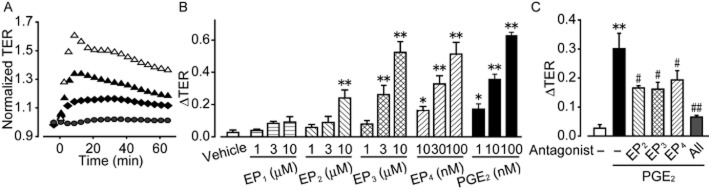
Effect of PGE2 and EP receptor agonists on endothelial barrier function in vitro. (A) Effect of PGE2 on TER. (B) Maximum TER increase induced by PGE2 or EP receptor agonist (6 ≤ n ≤ 12). (C) Maximum TER increase induced by PGE2 under EP blockade (n = 6). *P < 0.05, **P < 0.01 significantly different from the results of the vehicle treatment. #P < 0.05, ##P < 0.01 significantly different from the results in PGE2 treatment. Data are presented as means ± SEM.
Figure 6.
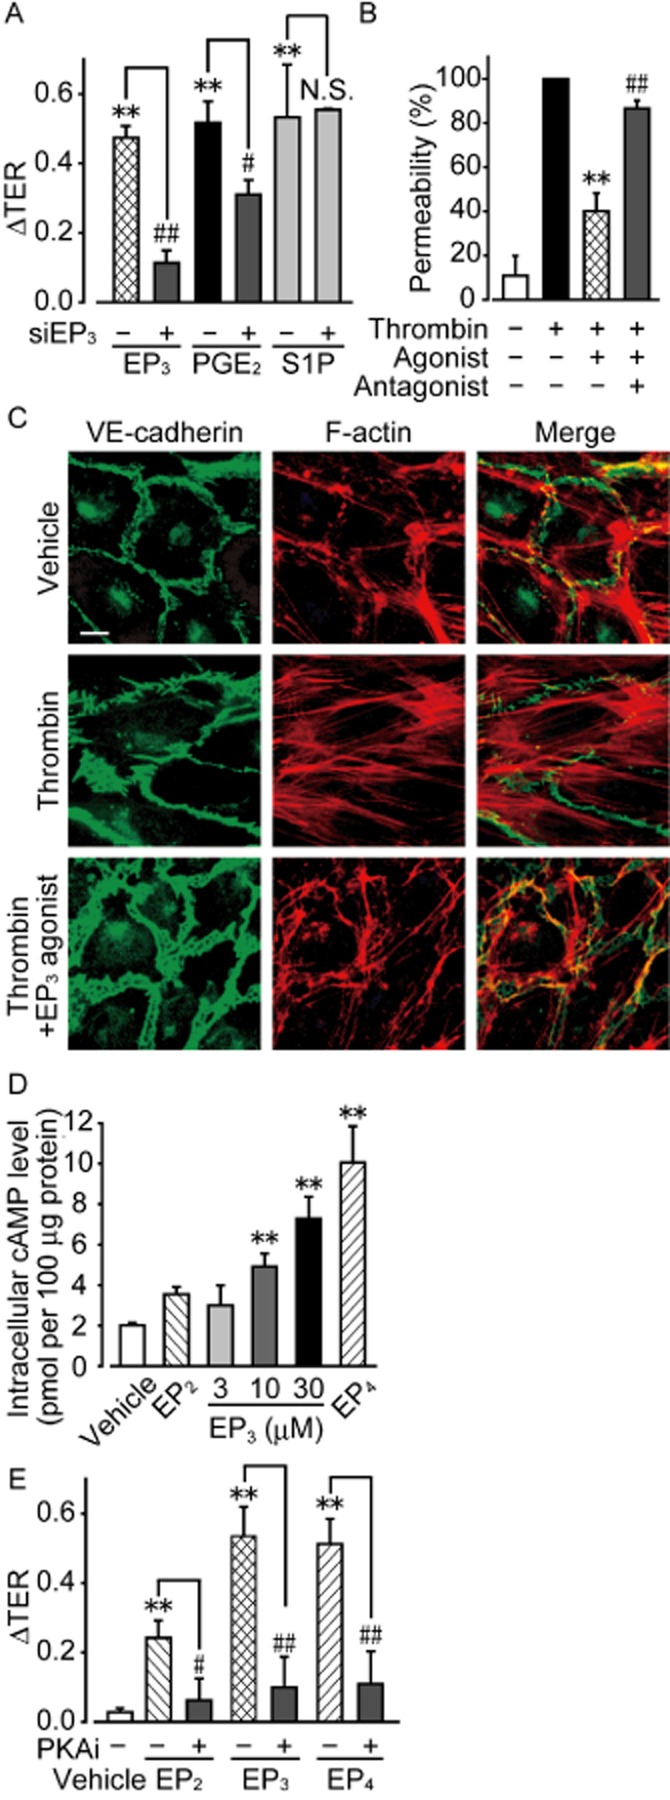
EP3 receptor agonism enhances the endothelial barrier in vitro. (A) HUVECs were transfected with either control or EP3 receptor siRNA. The maximum increase in TER induced by EP3 receptor agonist, PGE2, or sphingosine-1-phosphate (S1P) was quantified (6 ≤ n ≤ 9). (B) FITC-dextran permeability assay (5 ≤ n ≤ 6). (C) Typical pictures of immunostaining of VE-cadherin (left panels, green) and F-actin (middle panels, red) after thrombin stimulation with and without EP3 receptor agonist. Right panels show merged pictures of VE-cadherin, F-actin, and DAPI (blue) staining. Scale bar is 10 μm. (D) Measurement of intracellular cAMP level in HUVECs after stimulation of EP3 receptors (n = 4). (E) Effects of PKAi on EP3 receptor-induced increases in TER (n = 6). **P < 0.01 significantly different from the results of the vehicle treatment. #P < 0.05, ##P < 0.01 significantly different from the results in HUVECs infected with control siRNA (A) or after stimulation by EP3 receptor agonist without any pretreatment (B, D). Data are presented as means ± SEM.
In addition, pretreatment with EP2 receptor antagonist (100 nM, 1 h), EP3 receptor antagonist (1 μM, 1 h) or EP4 receptor antagonist (1 μM, 1 h) attenuated the PGE2 (3 nM)-induced TER increase to a similar extent in HUVECs (Figure 5C). Pretreatment with all three antagonists (100 nM EP2 receptor antagonist and 1 μM EP3/4 receptor antagonist, 1 h) almost completely inhibited the TER increase. These in vitro observations suggest that PGE2 enhanced the endothelial barrier via EP receptor-mediated signalling. The vasoconstrictor phenylephrine suppressed the PGE2-induced vascular leak in vivo (Figure 4A), but it did not influence the endothelial barrier function in vitro (Supporting Information Figure S8).
Effect of EP3 receptor agonism on endothelial cytoskeletal rearrangement
We next focused on the EP3 receptor-mediated endothelial barrier enhancement. Gene depletion of EP3 receptors by siRNA significantly inhibited TER increase induced by an EP3 receptor agonist (10 μM) or PGE2 (100 nM) (Figure 6A). EP3 receptor knockdown did not affect the TER increase induced by sphingosine-1-phosphate (S1P, 1 μM; Figure 6A).
In the transwell permeability assay, treatment with thrombin (0.1 U mL−1, 5 min) induced endothelial barrier disruption, leading to an increase in the passage of FITC-dextran (Figure 6B). The EP3 receptor agonist (10 μM, 15 min) significantly suppressed the thrombin-induced FITC-dextran passage (Figure 6B). This effect was almost completely inhibited by pretreatment with an EP3 receptor antagonist (10 μM, 1 h) (Figure 6B).
Immunofluorescence showed that HUVECs have a continuous distribution of VE-cadherin and accumulate actin bundles along cell borders when in the resting state (Figure 6C, upper panels). After the treatment with thrombin (0.1 U mL−1, 10 min), HUVECs showed discontinuous VE-cadherin distribution at cell borders, and increased formation of stress fibres running across the cells (Figure 6C, middle panels), which suggests the disruption of adherens junctions. Pretreatment with an EP3 receptor agonist (10 μM, 20 min) decreased these changes and a cortical actin rim was found to have accumulated (Figure 6C, lower panels).
Intracellular signal pathway of EP3 receptor-induced barrier enhancement
All EP receptors bind to GPCRs. While EP2 and EP4 receptors have been identified as Gs-coupled receptors (Bos et al., 2004), the EP3 receptor is further subdivided into several isoforms, that is Gs, Gi and Gq (Breyer et al., 2001; Hatae et al., 2002). We attempted to characterize the EP3 receptor-mediated signalling involved in the endothelial barrier enhancement. Previous studies showed that Gi/PI3K/Akt signal or Gq/Ca2+ signal modulates endothelial barrier function (Morales-Ruiz et al., 2001; Kobayashi et al., 2013). However, as shown in Supporting Information Figure S9A and B, neither Gi inhibition (Pertussis toxin, 100 ng mL−1, 24 h) nor PI3K inhibition (LY294002, 25 μM, 30 min) influence the EP3 receptor-mediated TER increase. Furthermore, Ca2+ measurement showed that the EP3 receptor agonist (10 μM) did not alter the intracellular Ca2+ level, whereas a positive control ATP (10 μM) robustly increased its level (Supporting Information Figure S9C). These results indicate that EP3 receptor agonism does not affect either Gi or Gq in endothelial cells. Stimulation of Gs protein increases the intracellular cAMP level and activates PKA. The EP3 receptor agonist (3–30 μM, 10 min) elevated intracellular cAMP levels in HUVECs in a concentration-dependent manner (Figure 6D). In addition, the increase in TER induced by 10 μM EP3 receptor agonist was abolished by pretreatment with a PKA inhibitor (30 μM, 1 h) (Figure 6E). As previously reported, the TER increase by EP2 (10 μM) or EP4 receptor agonist (100 nM) was also abolished by PKA inhibition (Figure 6D and E). These results suggest that all EP2–4 receptor agonists enhanced the endothelial barrier via the Gs/cAMP/PKA pathway.
Discussion
In this study, we evaluated how the PGE2-EP receptor signal modulates vascular permeability focusing on the functional changes in both vascular component cells: mural cells and endothelial cells.
We showed that activation of the PGE2-EP2/4 receptor signal dilates vasculature and increases blood flow. We and other researchers suggested that this local blood flow increase causes vascular hyper-permeability (Feletou et al., 1996; Nathan, 2008; Curry and Adamson, 2010). Blood flow can affect vascular permeability by exerting two types of haemodynamic force: shear stress and hydrostatic pressure. The pressure that blood flow consistently exerts on the lumen side of the endothelium constitutes shear stress, which increases vascular permeability. Orsenigo et al. showed that vascular connection-induced shear stress caused the phosphorylation of VE-cadherin in jugular vein endothelial cells (Orsenigo et al., 2012), which indicates hyper-permeability (Potter et al., 2005). Conversely, an increase in blood flow also elevates intravascular pressure, constituting hydrostatic pressure. Many researchers have suggested that this pressure is a significant factor in the modulation of vascular permeability (Curry, 2005; Levick and Michel, 2010). However, because of a lack of experiments that directly evaluate this, especially in vivo, there has been no direct evidence showing that hydrostatic pressure influences vascular permeability.
Endothelial barrier function is another important factor in regulating vascular permeability. Our study as well as a previous report (Birukova et al., 2007) showed that the PGE2-EP2/4 receptor signal enhances the endothelial barrier property of isolated endothelial cells. These are contrary to the in vivo observations of hyper-permeability associated with EP2/4 receptor-signal activation. In vivo, the balance between local blood flow and the endothelial barrier function determine vascular permeability. In our mouse ear model, PGE2-induced increases in blood flow may outweigh the enhancement of the endothelial barrier, resulting in hyper-permeability. PGE2 has been reported to inhibit vascular permeability and suppress infiltration of proteins and cells into the alveolar space in mouse lung tissue by ventilator-induced lung injury (Birukova et al., 2007). In relatively endothelium-rich or mural cell-poor tissues such as the lungs, the endothelial barrier enhancement may overweigh the blood flow increase because of PGE2-stimulation.
There is a temporal discrepancy between the PGE2-induced vascular relaxation and vascular leakage. Mural cells relaxed (Figure 3A-C) and blood flow increased (Figure 2C and D) immediately after the PGE2-treatment, while vascular leakage occurred 10–15 min after stimulation. This might be due to enhancement of the endothelial barrier mediated by the PGE2-EP2–4 receptor signals. The barrier enhancement may temporarily prevent leakage caused by the increased blood flow. PGE2-induced vasodilatation (Figure 3A-C) and blood flow increase (Figure 2C and D) were seen in the all parts of arteries and veins soon after stimulation. However, vascular leakage was seen only in the bifurcation area of distal vessels. Similar observations were reported in the histamine-, serotonin- and mustard oil-induced acute inflammation models (Majno and Palade, 1961; Thurston et al., 1999). These phenomena may be due to the differences in vascular structure. Arteries or comparatively large veins have a firm and serried smooth muscle actin structure, and are resistant to leakage. In contrast, venules are covered by relatively weak and sparsely distributed pericytes. This structural weakness may account for the leakage observed. In addition, a previous report showed that blood-flow increase elicits high permeable condition particularly in bifurcation area by inducing disturbed flow at that site (Hahn and Schwartz, 2009). These structural and regional differences may account for the leakage observed in the bifurcation area of distal vessels.
EP3 receptor stimulation enhanced the endothelial barrier and suppressed vascular permeability without affecting the contraction of mural cells or local blood flow. We previously reported that an EP3 receptor agonist induced contraction in large or splanchnic arteries, while it did not influence contraction in small arteries, for example the tail artery (Kobayashi et al., 2011; Kida et al., 2014). Smooth muscle cells in small vessels are unlikely to be responsive to EP3 receptor-mediated signalling.
To elucidate the mechanism of vascular permeability regulation, recent studies have focused on endothelial barrier function. We here revealed the functional importance of mural cell function in vascular permeability. Furthermore, many mediators, including PGE2, may also affect haemocytes and not just vascular cells. Therefore, comprehensive studies are needed to fully elucidate the regulation of vascular permeability.
In summary, we revealed the functional contribution of the PGE2-EP receptor signal in the modulation of vascular permeability. PGE2 affects both mural cells and endothelial cells in regulating vascular permeability. The regulatory mechanism of vascular permeability varies according to the structure of each type of vessel. These results contribute to the explanation of the complex functions of PGE2 and may inform new therapeutic strategies against inflammatory diseases.
Acknowledgments
We acknowledge the Ono Pharmaceutical Company, Japan for donating ONO-DI-004, ONO-AE1-259-01, ONO-AE-248, and ONO-AE1-329. This work was supported by a Grant-in-Aid for JSPS Fellows (Taiki Kida), the Program for Promotion of Basic and Applied Researches for Innovations in Bio-oriented Industry (BRAIN), the Science and Technology Research Promotion Program for Agriculture, Forestry, Fisheries and Food Industry, a Grant-in-Aid from the Japan Society for the Promotion of Science, the Mochida Memorial Foundation, the Towa Foundation and the Takeda Science Foundation (Takahisa Murata).
Glossary
- HMVEC-d
human dermal microvascular endothelial cells
- S1P
sphingosine-1-phosphate
- TER
transendothelial electrical resistance
- VE
vascular endothelial
Author contributions
Study conception and design were done by K. O., T. K. and T. M. Acquisition of data was done by K. O. and T. K. Analysis and interpretation of data were done by K. O., T. K. and T. M. The paper was drafted by K. O., T. K. and T. M. Experimental tools were provided by M. H. and H. O.
Conflict of interest
None.
Supporting Information
Additional Supporting Information may be found in the online version of this article at the publisher's web-site:http://dx.doi.org/10.1111/bph.12815
Figure S1 All EP mRNA expression are observed in mouse ear. Typical picture of EP receptor mRNA expression in mouse ear and ileum. GAPDH is shown as a positive control.
Figure S2 Localization of mural cells in mouse ear. Typical pictures of whole mount immunostaining of desmin (left panels, green) and αSMA (middle panels, red). Right panels show merged pictures of desmin, αSMA and DAPI (blue) staining.
Figure S3 Effect of PGE2 and EP2-4 agonists on FITC-dextran leakage. (A) Typical pictures of FITC-dextran extravasation induced by PGE2. Distal and proximal vessels of mouse ears were observed. Scale bar, 100 μm. (B), (C) Effect of PGE2 and EP2-4 agonists on FITC-dextran leakage from proximal and distal vessels (n = 5). **Significantly different from the results in vehicle treatment at P < 0.01. Data are presented as means ± SEM.
Figure S4 EP3 agonist suppresses croton oil-induced FITC-dextran leakage. (A, B) Typical pictures of FITC-dextran extravasation induced by croton oil application with or without EP3 agonist pretreatment. Distal and proximal vessels of mouse ears were observed. Scale bar, 100 μm. (C), (D) Effect of EP3 agonist pretreatment on croton oil-induced FITC-dextran leakage from proximal and distal vessels (n = 5). **Significantly different from the results of the vehicle treatment at P < 0.01. Data are presented as means ± SEM.
Figure S5 Isoprenaline increases dye extravasation, local blood flow and vascular diameter. (A) Representative pictures of Evans Blue extravasation. Treatment with vehicle (left ear) or isoprenaline (Iso, right ear). (B) Typical pictures of changes in local blood flow. Treatment with vehicle (left ear) or Iso (right ear) (C) Effect of Iso on vascular diameter change (n = 4). **Significantly different from the results of the vehicle treatment at P < 0.01. Data are presented as means ± SEM.
Figure S6 Examining specificity of PGE2, EP2 and EP4 agonist. (A) Effects of FP (AL8810) and DP1 (BW A868C) antagonist on PGE2-induced TER increase in HUVECs (n = 4). (B) Effect of antagonists on respective EP agonists in HUVECs (n = 4). **Significantly different from the results of the vehicle treatment at P < 0.01. ##Significantly different from the results of EP2 or EP4 agonist treatment at P < 0.01. Data are presented as means ± SEM.
Figure S7 Effect of PGE2 and EP agonists on endothelial barrier in HMVECs-d. Maximum TER increase induced by PGE2 or EP agonist (6 ≤ n ≤ 8).
Figure S8 Effect of phenylephrine on endothelial barrier. Maximum TER increase induced by phenylephrine (n = 4). Data are presented as means ± SEM.
Figure S9 EP3 agonism-induced endothelial barrier enhancement is not mediated by either Gi or Gq. (A) Effect of Pertussis toxin (PTx) on EP3-induced increases in TER (6 ≤ n ≤ 12). (B) Effect of LY294002 on EP3-induced increases in TER (6 ≤ n ≤ 12). (C) Effect of EP3 agonism and ATP on intracellular Ca2+ level. **Significantly different from the results of the vehicle treatment at P < 0.01. ##Significantly different from the results of the S1P stimulation without any pretreatment (A, B) at P < 0.01. Data are presented as means ± SEM.
References
- Alexander SPH, Benson HE, Faccenda E, Pawson AJ, Sharman JL, Spedding M, et al. The Concise Guide to PHARMACOLOGY 2013/14: G protein-coupled receptors. Br J Pharmacol. 2013;170:1459–1581. doi: 10.1111/bph.12445. [DOI] [PMC free article] [PubMed] [Google Scholar]
- Armstead WM. Role of nitric oxide and cAMP in prostaglandin-induced pial arterial vasodilation. Am J Physiol. 1995;268(4):H1436–H1440. doi: 10.1152/ajpheart.1995.268.4.H1436. Pt 2): [DOI] [PubMed] [Google Scholar]
- Armulik A, Genove G, Betsholtz C. Pericytes: developmental, physiological, and pathological perspectives, problems, and promises. Dev Cell. 2011;21:193–215. doi: 10.1016/j.devcel.2011.07.001. [DOI] [PubMed] [Google Scholar]
- Bates DO. Vascular endothelial growth factors and vascular permeability. Cardiovasc Res. 2010;87:262–271. doi: 10.1093/cvr/cvq105. [DOI] [PMC free article] [PubMed] [Google Scholar]
- Birukova AA, Zagranichnaya T, Fu P, Alekseeva E, Chen W, Jacobson JR, et al. Prostaglandins PGE(2) and PGI(2) promote endothelial barrier enhancement via PKA- and Epac1/Rap1-dependent Rac activation. Exp Cell Res. 2007;313:2504–2520. doi: 10.1016/j.yexcr.2007.03.036. [DOI] [PMC free article] [PubMed] [Google Scholar]
- Bos CL, Richel DJ, Ritsema T, Peppelenbosch MP, Versteeg HH. Prostanoids and prostanoid receptors in signal transduction. Int J Biochem Cell Biol. 2004;36:1187–1205. doi: 10.1016/j.biocel.2003.08.006. [DOI] [PubMed] [Google Scholar]
- Breyer RM, Bagdassarian CK, Myers SA, Breyer MD. Prostanoid receptors: subtypes and signaling. Annu Rev Pharmacol Toxicol. 2001;41:661–690. doi: 10.1146/annurev.pharmtox.41.1.661. [DOI] [PubMed] [Google Scholar]
- Curry FR. Microvascular solute and water transport. Microcirculation. 2005;12:17–31. doi: 10.1080/10739680590894993. [DOI] [PubMed] [Google Scholar]
- Curry FR, Adamson RH. Vascular permeability modulation at the cell, microvessel, or whole organ level: towards closing gaps in our knowledge. Cardiovasc Res. 2010;87:218–229. doi: 10.1093/cvr/cvq115. [DOI] [PMC free article] [PubMed] [Google Scholar]
- Dejana E, Orsenigo F, Lampugnani MG. The role of adherens junctions and VE-cadherin in the control of vascular permeability. J Cell Sci. 2008;121(Pt 13):2115–2122. doi: 10.1242/jcs.017897. [DOI] [PubMed] [Google Scholar]
- Feletou M, Bonnardel E, Canet E. Bradykinin and changes in microvascular permeability in the hamster cheek pouch: role of nitric oxide. Br J Pharmacol. 1996;118:1371–1376. doi: 10.1111/j.1476-5381.1996.tb15547.x. [DOI] [PMC free article] [PubMed] [Google Scholar]
- Funk CD. Prostaglandins and leukotrienes: advances in eicosanoid biology. Science. 2001;294:1871–1875. doi: 10.1126/science.294.5548.1871. [DOI] [PubMed] [Google Scholar]
- Hahn C, Schwartz MA. Mechanotransduction in vascular physiology and atherogenesis. Nat Rev Mol Cell Biol. 2009;10:53–62. doi: 10.1038/nrm2596. [DOI] [PMC free article] [PubMed] [Google Scholar]
- Hatae N, Sugimoto Y, Ichikawa A. Prostaglandin receptors: advances in the study of EP3 receptor signaling. J Biochem. 2002;131:781–784. doi: 10.1093/oxfordjournals.jbchem.a003165. [DOI] [PubMed] [Google Scholar]
- Hirase T, Node K. Endothelial dysfunction as a cellular mechanism for vascular failure. Am J Physiol Heart Circ Physiol. 2011;302:H499–H505. doi: 10.1152/ajpheart.00325.2011. [DOI] [PubMed] [Google Scholar]
- Kida T, Sawada K, Kobayashi K, Hori M, Ozaki H, Murata T. Diverse effects of prostaglandin E2 on vascular contractility. Heart Vessels. 2014;29:390–395. doi: 10.1007/s00380-013-0374-6. [DOI] [PubMed] [Google Scholar]
- Kilkenny C, Browne W, Cuthill IC, Emerson M, Altman DG. Animal research: reporting in vivo experiments: the ARRIVE guidelines. Br J Pharmacol. 2010;160:1577–1579. doi: 10.1111/j.1476-5381.2010.00872.x. [DOI] [PMC free article] [PubMed] [Google Scholar]
- Kobayashi K, Murata T, Hori M, Ozaki H. Prostaglandin E2-prostanoid EP3 signal induces vascular contraction via nPKC and ROCK activation in rat mesenteric artery. Eur J Pharmacol. 2011;660:375–380. doi: 10.1016/j.ejphar.2011.03.032. [DOI] [PubMed] [Google Scholar]
- Kobayashi K, Tsubosaka Y, Hori M, Narumiya S, Ozaki H, Murata T. Prostaglandin D2-DP signaling promotes endothelial barrier function via the cAMP/PKA/Tiam1/Rac1 pathway. Arterioscler Thromb Vasc Biol. 2013;33:565–571. doi: 10.1161/ATVBAHA.112.300993. [DOI] [PubMed] [Google Scholar]
- Lee MJ, Thangada S, Claffey KP, Ancellin N, Liu CH, Kluk M, et al. Vascular endothelial cell adherens junction assembly and morphogenesis induced by sphingosine-1-phosphate. Cell. 1999;99:301–312. doi: 10.1016/s0092-8674(00)81661-x. [DOI] [PubMed] [Google Scholar]
- Levick JR, Michel CC. Microvascular fluid exchange and the revised Starling principle. Cardiovasc Res. 2010;87:198–210. doi: 10.1093/cvr/cvq062. [DOI] [PubMed] [Google Scholar]
- Ley K, Laudanna C, Cybulsky MI, Nourshargh S. Getting to the site of inflammation: the leukocyte adhesion cascade updated. Nat Rev Immunol. 2007;7:678–689. doi: 10.1038/nri2156. [DOI] [PubMed] [Google Scholar]
- Majno G, Palade GE. Studies on inflammation. 1. The effect of histamine and serotonin on vascular permeability: an electron microscopic study. J Biophys Biochem Cytol. 1961;11:571–605. doi: 10.1083/jcb.11.3.571. [DOI] [PMC free article] [PubMed] [Google Scholar]
- McGrath JC, Drummond GB, McLachlan EM, Kilkenny C, Wainwright CL. Guidelines for reporting experiments involving animals: the ARRIVE guidelines. Br J Pharmacol. 2010;160:1573–1576. doi: 10.1111/j.1476-5381.2010.00873.x. [DOI] [PMC free article] [PubMed] [Google Scholar]
- Mehta D, Malik AB. Signaling mechanisms regulating endothelial permeability. Physiol Rev. 2006;86:279–367. doi: 10.1152/physrev.00012.2005. [DOI] [PubMed] [Google Scholar]
- Morales-Ruiz M, Lee MJ, Zollner S, Gratton JP, Scotland R, Shiojima I, et al. Sphingosine 1-phosphate activates Akt, nitric oxide production, and chemotaxis through a Gi protein/phosphoinositide 3-kinase pathway in endothelial cells. J Biol Chem. 2001;276:19672–19677. doi: 10.1074/jbc.M009993200. [DOI] [PubMed] [Google Scholar]
- Murata T, Lin MI, Aritake K, Matsumoto S, Narumiya S, Ozaki H, et al. Role of prostaglandin D2 receptor DP as a suppressor of tumor hyperpermeability and angiogenesis in vivo. Proc Natl Acad Sci U S A. 2008;105:20009–20014. doi: 10.1073/pnas.0805171105. [DOI] [PMC free article] [PubMed] [Google Scholar]
- Nathan RA. The pathophysiology, clinical impact, and management of nasal congestion in allergic rhinitis. Clin Ther. 2008;30:573–586. doi: 10.1016/j.clinthera.2008.04.011. [DOI] [PubMed] [Google Scholar]
- Orsenigo F, Giampietro C, Ferrari A, Corada M, Galaup A, Sigismund S, et al. Phosphorylation of VE-cadherin is modulated by haemodynamic forces and contributes to the regulation of vascular permeability in vivo. Nat Commun. 2012;3:1208. doi: 10.1038/ncomms2199. [DOI] [PMC free article] [PubMed] [Google Scholar]
- Pawson AJ, Sharman JL, Benson HE, Faccenda E, Alexander SP, Buneman OP, Davenport AP, McGrath JC, Peters JA, Southan C, Spedding M, Yu W, Harmar AJ NC-IUPHAR. The IUPHAR/BPS Guide to PHARMACOLOGY: an expert-driven knowledgebase of drug targets and their ligands. Nucl. Acids Res. 2014;42(Database Issue):D1098–1106. doi: 10.1093/nar/gkt1143. [DOI] [PMC free article] [PubMed] [Google Scholar]
- Potter MD, Barbero S, Cheresh DA. Tyrosine phosphorylation of VE-cadherin prevents binding of p120- and beta-catenin and maintains the cellular mesenchymal state. J Biol Chem. 2005;280:31906–31912. doi: 10.1074/jbc.M505568200. [DOI] [PubMed] [Google Scholar]
- Szekanecz Z, Koch AE. Vascular involvement in rheumatic diseases: ‘vascular rheumatology. Arthritis Res Ther. 2008;10:224. doi: 10.1186/ar2515. [DOI] [PMC free article] [PubMed] [Google Scholar]
- Thibeault S, Rautureau Y, Oubaha M, Faubert D, Wilkes BC, Delisle C, et al. S-nitrosylation of beta-catenin by eNOS-derived NO promotes VEGF-induced endothelial cell permeability. Mol Cell. 2010;39:468–476. doi: 10.1016/j.molcel.2010.07.013. [DOI] [PubMed] [Google Scholar]
- Thurston G, Suri C, Smith K, McClain J, Sato TN, Yancopoulos GD, et al. Leakage-resistant blood vessels in mice transgenically overexpressing angiopoietin-1. Science. 1999;286:2511–2514. doi: 10.1126/science.286.5449.2511. [DOI] [PubMed] [Google Scholar]
- Wang Z, Ginnan R, Abdullaev IF, Trebak M, Vincent PA, Singer HA. Calcium/Calmodulin-dependent protein kinase II delta 6 (CaMKIIdelta6) and RhoA involvement in thrombin-induced endothelial barrier dysfunction. J Biol Chem. 2010;285:21303–21312. doi: 10.1074/jbc.M110.120790. [DOI] [PMC free article] [PubMed] [Google Scholar]
- Ware LB, Matthay MA. The acute respiratory distress syndrome. N Engl J Med. 2000;342:1334–1349. doi: 10.1056/NEJM200005043421806. [DOI] [PubMed] [Google Scholar]
- Weis SM. Vascular permeability in cardiovascular disease and cancer. Curr Opin Hematol. 2008;15:243–249. doi: 10.1097/MOH.0b013e3282f97d86. [DOI] [PubMed] [Google Scholar]
- Zhou G, Kamenos G, Pendem S, Wilson JX, Wu F. Ascorbate protects against vascular leakage in cecal ligation and puncture-induced septic peritonitis. Am J Physiol Regul Integr Comp Physiol. 2012;302:R409–R416. doi: 10.1152/ajpregu.00153.2011. [DOI] [PMC free article] [PubMed] [Google Scholar]
Associated Data
This section collects any data citations, data availability statements, or supplementary materials included in this article.
Supplementary Materials
Figure S1 All EP mRNA expression are observed in mouse ear. Typical picture of EP receptor mRNA expression in mouse ear and ileum. GAPDH is shown as a positive control.
Figure S2 Localization of mural cells in mouse ear. Typical pictures of whole mount immunostaining of desmin (left panels, green) and αSMA (middle panels, red). Right panels show merged pictures of desmin, αSMA and DAPI (blue) staining.
Figure S3 Effect of PGE2 and EP2-4 agonists on FITC-dextran leakage. (A) Typical pictures of FITC-dextran extravasation induced by PGE2. Distal and proximal vessels of mouse ears were observed. Scale bar, 100 μm. (B), (C) Effect of PGE2 and EP2-4 agonists on FITC-dextran leakage from proximal and distal vessels (n = 5). **Significantly different from the results in vehicle treatment at P < 0.01. Data are presented as means ± SEM.
Figure S4 EP3 agonist suppresses croton oil-induced FITC-dextran leakage. (A, B) Typical pictures of FITC-dextran extravasation induced by croton oil application with or without EP3 agonist pretreatment. Distal and proximal vessels of mouse ears were observed. Scale bar, 100 μm. (C), (D) Effect of EP3 agonist pretreatment on croton oil-induced FITC-dextran leakage from proximal and distal vessels (n = 5). **Significantly different from the results of the vehicle treatment at P < 0.01. Data are presented as means ± SEM.
Figure S5 Isoprenaline increases dye extravasation, local blood flow and vascular diameter. (A) Representative pictures of Evans Blue extravasation. Treatment with vehicle (left ear) or isoprenaline (Iso, right ear). (B) Typical pictures of changes in local blood flow. Treatment with vehicle (left ear) or Iso (right ear) (C) Effect of Iso on vascular diameter change (n = 4). **Significantly different from the results of the vehicle treatment at P < 0.01. Data are presented as means ± SEM.
Figure S6 Examining specificity of PGE2, EP2 and EP4 agonist. (A) Effects of FP (AL8810) and DP1 (BW A868C) antagonist on PGE2-induced TER increase in HUVECs (n = 4). (B) Effect of antagonists on respective EP agonists in HUVECs (n = 4). **Significantly different from the results of the vehicle treatment at P < 0.01. ##Significantly different from the results of EP2 or EP4 agonist treatment at P < 0.01. Data are presented as means ± SEM.
Figure S7 Effect of PGE2 and EP agonists on endothelial barrier in HMVECs-d. Maximum TER increase induced by PGE2 or EP agonist (6 ≤ n ≤ 8).
Figure S8 Effect of phenylephrine on endothelial barrier. Maximum TER increase induced by phenylephrine (n = 4). Data are presented as means ± SEM.
Figure S9 EP3 agonism-induced endothelial barrier enhancement is not mediated by either Gi or Gq. (A) Effect of Pertussis toxin (PTx) on EP3-induced increases in TER (6 ≤ n ≤ 12). (B) Effect of LY294002 on EP3-induced increases in TER (6 ≤ n ≤ 12). (C) Effect of EP3 agonism and ATP on intracellular Ca2+ level. **Significantly different from the results of the vehicle treatment at P < 0.01. ##Significantly different from the results of the S1P stimulation without any pretreatment (A, B) at P < 0.01. Data are presented as means ± SEM.