

Abstract
Object
Although clinical imaging defines the anatomical relationship between a brain tumor and the surrounding brain and neurological deficits indicate the neurophysiological consequences of the tumor, the effect of a brain tumor on vascular physiology is less clear.
Methods
An infrared camera was used to measure the temperature of the cortical surface before, during, and after removal of a mass in 34 patients (primary brain tumor in 21 patients, brain metastases in 10 and falx meningioma, cavernous angioma, and radiation necrosis–astrocytosis in one patient each). To establish the magnitude of the effect on blood flow induced by the tumor, the images were compared with those from a group of six patients who underwent temporal lobectomy for epilepsy. In four cases a cerebral artery was temporarily occluded during the course of the surgery and infrared emissions from the cortex before and after occlusion were compared to establish the relationship of local temperature to regional blood flow.
Discrete temperature gradients were associated with surgically verified lesions in all cases. Depending on the type of tumor, the cortex overlying the tumor was either colder or warmer than the surrounding cortex. Spatial reorganization of thermal gradients was observed after tumor resection. Temperature gradients of the cortex in patients with tumors exceeded those measured in the cortex of patients who underwent epilepsy surgery.
Conclusions
Brain tumors induce changes in cerebral blood flow (CBF) in the cortex, which can be made visible by performing infrared imaging during cranial surgery. A reduction in CBF beyond the tumor margin improves after removal of the lesion.
Keywords: infrared imaging, tumor vasculature, blood flow, brain temperature
In the operating room the gross anatomy of vessels on the surface of the cerebral cortex is immediately evident to the naked eye. Distortion or displacement of these vessels and signs of angiogenesis may also be seen on inspection of the cortical surface. A closer look detects physiological information, such as the oxygen consumption of the brain, by the redness of the arteries and the blue hue of the cortical veins. Visual inspection alone, however, cannot sensitively detect patterns of blood flow through the cortical vessels in and around tumors. An assessment of changes in blood flow would be helpful to understand the biological response of the brain to the surrounding brain tumor. For example, a reduction in cortical blood flow may indicate that hypoperfusion contributes to a neurological dysfunction caused by the tumor. Alternatively, an increase in blood flow to the tumor may reflect angiogenic properties of the tumor.
The application of infrared imaging for an assessment of brain temperature gradients has previously been examined in animals and humans. Initial studies in which a low-resolution infrared camera was used to image the brain intra-operatively showed that the temperature of primary brain tumors was lower than that of the surrounding normal tissue.15 Okudera, et al.,21 used an infrared camera to examine changes in the vein draining a cerebral arteriovenous malformation and the brain surrounding it, noting changes in the recovery of the surface temperature of both structures in response to irrigation with cold saline after interruption of the principle feeding artery. Gorbach10 applied this technique through the rat skull by using more modern equipment to demonstrate increased thermal activity in the cortical region surrounding an inoculated glioma. To improve spatial resolution for the detection of patterns of blood flow through cortical vessels in and around superficial cerebral tumors, we performed high-resolution infrared imaging of the exposed brain during surgery to remove intracranial tumors in humans and in nonhuman primates.8,9,11 Initial findings in primates and humans indicated that infrared imaging, which detects temperature, is a surrogate measure of CBF.24 Using infrared imaging and different data analysis techniques, Ecker and colleagues6 have characterized tumor temperature and temperature changes over the time of image acquisition. They identified hypothermal footprints of primary brain tumors. In the current study, aided by a high-resolution infrared camera and the same approach for data analysis that we recently used to assess functional cortical mapping,11 we conducted a further examination of the effect of the tumor on cortical temperature and the relationship of cortical temperature and blood flow in tumors.
The infrared camera has an array of recording elements that are sensitive to infrared light. Because infrared light is emitted in proportion to absolute temperature, this camera also measures temperature. The infrared camera converts invisible infrared energy to an electrical signal, which is displayed on the video monitor screen as a visible image. The intensity of the infrared light seen on the monitor is displayed as a gray scale image in which black areas represent the lowest temperature and white areas the highest temperature in the field. Infrared imaging of the skin, thermography, was previously used as a screening test for breast cancer.1 In that setting, tumors of increased vascularity appeared as a warm spot on a cool background because the tumor received more blood flow than the surrounding tissue and, therefore, preferentially warmed the overlying skin. Because thermography proved to be sensitive only to superficial tumors and because mammography was a more sensitive screening test, thermography is no longer used to screen for breast cancer.
More recently, infrared cameras have been developed that have a finer spatial resolution and greater temperature sensitivity than ones used previously for thermography of the breast. These cameras have been placed on satellites in space to detect temperature changes on the surface of the earth. Aiming a similar camera at the brain from 30 cm away would be expected to provide a highly detailed surface map of the temperature of the cerebral cortex. On this map the intensity of the temperature would be related to blood flow within superficial elements of the operative field. Detecting abnormalities in blood flow in the exposed cortex might enhance our understanding of the physiology of the microcirculation of the brain tumor and the surrounding brain. Finally, we hope to provide the initial steps for the development of an easily implemented, noninvasive tool to assess functional microvasculature during neurosurgery.
Clinical Material and Methods
Patient Popoulation
Thirty-four adult patients (19 women and 15 men, 21–68 years of age) who were undergoing craniotomy for a tumor located in the left (18 patients) or right (16 patients) hemisphere were considered eligible to participate in this study. The need for surgery was established independently by using conventional clinical indications. Informed consent for the diagnostic and surgical procedures was obtained from all patients by using a protocol approved by the Institutional Review Board of the National Institute of Neurological Disorders and Stroke, National Institutes of Health (Protocol No. 96-N-0093). Local anesthetic with intravenously induced sedation (fentanyl, midazolam, and propofol) was chosen for 18 patients whose intraoperative verbal responses were required to guide functional localization. The other 16 patients underwent surgery in the state of general anesthesia. For general anesthetic, the patients received midazolam as a premedication, propofol for induction, and fentanyl, cisatracurium besylate, oxygen, nitrous oxide, and isoflurane for maintenance of anesthesia. Rectal temperature was measured as part of the standard protocol in all patients; at the time of the infrared measurements the mean temperature was 35.5 ± 0.5°C.
Twenty-one patients had a primary brain tumor (eight high- or low-grade oligodendrogliomas, two mixed anaplastic oligodendroglioma or astrocytoma, one astrocytoma, and 10 GBMs), 10 patients had brain metastases (five melanomas, three adenocarcinomas, and two carcinomas), one patient had a falx meningioma, one had a cavernous angioma, and one had mixed radiation necrosis–astrocytosis.
Imaging Studies
An advanced digital infrared camera (Infrared Focal Plane Array camera; Lockheed Martin IR Imaging Systems, Inc., Goleta, CA) was used to image local temperature gradients across the cerebral cortex by passively detecting infrared emissions. As infrared emission at the measured wavelength (3–5 μm) is directly proportional to temperature, the camera was calibrated in units of temperature. The camera has a sensitivity of 0.02°C. One hundred images (each with a definition of 256 × 256 pixels) were obtained at intervals of 0.01 to 120 seconds and digitized at 14 bits per pixel. The camera was placed 10 to 30 cm above the exposed brain surface to achieve a field of view that fit the exposed area of the cortex (35 × 35 mm to 100 × 100 mm); this produced a spatial resolution for individual pixels of 100 × 100 μm to 350 × 350 μm.
To verify the dynamic range of the infrared imaging, a tympanic thermometer (model 3000A; Intelligent Medical Systems, Carlsbad, CA) was placed 10 mm above the cortex and measurements were obtained at five to nine locations. Maximum and minimum temperature values, measured using the thermometer, were the basis for choosing an appropriate, previously stored, two-point temperature calibration file for the infrared camera. To verify the accuracy of the infrared calibration more fully, a contact thermoprobe (model 4600 Precision Thermometer; Yellow Springs Instrument Co., Yellow Springs, OH) was used to measure the absolute temperature of the cortex in two patients.
The camera was attached either to the operating table or to a ceiling mount normally used for an operating room light; this allowed convenient optical access to the operative field. The camera, except for the lens, was covered with conventional surgical draping to maintain the sterility of the operative site. To reach the proper operating temperature of the detector, an electrical cooler within the camera was activated 20 minutes before we began to take measurements.
No alterations in operating room temperature or changes in airflow were required for the infrared measurements. In the operating room the infrared camera was not sensitive to light sources, except those close enough to the exposed brain to produce local heat. For this reason, surgical lights near the operative site were redirected from the surgical field during the infrared measurements.
Sequential digital images were obtained with the plane of the infrared camera lens positioned parallel to the plane of the exposed cortex. For viewing by the surgeon, the images were displayed on a large (150-cm-diagonal) rear projection monitor (Smart Technologies, Inc., Calgary, AB, Canada). To reduce the effects of physiological motion on different sets of infrared images, automated image acquisition started at the same point in the respiratory and cardiac cycles. To reduce other motion, patients given a local anesthetic agent were asked to remain as still as possible during periods of infrared imaging.
Background infrared imaging (100 images per 1-minute trial, three–four trials per patient) was performed in all 34 patients with brain tumors and six control patients undergoing epilepsy surgery by passive acquisition of spontaneous infrared emissions from the exposed tissue. Images were collected three times during the operation: 1) after surgical exposure of the dura mater; 2) after the dura mater was opened but before tumor resection; and 3) after tumor resection.
Infrared imaging in 10 patients (two–three trials per patient) was repeated during irrigation-induced hypothermia of the exposed cortex. An abrupt temperature reduction in the cortex was immediately achieved using a spray of saline vapor at room temperature. The saline spray (Misto International, Inc., Bethel, CT) was directed at the cortical surface from a distance of 20 to 25 cm with a compressed air propellant that uniformly dispersed short (3- to 5-second) pulses of droplet spray over the entire cortical area.
In three cases infrared images were acquired during the process of tumor resection, which allowed real-time visualization of temperature changes induced by surgical manipulations. When a cortical incision was indicated, as for temporal lobectomy, a small (~0.5-mm diameter) surface artery was temporarily occluded at the cortical incision site for 1 minute by using a temporary aneurysm clip. Infrared imaging began 30 seconds before occlusion, continued during the occlusion period, and did not end until 60 seconds after the occlusion had been relieved by removal of the clip. The total time for infrared imaging did not exceed 30 minutes in any case.
Standards for Tumor Identification and Measurements
Preoperative T1-weighted, contrast-enhanced, 3D MR imaging (spoiled-gradient sequences) studies were performed in all patients by using a 1.5-tesla clinical imager. The location of the tumor, the distance between the cortical surface and the most superficial portion of the tumor, and the dimensions of the tumor in three directions (anterior–posterior, superior–inferior, and left–right) were determined for each patient during preoperative planning (Advantage Windows Workstation; General Electric Medical Systems, Milwaukee, WI). The presumed border between the tumor and nontumor tissues was translated from the 3D cortical surface MR image (StealthStation Treatment Guidance software, version 3.0; Sofamor Danek, Broomfield, CO) to a high-resolution (0.08 mm/pixel), visible-light, digital photograph of the exposed cortex. Intraoperative ultrasound images were obtained in 20 cases.
Statistical Analysis
Successive trials of baseline infrared images acquired using an interval of at least 1 minute between trials were stored on an Axil Ultima workstation (Axil Computer, Inc., Santa Clara, CA) and analyzed (ENVI software, Research Systems, Inc., Boulder, CO). To analyze the data online, a representative image without any motion artifact was selected and color coded to make cortical thermal gradients visible during surgery.
To analyze the data offline, two approaches were used for each patient. 1) In the first approach specific temperature values were measured along a line that spanned the exposed cortex and the tumor. To accomplish this, a 1-pixel-wide line (a line ROI) was placed on the preresection infrared image to sample the normal cortex, the portion of cortex adjacent to the tumor, and the region over the central mass of the tumor area. To compare temperature gradients before and after tumor resection, the line ROI was placed in the same anatomical position on pre- and postresection images. 2) In the second approach temperature values in each pixel of the original infrared image were given a value relative to the highest and lowest temperature values in the image. To investigate the relationship between thermal gradients on infrared images and the pathological characteristics of the tumor, as well as other factors (see later description), the magnitude of the temperature of the cortex overlying the center of the tumor, relative to the highest and lowest temperature values, was calculated. For this analysis, three square ROIs (each 6 × 6 pixels) were placed on a representative infrared image in the cortical areas containing the lowest temperature (minimum pixel value), the highest temperature (maximum pixel value), and the center of the tumor. A temperature profile was obtained from each square ROI placed at the same location on each infrared image of that imaging sequence. Averaged between all images in a trial, the pixel values of each ROI were used to calculate the following: 1) a normalized difference between the temperature in the tumor area and the area of lowest temperature on the infrared image trial (ΔT1); and 2) the absolute difference between the highest and lowest temperature (that is, the range of temperature) on an infrared image trial (ΔT2). The following equations were used:
where “Tmax” refers to the temperature value obtained at the hottest area, “Ttumor” refers to the temperature value obtained at the tumor area, and “Tmin” refers to the temperature value acquired at the coolest area.
An analysis of variance was used to evaluate the effect of the pathological site and other factors (age and sex of the patient, side of the craniotomy, type of anesthesia, type of previous treatment [if any], and size, location, and depth of the tumor) on calculated thermal gradients. Wilcoxon tests were used for a further analysis involving the ΔT1 and ΔT2 for patients in the control and tumor groups before and after tumor resection. Statistical significance was considered to be a probability value less than 0.05.
The topographic distribution of thermal gradients was determined after importing the following images into Adobe PhotoShop 5.01 (Adobe Systems, Inc., Mountain View, CA): 1) infrared background images obtained before and after tumor resection; 2) digital photographs of the cortical surface obtained before and after tumor resection; and 3) the 3D MR image of the cortical surface, which had been made semitransparent to display the underlying tumor. These images were placed in separate layers, scaled, rotated, coregistered, and superimposed using anatomical landmarks. The layered images were analyzed by evaluating the temperature gradient on the infrared image with respect to the area identified as tumor by the preoperative MR imaging study and by the Stealth frameless stereotactic localizing system.
Results
Temperature of the Exposed Dura Mater
Infrared images collected after the dura mater had been exposed revealed a mixed pattern of dural and cortical vasculature (Fig. 1A and B). The temperature difference between the cortical arteries (1–1.5 mm in diameter) and the parenchyma was evident. The location of the tumor, however, was indistinct through the dura mater.
Fig. 1.

Intraoperative infrared (IR) images of the dura mater (B) and the exposed cortex (D) of a patient with metastatic melanoma in the parietal lobe of the right hemisphere. Visible-light images of the dura mater (A) and cortex (C) are provided for a comparison. Multiple cortical vessels (C) can be seen through the dura mater on an infrared image (B), as can some dural vessels (A) and (B). Note the temperature difference between the superficial cortical arteries and veins (C and D).
Temperature of the Exposed Cortex Before Tumor Resection
Baseline infrared images revealed a heterogeneity in temperature, ranging between 27 and 34°C on the exposed cortical surface in all cases (Fig. 1C and D). The brain images were composed of multiple thermal compartments (warm and cool) with an irregular form and distinctive vascular patterns. In general, the arteries appeared bright (highest temperature), the cortical surface appeared dark (low temperature), and the veins displayed an intermediate contrast, indicating an intermediate temperature (Fig. 1C and D). The difference between arteries and veins ranged between 1.5 and 2°C and that between veins and the brain parenchyma between 0.2 and 1°C.
A detailed comparison of visible-light (Figs. 1C and 2A) and infrared background images (Figs. 1D and 2B) showed that the warmest infrared signal emanated from the superficial vasculature. The coolest sites in cortical areas distinct from the lesion were generally in the center of the cortical gyri, where visible surface cortical vessels were the least dense.
Fig. 2.
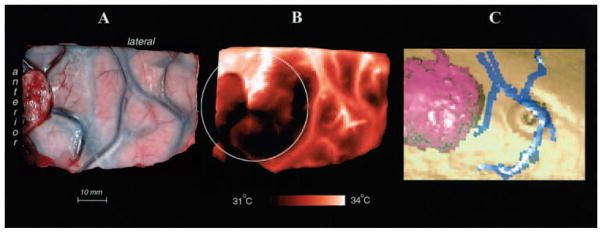
A and B: Comparison of a cortical infrared image (B) with a visible-light image (A) obtained before resection of a colon carcinoma that had metastasized to the right frontal area. C: A 3D reconstruction made from a preoperative contrast-enhanced MR image demonstrating the tumor (purple) and surface veins (blue). This image was obtained to project the tumor’s border on the cortical surface (circle in B).
In certain instances, the vascular patterns on the infrared image differed from those displayed on the visible-light image. In particular, some veins on the surface of the brain were similar in temperature to the surrounding brain and, therefore, were hidden on the infrared image. On the other hand, the high temperature in some small arteries caused them to appear larger on the infrared image than on the visible-light image. The rhythmic contraction and dilation of cortical arteries in response to the patient’s heartbeat was easily seen on the infrared images. Even when the cortical veins were clearly shown on those images, however, these vessels usually did not pulsate.
The cortical temperature remained relatively stable before the tumor was resected and during 1 to 2 hours of tumor resection, with the mean difference between the highest and the lowest temperature values being between 2 and 3°C. The cortical temperature was independent of the sex of the patient and the side of the craniotomy.
Cortical Temperature Gradients in the Region of the Tumor
Discrete thermal gradients corresponded in all cases to the location of the tumor as shown by preoperative MR imaging and intraoperative ultrasound imaging, and as verified by differences in visual appearance and tissue texture between the tumor and the surrounding brain (Figs. 2 and 3). In general, the infrared images detected a 0.5 to 2°C temperature difference between the cortex overlying the tumor and the surrounding cortex (Fig. 3C and F).
Fig. 3.

A–C: Infrared image of the cortex (A) obtained in a patient with an oligodendroglioma in the right frontal operculum, revealing a steep local decrease of temperature (hypothermia) at the site of the tumor (dark area; central mass of the tumor is at the intersection of the yellow and purple arrows). Corresponding visible-light image (B) and temperature profiles (C) are presented. D–F: Infrared image of the cortex in a patient with an astrocytoma (D) demonstrating a localized increase in the temperature (hyperthermia) at the site of the tumor (bright area with a central mass of the tumor at the intersection of the yellow and purple arrows). Corresponding visible-light image (E) and temperature profiles (F) are presented. The horizontal (yellow) and vertical (purple) temperature profiles show pixel values along the yellow and purple arrows in the infrared images. The visible-light images of the cortex in the patients are presented for orientation.
Tumors of glial lineage were primarily hypothermic. Of the 19 cases in which the cortex over the tumor was hypothermic relative to the surrounding brain, 10 were oligodendroglial tumors and eight were GBMs. In the case of mixed radiation necrosis–astrocytoma the temperature at the tumor was also hypothermic. Cerebral metastases were hyperthermic. Of the 13 cases in which the cortex overlying the tumor was hyperthermic relative to the surrounding cortex, nine were metastases (nine of 10 metastases) and the others were anaplastic oligodendroglioma or astrocytoma (one), astrocytoma (one), falx meningioma (one), and cavernous angioma (one). Mixed hypothermic and hyperthermic areas within the same lesion were identified in the other two cases, which included one astrocytoma and one metastasis (Fig. 2B).
For metastatic tumors, the normalized temperature (ΔT1) on average was 49% higher than that of the oligodendroma group (p = 0.001) and 40% higher than that of the GBM group (p = 0.014) (Fig. 4). The temperature change, which was identified using the absolute difference in temperature (ΔT2), was highest in the case of radiation necrosis–astrocytosis. Although an increase in the ΔT2 accompanied necrosis, the ΔT2 was also influenced by other factors: the ΔT2 decreased with the depth of the tumor (p = 0.02) and was 17% larger (p > 0.05) for the group of 18 patients undergoing surgery with local anesthetic than for the group of 16 patients with general anesthetic. Neither the ΔT1 nor the ΔT2 was influenced by the cortical location (frontal, temporal, parietal, and occipital) or by tumor volume, the side of the craniotomy, sex of the patient, or previous treatment.
Fig. 4.

Bar graph showing the normalized difference between the temperature of the cortex overlying the tumor and the minimum temperature at the cortex (ΔT1) for groups of patients with oligodendroglioma, cerebral metastasis from melanoma, and GBM. The normalized difference between the tumor and minimum temperatures is larger in the metastatic disease group than in the oligodendroglioma (p = 0.001) and GBM (p = 0.01) groups.
Evolution of Cortical Temperature During Vessel Occlusion and Saline Irrigation
Temporary occlusion of a small cortical artery (four patients) immediately reduced the infrared signal from the occluded vessel (Fig. 5 upper C, I, and J; and lower C′) and the temperature immediately dropped from the cortical regions perfused by it (Fig. 5 upper D and G; and lower D′). A concurrent temperature elevation was observed in certain areas remote from the occluded vessel, however (Fig. 5 upper D and K; and lower D′). After the occlusion was relieved, the infrared signal rapidly returned to normal in some areas (Fig. 5 upper G and J), whereas in other areas it took longer than 35 seconds to regain the preocclusion temperature level (Fig. 5 upper E, H, and I; and lower E′).
Fig. 5.

Upper: Cortical temperatures during occlusion and reperfusion of a single vessel. A: A visible-light image. A vessel with a 0.9-mm diameter, which was located in the area of a superficial tumor (GBM) was chosen for a temporary (14.7-second) occlusion. B–E: Four representative infrared images were chosen from 90 images that were obtained (350 msec/image) and represent temperature changes 0.35 seconds before clipping (B), 1.4 seconds after clipping (C), 0.35 seconds before reperfusion (D), and 12.9 seconds after reperfusion (E); a diminishing number of bright cortical vessels can be seen after occlusion. Note the difference in the rate of temperature decline on the temperature profiles (temperature changes in relative value) from ROIs in the brain parenchyma (G) and vessel (H). Note also the ROIs close to the clipping site (G and H) and those at a distance of 40 mm (K) and 70 mm (I and J), which display changes in temperature, although other cortical sites (F) do not. Two small arrows (J) show the start and end of the occlusion. Note the inverse temperature changes in J and K and the different rates of change in G and J during occlusion but not during reperfusion. Lower: Views in which subtraction was used to enhance the capacity to make visible the changes in individual vessels and their distribution after proximal vessel occlusion. The images demonstrate infrared image enhancement during the occlusion and reperfusion of a single vessel (see upper panel). Images B′, C′, D′, and E′ are the result of a normalized subtraction of a baseline image (collected 0.7 seconds before clipping; not shown here) from representative infrared images (B, C, D, and E in upper panel). Note the difference between C′ and D′ in the vascular territories involved. Note that the image in B′ is not black because its represents subtraction of two images collected at slightly different phases of the cardiac cycle.
Substantial changes in infrared signal intensity were induced by uniformly irrigating the exposed cortex with saline at room temperature in 10 patients (Fig. 6). Hypothermia persisted at tumor sites for 20 to 60 seconds after irrigation, whereas in the normal cortex it persisted for only 10 to 20 seconds (Fig. 6C and E). On average irrigation created approximately a 10% increase in the temperature difference between the tumor and nontumor tissues; this effect was most prominent on cortical infrared images acquired 10 to 15 seconds after the end of irrigation.
Fig. 6.

Cortical temperature changes associated with evaporation of saline. The cortical infrared images were obtained 1 second before (A), during (B), and 35 seconds after application of vaporized saline (C). Regions of interest (5 × 5 pixels) are marked in the tumor area (red square) and normal cortex (yellow square) on the infrared image (D; the image is an enlargement of that shown in C). A temperature profile (E) was extracted from 100 images (obtained in 1 second) acquired during a 2-second saline irrigation (downward pointing arrow indicates the start and upward pointing arrow indicates the end of the irrigation). Note the difference in temperature recovery between the tumor area (red line in graph) and the normal cortex (yellow line in graph) after evaporative cooling.
Cortical Temperature After Tumor Resection
Changes in infrared signal intensity and the spatial reorganization of temperature gradients associated with it were observed after tumor resection in 28 patients. Far from the area of resection, multiple cortical sites and vessels appeared that had not been evident on the infrared images obtained before tumor resection (Fig. 7B). In contrast, a decrease in the infrared signal was usually seen at the margin of the tumor bed, forming a ring around the area of resection (Fig. 7B). The width and shape of the tissue at the margin varied from case to case, but its temperature was cooler than more distant cortex (Fig. 7D) in 22 patients and warmer in six cases. Absolute temperature differences (ΔT2) increased 28.1% after resection compared with the ΔT2 before resection (p = 0.0003; 28 patients). An increased ΔT2 after tumor resection was mainly caused by an increased Tmax in 22 patients. The remainder of the patients had either the same Tmax (five patients) or a decreased Tmax (one patient).
Fig. 7.

Reorganization of cortical temperature gradients after tumor resection. A and B: Cortical infrared images obtained before (A) and after (B) resection of a low-grade oligodendroglioma. Straight lines (solid red line in A and solid blue line in B) were placed on infrared images passing through the tumor center and its projection on the cortex. Two temperature profiles—before tumor resection (C) and after it (D)—reflect temperature changes along the solid red line in A and the solid blue line in B. Note that far from the area of resection, multiple cortical sites and vessels previously invisible on the preresection infrared image (A) are now seen on the postresection infrared image (B). After resection, the brain tissue adjacent to the tumor bed is cooler than the surrounding brain (arrows in B and D).
Comparison of Cortical Temperature Between Patients With Tumor and Control Patients
The absolute temperature differences between epileptic sites confirmed by electrocorticography and surrounding cortex (six patients) were found to be less than 0.5°C. The temperature range over the exposed brain in this group (ΔT2) was 29% lower than that in the tumor group (p = 0.03). The larger ΔT2 in the tumor group compared with the epilepsy group could not be attributed to changes in either the Tmin or Tmax.
Discussion
The cortical temperatures that were measured in this study by using the infrared method were in the range previously recorded using thermocouples during brain surgery.17,18,23 Unlike remote sensing, which is an attractive feature of the infrared camera, thermocouples require brain contact. Placement of a thermocouple on the cortex unavoidably compresses tiny vessels on the cortical surface, reducing local CBF and altering local cortical temperature. In addition, the limited resolution of the thermocouple technique makes it insensitive for detection of discrete thermal gradients. The temperature map of the cortical surface provided by infrared imaging demonstrates changes in infrared signal intensity that are quantifiable and reproducible. The infrared method sensitively detects multiple thermal compartments (warm and cool patches) within the image. Disruption of the normal vascular pattern of the cortex by the tumor is apparent on infrared images, and the boundary separating the tumor from the surrounding brain correlated relatively well with MR and ultrasound imaging techniques.
Nature of the Infrared Signal
Despite the fact that it consitutes only 2% of total body weight, the brain receives approximately 20% of the cardiac output. Most CBF is to the cortex, the region of the brain that can be most easily examined by the infrared camera during surgery. Because the density of infrared photons is directly proportional to the surface temperature, infrared imaging of the brain depends on the creation of thermal gradients between the cortical blood vessels and the surrounding cortical parenchyma, which arise when the brain is exposed to ambient air during brain surgery. The core body temperature is kept in the normal range (35–37°C) during surgery by normal physiological mechanisms and through the use of blankets to prevent heat loss from the skin. Thus, blood enters the arteries on the brain surface at core body temperature.
In contrast to this warm arterial blood, due to evaporation and exposure to the ambient temperature (21°C) of the operating room, the surface of the brain had a temperature ranging between 27 and 34°C. The temperature of the cortical surface did not decrease all the way to room temperature because heat was provided by arterial blood entering the cortical arteries and heat was conducted from the part of the brain that lay deep to the cortical surface. On the infrared images, warm blood entering arteries illuminated specific regions on the cool, dark cortical surface, creating a gray scale (or pseudocolor) image of brain thermal gradients.
Veins on the surface of the brain were not as warm as the arteries, but they were usually warmer than the cortex, implying that the veins contained blood that drained from cortical capillaries and/or subcortical capillaries, which were less exposed to the ambient temperature of the operating room. Because the infrared emission from the cortical arteries and veins is greater than that from the cool gyral surface, the infrared image is, at first glance, an angiogram of bright cortical vessels on a dark background. In addition to the major vessels, linear regions of higher temperature also are visible and appear to arise from blood flow within smaller vessels.
In certain instances, vascular patterns on the infrared image differed from those on the visible image. In particular, the temperature of some veins on the brain surface was similar to that of the surrounding brain and, therefore, these veins were not evident on the infrared image. On the other hand, the high temperature detected in some small-diameter arteries caused them to appear larger on the infrared image than on the visible-light image.
On further inspection, not only the angioarchitecture but also hemodynamic changes are reflected on the infrared images. For instance, the pulsatile rhythmic contraction and dilation of the cortical arteries was easily seen. Even when the cortical veins were clearly shown on the infrared image, however, they rarely appeared to pulsate. Furthermore, at each repeated arterial occlusion a rapid decrease in blood flow in the occluded vessel (flow drops to zero during occlusion) was concomitant with the disappearance of this vessel on the infrared image, indicating that the temperature of blood retained in the vessel and the temperature of the cortical surface are immediately equilibrated (Fig. 5C and D). The decrease in temperature after arterial occlusion was not so rapid in the parenchyma (Fig. 5G), reflecting the heat reservoir of the tissue and indicating at least some degree of retained microcirculation after vessel occlusion. At the time of reperfusion an occluded vessel immediately reappears on the infrared images (Fig. 5E), reflecting the specificity of the infrared signal to blood flow, but not to the blood itself.
Temperature of the Exposed Dura Mater
The high vascularity of the cortex was detected on the infrared images of the dura mater before the dura was opened surgically. On exposure to ambient temperature, the dura mater has a dark (low infrared signal) background. With the dura closed, the cerebral cortex is partially protected from the cooling effects of evaporation and direct exposure to room air. On its inner surface the dura was particularly warm at sites at which it was contiguous with cortical arteries. Because of heat diffusion from the internal to the external surface of the dura, the cortical arteries appeared in sharp contrast to the overlying dura mater on the infrared images.
Infrared photons can penetrate tissue to a depth of approximately 100 μm. Because of thermoconduction, however, deeper brain structures may change the surface temperature and, therefore, contribute to the infrared signal. Figure 1B demonstrates the visibility of cortical vessels through the dura mater. Thus, although the temperature that is measured is only from the most superficial 100 μm, this measurement is a reflection of a mixture of heat produced by surface and subsurface structures.
Cortical Thermal Gradients in the Region of the Tumor
Brain tumors contain a lower density of microvessels, with a greater separation between microvessels than is present in normal brain.22 The edematous region of brain surrounding implanted experimental tumors, which increases the volume of the white matter by approximately 60%, reduces CBF by volumetric expansion of the affected tissue.13 Regional CBF is reduced in primary and metastatic brain tumors and in tissue surrounding them that is affected by edema.2,12,14,16,19,20 Furthermore, because of the “disconnection effect” exerted by the tumor and surrounding edema on the overlying cortex, the metabolism of the cortical gray matter, as measured by accumulation of F-deoxyglucose, is reduced in the cortex overlying intracerebral tumors.4,5,7 Because of these factors, cerebral blood volume and CBF are significantly reduced in the cortex overlying intracerebral tumors.3,12,14,16,19,20
In all cases the location of the tumor was associated with discrete thermal gradients that corresponded with the region overlying the tumor, as defined by preoperative MR imaging and intraoperative ultrasound imaging and as verified by differences in visual appearance and tissue texture between the tumor and surrounding brain (Figs. 2 and 3). In general, the infrared images detected between a 0.5 and 2°C temperature difference between the cortex overlying the tumor and the surrounding cortex (Fig. 3C and F).
The tumors of glial lineage were primarily hypothermic. In general, this result concurs with findings of Ecker and colleagues,6 who used somewhat similar equipment, but differing approaches to data analyses to find the temperature of the superficial tissue overlying tumors to be hypothermic in relation to the surrounding cortex in 14 of 16 patients.6 In our study a hypothermic lesion was apparent in the case of mixed radiation necrosis–astrocytoma. In contrast, the superficial temperature of tissue in the region overlying cerebral metastases tended to be hyperthermic.
Evolution of Cortical Temperature During Irrigation With Saline
Large reductions in infrared signal intensity were uniformly induced by irrigation, which led to saline being vaporized on the exposed cortex. This hypothermia persisted at cortical sites overlying the tumor much longer than in the surrounding cortex. This cooling effect accentuated the temperature difference between the region of the tumor and distant sites.
Cortical Temperature After Tumor Resection
In all patients spatial reorganization of thermal gradients was observed after tumor resection, indicating a change in local CBF. Because the infrared signal increased in the cortex distant to the tumor immediately after tumor resection, it appeared that the tumor had reduced cortical blood flow by exerting pressure on surrounding tissue, rather than by releasing soluble factors that would require a more prolonged interval for dissipation. Surgery had the opposite effect on the brain immediately adjacent to the tumor, causing a reduction in the infrared signal. This appeared to be a result of coagulation of vessels entering and leaving the tumor margin, producing a narrow rim of devascularized tissue facing the surgical cavity.
Advantages and Limitations of Intraoperative Infrared Imaging
Intraoperative infrared imaging performed using the system described allows continuous monitoring of temperature, a surrogate marker of superficial cortical blood flow, during surgery. The use of infrared imaging does not require altering the surgical technique of tumor removal. In addition, to make visible the distribution of CBF, infrared imaging does not require the use of a chemical contrast medium because warm blood within the blood vessels appears bright and in sharp contrast to the dark background of the cool cortical surface. Passive monitoring of infrared radiation from the brain does not require contact with the cortical surface and is safe. Although most of our imaging studies were performed during pauses in the surgical procedure, in three cases infrared imaging continued throughout tumor resection, demonstrating that the operative procedure does not need to be interrupted for infrared imaging if the camera is provided with a clear line of sight to the surgical field.
Infrared images were displayed in real time on a computer monitor in the operating room. Shifting of the brain did not result in a loss of orientation, which may occur with surgical guidance systems that depend on preoperative imaging studies. In addition, infrared imaging may prove useful in the future as a guidance tool for correction of tissue displacement.
The gray scale and pseudocolor images of temperature have a fine spatial resolution that is adequate to detect thermal gradients between the tumor and the peritumoral tissue. Images were transmitted directly from the infrared camera to the video monitor, allowing an immediate qualitative analysis of thermal gradients within the operative exposure. An assessment of the magnitude of the thermal gradients required that signal intensities from different cortical regions be compared on a temperature reference scale. A precise numerical analysis of temperature values across the image was performed using a computer, which took a few minutes. In all cases, the images accurately and reproducibly displayed thermal gradients that reflected the vascular physiology of the brain surface and tumor during the surgical procedure. Nevertheless, our experience indicates that, at least at this stage in its development and use, intraoperative infrared imaging cannot be used to define the margins of a tumor for accurate resection while preserving contiguous functional brain tissue.
Abbreviations used in this paper
- CBF
cerebral blood flow
- GBM
glioblastoma multiforme
- MR
magnetic resonance
- ROI
region of interest
- 3D
three-dimensional
Footnotes
A portion of the work described here was presented at the 1997 annual meeting of the Congress of Neurological Surgeons in New Orleans, Louisiana, and at the 1998 annual meeting of the American Association of Neurological Surgeons in Philadelphia, Pennsylvania.
References
- 1.Anbar M, Brown C, Milescu L, et al. The potential of dynamic area telethermometry in assessing breast cancer. IEEE Eng Med Biol Mag. 2000;19:58–62. doi: 10.1109/51.844381. [DOI] [PubMed] [Google Scholar]
- 2.Behrens PF, Ostertag CB, Warnke PC. Regional cerebral blood flow in peritumoral brain edema during dexamethasone treatment: a xenon-enhanced computed tomographic study. Neurosurgery. 1998;43:235–241. doi: 10.1097/00006123-199808000-00027. [DOI] [PubMed] [Google Scholar]
- 3.Capon A, Hildebrand J, Verbist A, et al. Changes in regional cerebral blood flows produced by dexamethasone in patients with brain metastases. Acta Neurol Belg. 1976;76:325–330. [PubMed] [Google Scholar]
- 4.DeLaPaz RL, Patronas NJ, Brooks RA, et al. Positron emission tomographic study of suppression of gray-matter glucose utilization by brain tumors. AJNR. 1983;4:826–829. [PMC free article] [PubMed] [Google Scholar]
- 5.Di Chiro G, DeLaPaz RL, Brooks RA, et al. Glucose utilization of cerebral gliomas measured by [18F] fluorodeoxyglucose and positron emission tomography. Neurology. 1982;32:1323–1329. doi: 10.1212/wnl.32.12.1323. [DOI] [PubMed] [Google Scholar]
- 6.Ecker RD, Goerss SJ, Meyer FB, et al. Vision of the future: initial experience with intraoperative real-time high-resolution dynamic infrared imaging. Technical note. J Neurosurg. 2002;97:1460–1471. doi: 10.3171/jns.2002.97.6.1460. [DOI] [PubMed] [Google Scholar]
- 7.Fishbein DS, Chrousos GA, Di Chiro G, et al. Glucose utilization of visual cortex following extra-occipital interruptions of the visual pathways by tumor. A positron emission tomography study. J Clin Neuroophthalmol. 1987;7:63–68. [PubMed] [Google Scholar]
- 8.Gorbach A, Heiss J, Kufta C, et al. Functional brain mapping during surgery with sensitive, high-resolution digital optical infrared imaging. Congress of Neurological Surgeons 47th Annual Meeting; New Orleans. 1997; Schaumburg, IL: Congress of Neurological Surgeons; 1997. p. 217. (Abstract) [Google Scholar]
- 9.Gorbach A, Heiss J, Kufta C, et al. Intraoperative localization of brain tumors and surrounding functional cortex with infrared imaging. American Association of Neurological Surgeons 1998 Annual Meeting; Philadelphia, Pennsylvania. April 25–30, 1998; Park Ridge, IL: American Association of Neurological Surgeons; 1998. p. 322.p. 324. (Abstract) [Google Scholar]
- 10.Gorbach AM. Infrared imaging of brain function. Adv Exp Med Biol. 1993;333:95–123. doi: 10.1007/978-1-4899-2468-1_11. [DOI] [PubMed] [Google Scholar]
- 11.Gorbach AM, Heiss J, Kufta C, et al. Intraoperative infrared functional imaging of human brain. Ann Neurol. 2003;54:297–309. doi: 10.1002/ana.10646. [DOI] [PubMed] [Google Scholar]
- 12.Hino A, Imahori Y, Tenjin H, et al. Metabolic and hemodynamic aspects of peritumoral low-density areas in human brain tumor. Neurosurgery. 1990;26:615–621. doi: 10.1097/00006123-199004000-00009. [DOI] [PubMed] [Google Scholar]
- 13.Hossman KA, Bloink M. Blood flow and regulation of blood flow in experimental peritumoral edema. Stroke. 1981;12:211–217. doi: 10.1161/01.str.12.2.211. [DOI] [PubMed] [Google Scholar]
- 14.Ito M, Lammertsma AA, Wise RJ, et al. Measurement of regional cerebral blood flow and oxygen utilisation in patients with cerebral tumors using 15O and positron emission tomography: analytical techniques and preliminary results. Neuroradiology. 1982;23:63–74. doi: 10.1007/BF00367239. [DOI] [PubMed] [Google Scholar]
- 15.Koga H, Mori K, Ono H, et al. Intraoperative regional thermography during surgery of brain tumors. Neurol Med Chir. 1987;27:1033–1038. doi: 10.2176/nmc.27.1033. (Jpn) [DOI] [PubMed] [Google Scholar]
- 16.Kuroda K, Skyhoj Olsen T, Lassen NA. Regional cerebral blood flow in various types of brain tumor. Effect of the space-occupying lesion on blood flow in brain tissue close to and remote from tumor site. Acta Neurol Scand. 1982;66:160–171. doi: 10.1111/j.1600-0404.1982.tb04513.x. [DOI] [PubMed] [Google Scholar]
- 17.Mellergard P. Intracerebral temperature in neurosurgical patients: intracerebral temperature gradients and relationships to consciousness level. Surg Neurol. 1995;43:91–95. doi: 10.1016/0090-3019(95)80049-m. [DOI] [PubMed] [Google Scholar]
- 18.Mellergard P, Nordstrom CH. Epidural temperature and possible intracerebral temperature gradients in man. Br J Neurosurg. 1990;4:31–38. doi: 10.3109/02688699009000679. [DOI] [PubMed] [Google Scholar]
- 19.Nakayama Y, Tanaka A, Kumate S, et al. Cerebral blood flow in normal brain tissue of patients with intracranial tumors. Neurol Med Chir. 1996;36:709–715. doi: 10.2176/nmc.36.709. (Jpn) [DOI] [PubMed] [Google Scholar]
- 20.Niwa M, Oyama H, Furuse M, et al. Effect of glycerol on blood flow distribution in tumoral and peritumoral brain tissue. Acta Neurochir Suppl. 1997;70:162–164. doi: 10.1007/978-3-7091-6837-0_49. [DOI] [PubMed] [Google Scholar]
- 21.Okudera H, Kobayashi S, Toriyama T. Intraoperative regional and functional thermography during resection of cerebral arteriovenous malformation. Neurosurgery. 1994;34:1065–1067. doi: 10.1227/00006123-199406000-00017. [DOI] [PubMed] [Google Scholar]
- 22.Schlageter KE, Molnar P, Lapin GD, et al. Microvessel organization and structure in experimental brain tumors: microvessel populations with distinctive structural and functional properties. Microvasc Res. 1999;58:312–328. doi: 10.1006/mvre.1999.2188. [DOI] [PubMed] [Google Scholar]
- 23.Stone JG, Goodman RR, Baker KZ, et al. Direct intraoperative measurement of human brain temperature. Neurosurgery. 1997;41:20–24. doi: 10.1097/00006123-199707000-00007. [DOI] [PubMed] [Google Scholar]
- 24.Watson JC, Gorbach AM, Pluta RM, et al. Real-time detection of vascular occlusion and reperfusion of the brain during surgery by using infrared imaging. J Neurosurg. 2002;96:918–923. doi: 10.3171/jns.2002.96.5.0918. [DOI] [PubMed] [Google Scholar]