

Abstract
Reliable estimation of sewage flow rates is essential for the proper design of sewers, pumping stations, and treatment plants. The design of the various components of the sewerage system should be based on the most critical flow rates with a focus on extremely low and peak flow rates that would be sustained for a duration related to the acceptable limits of behavior of the components under consideration. The extreme flow conditions and to what extent they differ from the average values are closely related to the size of the community or network, and the socioeconomic conditions. A single pumping station is usually sufficient to pump flow from small community in either flat or non-undulating topography. Therefore, the hydraulic loading on the wastewater treatment plant (WWTP) results from the pumped flow from the pumping station rather than the trunk sewer flow. The intermittent operation of the pumping units further accentuates the sewage hydrograph in the final trunk sewer. Accordingly, the design flow for the various components of the WWTP should be determined based on their relevant flow factors. In this study, analysis of one representative small community out of five monitored small communities in Egypt and the Kingdom of Saudi Arabia is presented. Pumped sewage flow rates were measured and the sewer incoming flows were hydraulically derived. The hourly and daily sewer and pumped flow records were analyzed to derive the relationship between the flow factors that would be sustained for various durations (instantaneously, 1 h, 2 h, etc.) and their probability of non-exceedance. The resulting peaking factors with a consideration for their sustained flow duration and specified probability would permit the design of the various components of the treatment plant using more accurate critical flows.
Keywords: Peak flow factors, Sewers, Pumping stations, Wastewater treatment plants, Small communities
Introduction
The efficient management of wastewater flow requires a realistic acquaintance with its characteristics. Thorough characterization data of these flows are necessary not only to enhance the progress of the efficient design of wastewater treatment and disposal systems, but also to facilitate the development and application of water preservation and waste load reduction strategies. Prediction of wastewater flow rates and its variation are both important at the stage of designing wastewater treatment plants (WWTPs) and during their operation. Small capacity WWTPs are seriously affected by flow rate variation. EPA reported that small communities will generally feed WWTPs with highly accentuated peaks and minimums [1]. Butler and Graham indicated that these flows are generally intermittent of relatively short durations and are hydraulically non-steady [2].
Flow into the sewers of small community results from the quasi-random usage of a range of home appliances (with frequency of use being related to the time of day and living and work style of the residents), each with its own characteristics. At the outfall, the observed flow in the sewer is normally continuous and tends to have repetitive diurnal patterns, although it is still subject to variability. As the sewer network becomes larger, flows from the different branches join and tend to even out the flow variation. Therefore, flow variability decreases as the population increases. The flow routing in the sewers further dampens these variations due to the in-sewer storage and subsequent release.
A small community, due to its limited areal extent, is typically served by one pumping station to discharge the wastewater collected by the gravity sewer network to the treatment plant. The capacity of pumps, the hydraulic design of the sump, and the operation of the pumping station accentuate the inflow hydrograph reaching the treatment plant. Therefore, the peaking factors usually given by the design codes for sewer flow may not be applied identically in the design of the individual components of the treatment plant. The outflow of the pumping station should be equally considered. Sewage discharges from small communities flowing in the trunk sewer are highly variable, and there are uncertainties in the values of the maximum and average hourly and daily-sustained flows.
Peak and low flows are estimated as multiples of average wastewater flow. Several equations have been developed to estimate flow factors. The common variables that govern most of these equations are the population and the average daily flow. Table 1 summarizes some of the equations that estimate peaking factors.
Table 1.
Some equations to estimate peak flow factors.
| Method | Peaking factor formula | Sustained duration | Conditions of application |
|---|---|---|---|
| Babbit and Baumann [3] | Instantaneous | 1 ⩽ P ⩽ 1000, P in thousands | |
| Harmon [4] | 2.5 | Hourly | P in thousands |
| >or | |||
| Munksgaard and Young [5] | Extreme annual peak 4 h | Qm, in m3/s | |
| Extreme annual peak 8 h | Qm, in m3/s | ||
| Extreme annual peak day | Qm, in m3/s | ||
The probability of non-exceedance is an important factor that should be considered in the estimation of the design flow factors. Gaines suggested that the engineering judgment should expect probabilities based on the function of sewers and the controlling agency permits [6]. Zhang et al. developed a theoretical peaking factor equation for water and domestic wastewater using Poisson rectangular pulse model [7]. This equation relates the peaking flow factor with number of homes in the community and percentile of Gumbel distribution. They compared the results obtained by the rectangular pulse model at percentile 99.9 to some empirical methods like the Babbitt and Baumann and Harmon formulas at different population figures. The results from the rectangular pulse model gave values lower than those of Babbitt and Baumann equation and higher than those of Harmon equation. Elnakar combined statistics, environmental hydraulics, simulation techniques, and social behavior of water users to derive a model that could estimate flow factors [8]. His model presented the flow factors in different levels of probability of non-exceedance. He indicated that the design may opt to design the various sewerage system components using the appropriate probability based on the available project budget and the required level of service.
Moreover, various components of the WWTP should be designed based on relevant flow factors that account for their acceptable limits of behavior. Metcalf and Eddy noted that the expected sustained flows that persist for various time durations (2 h or longer) are on equal importance with the expected peak flows, especially in the design of wastewater treatment facilities [9]. Young et al. indicated that individual plant units are affected by different flow and load variations that require different peaking factors [10].
The main objective of this study is to derive flow factors for the design of trunk sewers, pump stations, and WWTP for typical small community accounting for their probability of non-exceedance and their variation with the duration of the sustained flow. Data of a representative small community in Egypt called West of Golf are used to derive the peak factor which can be applied to other similar communities.
Case study – West of Golf (WG), Cairo-Egypt
West of Golf small community is a residential compound in New Cairo, Egypt, with a saturated population equal to 22,000 capita. The current estimated population is about 6000 capita. The gross area of the community is 190 acres. The compound is located at high altitude far from the Nile, which makes the community a near-arid desert community. The community is composed of mostly luxury residential villas, green areas, and more than 45 swimming pools. The average generated sewage from the community is 2200 m3/day.
The sewer system is a combined sewer system although it rarely rains. Gravity sewers collect the wastewater to a pumping station that discharges via a force main to a wastewater treatment plant serving this compound and other residential districts in the region. The pumping station has two duty submersible pumps with a capacity of 396 m3/h each. Presently, only one duty pump is in operation automatically according to the set levels of water in the sump.
Sewage flows pumped to the treatment plant were measured by the station flow confirmed by a portable ultrasonic flow meter that was mounted on the discharge pipe of the pumping station. Hydraulic modeling of the sump and the pumps derived the incoming sewer flow hydrographs. Tracking of the water level variation in the sump was also used to verify the incoming sewer flow hydrograph.
Fig. 1 shows a typical sewer flow hydrograph discharging into the sump of WG pumping station. It indicates that peak flow occurred near 4:00 pm on that day, while significantly lower flows took place late at night.
Fig. 1.

Sewer inflow hydrograph to WG pumping station (Saturday November 13, 2010 – daily flow = 2290 m3/day).
Since the pumping capacity is 396 cubic meters per hour which is higher than the peak flow of 190 m3/h and even much higher than the low night flow of 52 m3/h, then the pumping station will operate intermittently with cycles of On and Off periods. The intermittent flow and “surge-like” operation of WG pumping station, as shown in Fig. 2, are the result of the oversized pump in relation to the present partial development of the community. Fig. 3 shows the statistics of the durations of full pumping cycles (duration of a cycle = On + Off periods).
Fig. 2.
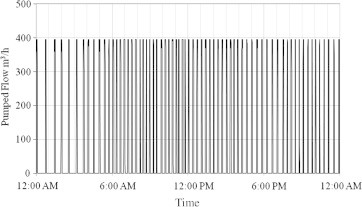
Intermittent Outflow of WG pumping station for (Saturday November 13, 2010 – daily flow = 2290 m3/day).
Fig. 3.
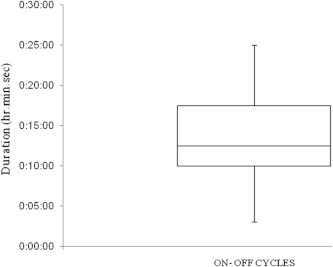
Statistics of the durations of full pumping cycles West of Golf pumping station.
Peak flow factors
Sewer flow varies with hour of the day, while the total daily flow varies with day of the year. Two peaking factors will be used to capture both variations: Phr-t-avghr to account for hourly variation within a given day and Pi-avg d to account for the variation in the daily flow within the year. Both factors may be combined to give peak flow factor (Pmax/min.t) as:
| (1) |
The Pmax/min hr-t-avghr is defined as:
| (2) |
where (Qmax/minhr.-t) = the average flow during a duration (t) hours when the sustained flow Q is either maximum or minimum. For every day of the record, Qmax/min hr.-t is calculated for all durations t = (1, 2, … , 24); Qavg-hr = the average hourly flow for that day of record.
The peaking factor given by Eq. (2) is calculated for every day of the record and for every duration t. For every duration (t), there will be peaking factors equal to the number of days (N) for which hourly flow record is available. All (N) peaking factors Pmax/min hr-t-avghr for the same (t) were sorted in an ascending order. Using Hazen plotting position, a factor with a rank (m) in the record is assigned a probability (p) of not being exceeded: p = (m − 0.5)/N. Hazen plotting position has been used to predict statistically because of the availability of moderate sample size (e.g., 208 days of measured hourly flows and about 1 year of measured total daily flows). As the sample size increases, the central tendency of the predicted values from regression line to deviate from the observed peaking factors is minimal for the period under consideration. In addition, the representation of the tails becomes poor. As a result, better estimation to standard deviation can be reached using Hazen plotting position.
The Pi-avg d is the factor that accounts for variation in daily flow (Qi) during day (i) of the record with respect to the average daily flow (Qavg-daily) of the record (N) as shown in the following equation:
| (3) |
The (N) values of the daily peaking factor (Pi-avg d) were sorted in an ascending order. A factor with a rank (m) in the record is assigned a probability (p) of not being exceeded: p = (m − 0.5)/N. Several probability distributions were applied to the three-flow variation factors give by Eqs. (1)–(3), and the Gumbel probability distribution was found to be the one that best fits the records. Generally, the maximum (or the minimum) of a number of samples of various distributions are modeled using Gumbel distribution. For the data analyzed for WG, such a distribution achieves the best fit that can represent the distribution of the maximum or minimum flow factor in a particular year if there is a list of maximum values for several days. The goodness of fit is tested using Kolmogorov–Smirnov test statistic of the Gumbel distribution. Table 2 summarizes the test statistic and the P value for the hourly, 4 h, 8 h, 12 h, and daily flow factors, respectively.
Table 2.
Summary of Kolmogorov–Smirnov goodness of fit test.
| Flow factors |
|||||
|---|---|---|---|---|---|
| 1 h | 4 h | 8 h | 12 h | Daily | |
| Test statistic | 0.061 | 0.049 | 0.042 | 0.04 | 0.093 |
| P value | 0.318 | 0.416 | 0.531 | 0.667 | 0.227 |
Figs. 4 and 5 describe the Gumbel distribution fit for selected maximum hourly and daily flow factors for West of Golf, respectively.
Fig. 4.

Probability of non-exceedance of the given peak flow factors for a duration of t-hours for WG sewage flows.
Fig. 5.
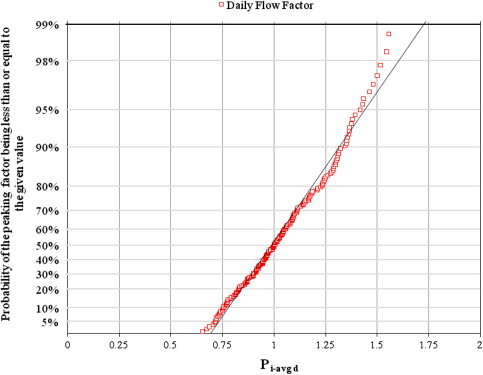
Probability of non-exceedance of the given peak daily flow factor (Pi-avgd) for WG sewage flows.
Estimation of the extreme combined peak flow factors was based on the assumption that the proposed sewerage system will receive same peak hourly to average hourly flow ratio on the peak flow day and same low hourly to average hourly ratio on the low flow day.
Results and discussion
Pump and sewer flow factors
The flow record for WG community comprised of 208 days of measured hourly flows and about 1 year of measured total daily flows. Analyses of data collected from WG pumping station were carried out to estimate 1 h, 2 h … -24 h for the incoming and pumped sewage flow. Fig. 6 gives the peak flow factor Pmax.t-hr-avg. d of the pumped and sewer flows for a 99% probability of non-exceedance. The peak factor for the maximum instantaneous flow (t = 0) for the pumped flow is higher than the factor for the maximum sewer flow because of the over-sized pumps during the early stage of community development.
Fig. 6.

Sewer and pumped peak flow factors with probability 99% probability of non-exceedance.
Extreme design hourly flow factors
The extreme sewer flow factors for selected probabilities for WG are shown in Fig. 7. The 99% 1-h sustained peak flow factor is 4.35 which means that the trunk sewer, treatment plant, or pump station will receive this value or less at probability equal to 99%. On the other hand, the 99% 1-h sustained low flow factor is 0.25 which means that the trunk sewer, treatment plant, or pump station will receive this value or more at probability equal to 99%. Values calculated from the derived extreme peaking factors and by different methods for different time setups are plotted on the same figure. It can be noted that values calculated from Babbit and Baumann and Harmon equations are within the envelope of probability curves between 50% and 95%. Values calculated from Muksgaard and Young 1980 are much higher than the derived values for all communities. This may be due to the arid communities’ characteristics in this study and the different characteristics of the communities studied by Muksgaard and Young 1980.
Fig. 7.

Maximum and minimum flow factors for WG for sustained durations of t-hours and selected non-exceedance probability.
Design daily flow factors
Fig. 8 gives the results of design peak and low flow factors that are sustained for a given number of days for a probability non-exceedance of 99% for WG. This graph is based on 1 year of consecutive daily flow monitoring. These daily flow factors for durations more than 1 day are in the design and operation of certain types of plants or components such as the sludge drying beds.
Fig. 8.
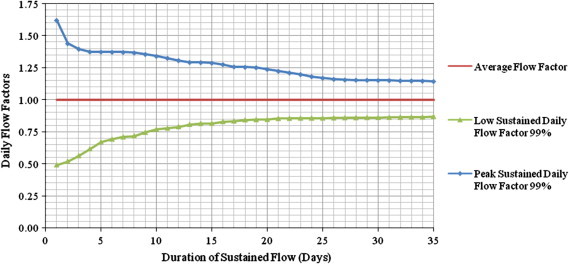
Design peak and low daily flow factors for probability equal to 99% for WG.
Effectiveness of using probability and sustained durations in estimating design peaking factors
Fig. 7 shows that the peak 1 h-flow factor for a probability of non-exceedance of 99% is 4.45, while that for a 95% probability is 3.3; i.e., units based on the higher probability will be sized for a higher flow by nearly one third.
Therefore, the designer may opt to design the various plant components using different probabilities of non-exceedance to optimize on the size of the units. The main criterion for selecting the probability would be the consequences of subjecting the treatment unit to a higher flow, and the possibility of the entire plant not meeting its effluent standards.
In addition to estimating certain probability, different plant components should be designed according to their critical peak conditions. In Figs. 7 and 8, the peak flow factors decrease as their sustained durations increase. Consequently, the use of the widely used instantaneous or hourly peaking factors in all treatment components is not the optimum factor. Pumps, screens, and grit chambers should be designed based on the extreme instantaneous peaking factor. Other units should be designed, so that it can handle the flow within the average of its acceptable limits of behavior. Units can typically tolerate some flow variations occurring during their hydraulic residence or retention times.
Conclusions
A case study of West of Golf residential community has been investigated to derive probability based design maximum and minimum flow factors for the design of the sewerage system and the different components of the wastewater treatment plant. These flow factors are related to the duration during which these flows will be sustained and to the probability that they are not exceeded. Each wastewater component of the wastewater sewerage system should be designed with its own flow factor based on its acceptable limits of behavior. For small communities, the sizing and operation of the pumping station accentuate the sewer hydraulic and results in a pulse-like pumped flow hydrograph that should be the basis for the design of the treatment plant.
Conflict of interest
The authors have declared no conflict of interests.
Compliance with Ethics Requirements
This article does not contain any studies with human or animal subjects.
Footnotes
Peer review under responsibility of Cairo University

References
- 1.Environmental Protection Agency (EPA). Process design manual: wastewater treatment facilities for sewered small communities. Cincinnati, Ohio: EPA; 1977.
- 2.Butler D., Graham N. Modeling dry weather wastewater flow in sewer networks. J Environ Eng, ASCE. 1995;121(2):161–173. [Google Scholar]
- 3.Babbitt H., Baumann E. John Willey and Sons; New York: 1958. Sewerage and sewage treatment. [Google Scholar]
- 4.Alberta Environment. Environmental Assurance Division. Environmental Policy Branch. Drinking Water Branch. Alberta Environmental Protection Standards and Guidelines. Edmonton: Alberta Environment; 2006.
- 5.Munksgaard D., Young J. Flow and load variations at wastewater treatment plants. Water Pollut Control Federation, WPCF. 1980;52(8):2131–2144. [Google Scholar]
- 6.Gaines J. Peak sewage flow rates prediction and probability. Water Pollut Control Federation, WPCF. 1989;61(7):1241–1248. [Google Scholar]
- 7.Zhang X, Buchberger S, Van Zyl J. A theoretical explanation for peaking factors. In: Walton R, editor. ASCE EWRI conferences, Anchorage, Alaska, USA; May 15–19, 2005.
- 8.Elnakar H. LAP LAMBERT Academic Publishing; Germany: 2012. Socioeconomic based design flow factors for small sewerage systems: flow factors generated from synthetic socioeconomic uses of water fixtures and appliances. Rev. by Imam I. [Google Scholar]
- 9.Metcalf L., Eddy H. McGraw-Hill; New York: 1979. (Wastewater Engineering. Treatment, Disposal, Reuse). Rev. by Tchobanoglous G. [Google Scholar]
- 10.Young J., Baumann E., Cleasby J. Flow and load variations in treatment plant design. J Environ Eng, ASCE. 1978;104(2):289–303. [Google Scholar]