
Figure 6. Immunohistochemical (IHC) staining of Lon protein in bladder cancer tissues and Kaplan–Meier overall survival curve of bladder cancer patients according to Lon expression.
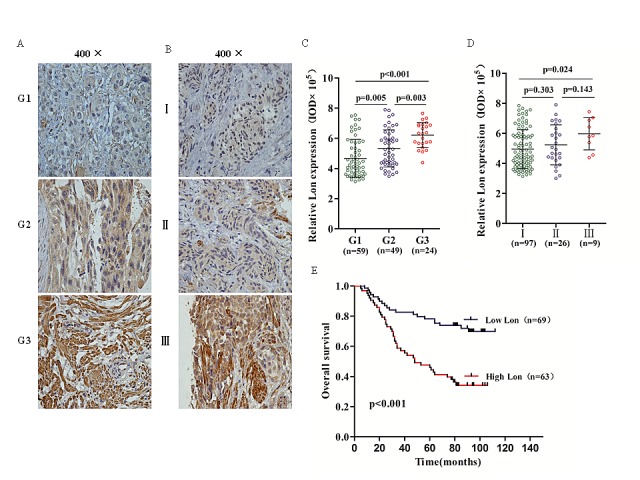
(A & B) Representative Lon IHC staining photomicrographs (400×) of Grade 1, Grade 2 and Grade 3 bladder cancer tissues (A) and TNM stage I, II and III bladder cancer tissues (B). (C & D) Quantitative IHC results of Lon expression in different tumor grade (C) and different TNM stage (D). (E) The Kaplan-Meier overall survival curve of bladder cancer patients (n=132) according to Lon protein expression (p<0.001).