

Abstract
This study was to investigate the influence of age on the expression of organic cation transporters (OCTs) that belong to the SLC22 family in brain microvessels (BMVs) and its implications for 1-methyl-4-phenyl-1,2,3,6-tetrahydropyridine (MPTP)-induced dopaminergic toxicity in mice. Here, we showed that Oct1 and Oct2, but not Oct3, mRNAs were detected and enriched (compared with cerebral cortex) in BMVs of C57BL/6 (B6) mice using reverse transcription-quantitative PCR (RT-qPCR), and immunofluorescence analysis further revealed that Oct1 and Oct2 proteins were colocalized with endothelial markers. Both the mRNA and protein levels of Oct1 and Oct2 were reduced in aged mice. After an intraperitoneal administration of MPTP, brain extracellular levels of MPTP and 1-methyl-4-phenyl-pyridinium (MPP+) were much lower in aged mice and in Oct1/2−/− mice compared with younger mice and wild-type control mice, respectively. Knockout of Oct1/Oct2 protected Oct1/2−/− mice from MPTP-induced neurotoxicity, whereas the loss of tyrosine hydroxylase (TH)-positive neurons was slightly greater in aged than in younger mice. However, intrastriatal infusion of low-dose MPTP caused more severe dopaminergic toxicity in the substantia nigra of both aged mice and Oct1/2−/− mice. These findings show that age-dependent downregulation or knockout of Oct1/Oct2 in BMVs may reduce the transport of MPTP, which, in part, affects its dopaminergic toxicity.
Keywords: blood–brain barrier, MPTP, organic cation transporters
Introduction
Organic cation transporters (OCTs) that belong to the SLC22 family are uniporters that mediate the facilitated bidirectional transport of cationic substances, including exogenous neurotoxins, 1-methyl-4-phenyl-1,2,3,6-tetrahydropyridine (MPTP) and its active metabolite, 1-methyl-4-phenyl-pyridinium (MPP+),1,2 and the endogenous neurotoxin, salsolinol.3 Previously, it has been shown that blood–brain barrier (BBB) transfer of MPTP and MPTP-induced dopaminergic toxicity can be reduced by amantadine, a substrate of Oct1 and Oct2, in rodents.4 Because the BBB is an important interface that is responsible for exchange between the blood and brain compartments, the transport of neurotoxins across the BBB controls their levels in the brain and their subsequent dopaminergic toxicity. Additionally, the relationship between the expression of OCTs at the BBB and the toxicity of these neurotoxins is an important consideration.
Previous findings regarding the expression of OCTs at the BBB are controversial, and the results appear to be dependent on experimental models. To date, most studies have been conducted in immortalized cell lines: human OCT1 (hOCT1) mRNA and protein were identified in the human brain endothelial cell line hCMEC/D3, whereas hOCT2 expression was undetectable;5 northern blotting and RT-PCR showed that rat Oct1 (rOct1), but not rOct2 or rOct3, was expressed in the rat brain microvessel (BMV) endothelial cell line RBE4;6 low levels of rOct1-3 mRNA were detected in the rat brain capillary endothelial cell line TR-BBB13;7 and mouse Oct2 (mOct2), but not mOct1, mRNA was identified in the mouse BMV endothelial cell line MBEC4.8 In addition to these findings in cell lines, the expression of OCTs has been investigated in BMV endothelial cells isolated from humans, rats (Wistar rats), and mice (C57BL/6 (B6) mice). The results showed that both OCT1 and OCT2 proteins are expressed in the BMV endothelial cells of these species.4 A recent study also showed that mRNAs of OCT1, OCT2, and OCT3 were detected in isolated human BMVs.9 In contrast, except for a negligible level of Oct3 mRNA, none of the Oct1 and Oct2 mRNAs were identified in BMVs collected from Swiss mice.10
In this study, we first measured the expression of Oct1-3 in BMVs isolated from mice of different strains (B6 and Swiss mice). Expression of Oct1 and Oct2 was further examined in isolated BMVs and the whole brain of B6 mice of different ages to explore whether the expression of these transporters was altered during aging. Additionally, the BBB transport and the dopaminergic toxicity of MPTP were investigated in B6 mice of different ages and in Oct1/Oct2 double knockout (Oct1/2−/−) mice. Finally, MDCK cells expressing human OCT1/OCT2 (MDCK-hOCT1 and MDCK-hOCT2) were established to investigate the interaction between OCT1/OCT2 and the endogenous neurotoxins 1-benzyl-tetrahydroisoquinoline and N-methyl-(R)salsolinol, which are structurally similar to MPTP.
Materials and methods
Animals
Male C57BL/6 (B6) mice were obtained from the National Laboratory Animal Center of Taiwan. Male Swiss (Swiss Webster; CFW) mice were purchased from Charles River Laboratory (Charles River, MA, USA). Male Oct1/Oct2 double knockout (Oct1/2−/−) mice (FVB.129P2-Slc22a1tm1Ahs Slc22a2tm1Ahs N7) and wild-type (WT) FVB mice (from which Oct1/2−/− mice were originally derived) were obtained from Taconic (Germantown, NY, USA). All animal treatments were approved by the Institutional Laboratory Animal Care Committee of the College of Medicine, National Taiwan University, and met the requirements of the Animal Welfare Protection Act of the Department of Agriculture, Executive Yuan, Taiwan. All studies involving animals are reported in accordance with the ARRIVE (Animal Research: Reporting In Vivo Experiments) guidelines.
Materials
cDNAs encoding hOCT1 and hOCT2 were purchased from OriGene Technologies, Inc. (Rockville, MD, USA). The MDCK type 2 (MDCKII) cell line was kindly provided by the Netherlands Cancer Institute. 3H-MPP+ (82 Ci/mmol) was purchased from Perkin-Elmer Life Sciences Inc. (Boston, MA, USA), MPP+ and N-methyl-(R)salsolinol (N-methyl-(R)SAL) from Sigma Chemical Co. (St Louis, MO, USA), and 1-benzyl-tetrahydroisoquinoine (1-benzyl-TIQ) from Matrix Scientific (Columbia, SC, USA). Fetal bovine serum was purchased from Hyclone (Logan, UT, USA) and minimum essential medium (MEM) from Gibco (Grand Island, NY, USA). Other chemicals were obtained from standard sources and were of the highest quality available.
mRNA and Protein Expression of Oct1-3 in Brain Microvessels Isolated from Mice
For the isolation of BMVs, all procedures were performed at 4°C. Animals were decapitated and their brains immediately removed and placed in ice-cold Hank's buffered salt solution (HBSS; 14065-056; Gibco), then the cerebellum, meninges, brainstem, and large superficial blood vessels were removed, and the remaining cortices were minced in 4 mL of ice-cold HBSS per gram of tissue. The cortices were then homogenized in a Glas-Col homogenizer (0.18 to 0.23 mm clearance) using 20 up-and-down strokes at 400 r.p.m., and the homogenate was centrifuged at 1,000 g for 10 minutes. The pellet was then suspended in 17.5% dextran (70 kDa, TCI, Tokyo, Japan) and centrifuged for 15 minutes at 4,400 g, and the resulting pellet was suspended in HBSS containing 1% bovine serum albumin (BSA) (Sigma, USA). The suspension was then passed through a 100-μm mesh nylon filter (BD Falcon, Durham, NC, USA), and the filtrate was passed through a 20 μm mesh nylon filter (Merck Millipore, Cork, Ireland). The BMVs retained on the filter were collected and suspended in ice-cold HBSS containing protease inhibitors (Roche Diagnostics, Indianapolis, IN, USA), and the expression of OCTs was measured by reverse transcription-quantitative PCR (RT-qPCR) and immunofluorescence (IF).
For RT-qPCR, total RNA was isolated from the cerebral cortex and BMVs in an ice bath by the acid phenol-guanidinium-chloroform method using a TRIzol reagent (Invitrogen, CA, USA). The quality of the isolated RNA was verified by the ratio of 28S and 18S ribosomal RNA bands on a 1% agarose gel. First-strand cDNA was synthesized from the total RNA (500 ng) using an oligo(dT)12-18 primer and the GoScript™ reverse transcription system (Promega, WI, USA) according to the manufacturer's protocol. Quantittive PCR was used for the quantification of Oct1, Oct2, Oct3, and Mdr1a mRNA levels, using Gapdh mRNA as the internal control. The cDNA (1 μL) was mixed with 4 μL of sterile deionized distilled water, 10 μL of Power SYBR Green PCR Master Mix (Applied Biosystems, Warrington, UK), and forward/reverse primers (250 nmol/L each; Supplementary Table 1). The program for PCR consisted of denaturation at 95°C for 10 minutes, followed by 40 amplification cycles of 95°C for 15 seconds, 56°C for 15 seconds, and 72°C for 45 seconds. The process and signal collection were performed on a qPCR system (ABI 7500, Applied Biosystems). Non-template controls and no reverse-transcriptase controls were used to verify the quality of each primer set and sample, respectively. Both controls produced undetectable signals (Ct>40). In addition, dissociation curve analysis was used to confirm the specificity of PCR products. The relative quantity of Oct1, Oct2, Oct3, and Mdr1 mRNA normalized to Gapdh mRNA was calculated by the comparative Ct (ΔCt) method. Both Ct and ΔCt values were determined by the ABI 7500 Software (Life Technologies, Carlsbad, CA, USA). ΔΔCt values were obtained by subtracting the ΔCt value of each BMVs from that of the cerebral cortex and the relative amount was determined by the formula: 2−ΔΔCt.
For IF, cerebral microvessels were spread on glass microscope slides and allowed to air dry for 15 minutes at room temperature (RT). Unless otherwise specified, all subsequent steps were also performed at RT. The slides were then fixed for 10 minutes with 3% formaldehyde/0.2% glutaraldehyde in phosphate-buffered saline (PBS) (137 mmol/L NaCl, 2.7 mmol/L KCl, 1.7 mmol/L KH2PO4, and 0.01 mmol/L Na2HPO4, pH7.4), washed for 3 × 5 minutes with PBS, permeabilized with 0.1% Triton X-100 (in PBS) for 30 minutes, washed in PBS for 3 × 5 minutes, and blocked in 1% BSA in PBS (PBS-BSA) for 30 minutes. They were then incubated for two nights at 4°C with a 1:100 dilution of rabbit anti-Oct1 (GeneTex, Irvine, CA, USA) or anti-Oct2 (Abcam, Cambridge, MA, USA) antibodies in PBS-BSA, or a goat anti-collagen IV antibody (1:50 dilution) (Millipore, Temecula, CA, USA) in PBS-BSA, rinsed for 3 × 5 minutes with PBS, and incubated for 1 hour at 37°C with a 1:200 dilution in PBS-BSA of rhodamine-conjugated AffiniPure donkey anti-rabbit IgG antibody (Jackson ImmunoResearch Laboratories, West Grove, PA, USA) and FITC-conjugated chicken anti-goat IgG antibody (Chemicon International, Temecula, CA, USA). The slides were then washed (3 × 5 minutes; PBS) and coverslipped with mounting medium, and images were acquired using a Zeiss AXIO Imager A1 fluorescence microscope (Carl Zeiss, Göttingen, Germany) with a × 40 objective. Images of vessels from different age groups were stained in parallel and collected using uniform instrument settings.
Expression of Oct1 and Oct2 in Isolated Brain Microvessels and Whole Brain of B6 Mice of Different Ages
To investigate whether aging affects Oct1-2 expression, total RNA was isolated from the whole brain, and RT-qPCR was performed to measure mRNA expression as described above. In addition, the Oct1 and Oct2 proteins were examined by IF (in isolated BMVs), western blotting (in the lysate of isolated BMVs), and immunohistochemistry (in brain slices).
For IF, the processing was performed according to the procedures described above. The intensity of fluorescence on BMVs was quantified by the ImageJ v1.47 software (National Institutes of Health, MD, USA). For western blotting, the isolated BMVs were lysed for 30 minutes at 4°C in lysis buffer (150 mmol/L Tris-HCl pH 7.4, 0.5% Triton X-100, 0.5% sodium deoxycholate and complete protease inhibitor cocktail; Roche Diagnostic), then the lysates were centrifuged at 10,000 g for 10 minutes at 4°C, and the supernatants were stored at −80°C until use. Protein samples were diluted with loading buffer (200 mmol/L Tris-HCl, 1.43% 2-mercaptoethanol, 8% sodium dodecyl sulfate, 0.4% bromophenol blue, and 40% glycerol) and heated at 98°C for 10 minutes, then the proteins (30 μg/lane) were separated by electrophoresis on an 8% sodium dodecyl sulfate-polyacrylamide gel in running buffer (0.3% Tris-HCl, 1.88% glycine, and 0.1% sodium dodecyl sulfate) and transferred onto a nitrocellulose membrane (Hybond-C Extra, Amersham Biosciences, Buckinghamshire, UK). Nonspecific binding to the membrane was blocked by incubation for 2 hours at RT with 5% skim milk in TNT buffer (10 mmol/L Tris-HCl, 150 mmol/L NaCl, and 0.2% Tween-20, pH 7.4), then the membrane was incubated overnight at 4°C with rabbit antibodies against mouse Oct1 (1:100 dilution; Santa Cruz Biotechnology, Santa Cruz, CA, USA) or Oct2 (1:200 dilution; Alpha Diagnostic, San Antonio, TX, USA), all diluted in 5% skim milk in TNT buffer. β-Actin, used as the loading control, was measured using rabbit anti-β-actin antibodies (1:500 dilution; Abcam, Cambridge, UK). The membrane was then washed and incubated for 1 hour at RT with a 1:1,000 dilution of horseradish peroxidase-conjugated anti-rabbit IgG antibodies (Cedarlane, Burlington, Ontario, Canada) in TNT buffer. Bound antibody was detected using Chemiluminescence reagent Plus (Perkin-Elmer Life Sciences) and a Kodak X-OMAT 2000 developing machine (Kodak GmbH, Stuttgart, Germany).
For immunohistochemical (IHC) analysis, brain sections were prepared following the methods described previously11 and were incubated for 1 hour at RT, then overnight at 4°C with rabbit antibodies against Oct1 (1:400 dilution; LifeSpan Biosciences, Seattle, WA, USA) and Oct2 (1:100 dilution; Alpha Diagnostic). The sections were then incubated for 1 hour at RT with biotinylated anti-rabbit IgG antibody (1:200 dilution in PBS; Vector Laboratories, Burlingame, CA, USA), followed by a 30-minute incubation at RT with the avidin-biotin complex (1:1:100 in PBS; Vector Laboratories) and 3,3'-diaminobenzidine (Sigma-Aldrich, St Louis, MO, USA). After dehydration, the sections were mounted for light microscopy. Semi-quantitative analysis of the expression of Oct1 and Oct2 was performed using the H-score as described previously.12 In brief, the intensity of IHC staining was scored as follows: 0 (no staining), 1 (weak staining), 2 (moderate staining), and 3 (intense staining). For each specimen, the score was calculated using the formula: H-SCORE=P(i+1), where i represents the intensity score and P the corresponding percentage of BMVs.
In Vivo Brain Microdialysis Study in Mice
The in vivo brain microdialysis experiments were conducted in male B6 mice at 2 months and 15 months of age or in 2-month-old male Swiss mice, Oct1/2−/− mice, and WT FVB mice according to the methods described previously.4 In brief, the dialysis probe (CMA Microbiotech, Solna, Stockholm, Sweden) was implanted into the right striatum of each mouse at the following coordinates: A-P +0.6 mm and M-L −1.6 mm from the bregma and D-V −4 mm below the dura. 1-Methyl-4-phenyl-1,2,3,6-tetrahydropyridine (15 mg/kg), dissolved in Ringer's solution (147 mmol/L NaCl, 4 mmol/L KCl, and 2.3 mmol/L CaCl2, pH 7.4), was injected intraperitoneally. The probe was perfused with extracellular fluid (ECF) (122 mmol/L NaCl, 3 mmol/L KCl, 25 mmol/L NaHCO3, 1.2 mmol/L MgSO4, 0.4 mmol/L K2HPO4, 1.4 mmol/L CaCl2, 10 mmol/L D-glucose, and 10 mmol/L HEPES, pH 7.4) at a flow rate of 1.5 μL/min using a CMA/102 microdialysis pump, and brain dialysate was collected every 30 minutes for 240 minutes. The concentrations of MPTP and MPP+ were analyzed by an HPLC (high performance liquid chromatography) method, as described previously.4
Measurement of 1-Methyl-4-Phenyl-1,2,3,6-Tetrahydropyridine and 1-Methyl-4-Phenyl-Pyridinium Concentrations in the Plasma
Blood samples were collected at 15, 30, 60, 120, 180, and 240 minutes after an intraperitoneal injection of 15 mg/kg MPTP. After centrifugation (1,169 g for 10 minutes at 4°C), each plasma sample was extracted with 50 μL of acetonitrile and then centrifuged at 14,000 g for 5 minutes. An aliquot of 20 μL supernatant was injected into an HPLC system and analyzed as described previously.4
Dopaminergic Toxicity of 1-Methyl-4-Phenyl-1,2,3,6-Tetrahydropyridine in Aged Mice and in Oct1/2 −/− Mice
To examine the role of Oct1-2 in MPTP-induced dopaminergic toxicity, male B6 mice at 2 and 15 months of age or 2-month-old male Oct1/2−/− and WT FVB mice received peripheral or central administrations of MPTP. For peripheral administration, mice received 15 mg/kg MPTP (intraperitoneal) once daily for 3 days and then were killed 2 days later. For central administration, mice received intrastriatal infusions for 7 days of 36 μmol/L MPTP (young and aged B6 mice) or 50 μmol/L MPTP (Oct1/2−/− and WT FVB mice) in Ringer's solution or vehicle alone, using osmotic minipumps and brain infusion kits (Alzet, Cupertino, CA, USA); the latter were stereotaxically implanted into the right side of the striatum at the coordinates: A-P +0.6 mm and M-L −1.6 mm from the bregma. Tyrosine hydroxylase (TH) in nigral brain sections from each mouse was stained to visualize dopaminergic neurons in the substantia nigra pars compacta (SNpc) by immunohistochemistry. Brain sections were incubated for 1 hour at RT and overnight at 4°C with rabbit antibodies against TH (1:1,000 dilution in PBS; Abcam, Cambridge, UK) and the processing was performed following the procedures described above. To determine dopaminergic toxicity, the number of TH-positive cells in every tenth section from the anterior to the posterior extent of the SNpc was counted by the investigator with the aid of ImageJ. The boundary between the SNpc and the adjacent area was defined using the mouse brain atlas. The results were presented as the average number of TH-positive cells in each SNpc as described previously.13
1-Methyl-4-Phenyl-Pyridinium Uptake and Its Interaction with N-methyl-(R)SAL and 1-Benzyl-Tetrahydroisoquinoine in MDCK-hOCT1 and MDCK-hOCT2 cells
hOCT1 and hOCT2 cDNAs were transfected into MDCKII cells by liposome-mediated transfection (Lipofectamine 2000, Invitrogen, Grand Island, NY, USA) according to the manufacturer's protocol, and the stably transfected cell lines MDCK-hOCT1 and MDCK-hOCT2 were obtained by G418 selection and maintained in MEM supplemented with 0.11 g/L of sodium pyruvate, 1.5 g/L of sodium bicarbonate, 1% antibiotics (10,000 U/mL of penicillin, 10 mg/mL of streptomycin, and 25 μg/mL amphotericin B), and 10% fetal bovine serum, as described previously.14
To measure MPP+ uptake, MDCK-hOCT1 and MDCK-hOCT2 cells (1 × 10⁴ cells/cm2) were grown on 24-well plates and used for experiments 2 days after subculturing. To measure the time dependency of MPP+ uptake, MDCK-hOCT1 and MDCK-hOCT2 cells were incubated with 0.5 mL of ECF buffer, pH 7.4, containing 20 nmol/L 3H-MPP+ for 1 to 30 minutes. To estimate the kinetic properties, MDCK-hOCT1 and MDCK-hOCT2 cells were incubated for 1 minute with 0.2 mL of ECF buffer, pH 7.4, containing 0.05 μmol/L 3H-MPP+ adjusted with unlabeled MPP+ to final concentrations of 1 to 90 μmol/L MPP+, then all cells were washed with 0.5 mL of ice-cold ECF buffer, solubilized in 0.5 mL of 1% Triton X-100, and the solution was transferred to a vial containing 5 mL of Ready Protein (Beckman Coulter, Brea, CA USA). Radioactivity was measured by liquid scintillation counting using an external standard method for quench correction. The protein content of the cells was determined using the Bio-Rad DC protein assay kit (Bio-Rad, Hercules, CA, USA) with BSA as the standard.
To measure the interaction between MPP+ and N-methyl-(R)SAL or 1-benzyl-TIQ, MDCK-hOCT1 or MDCK-hOCT2 cells were incubated for 1 minute with 0.2 mL of ECF buffer, pH 7.4, containing 0.05 μmol/L 3H-MPP+ adjusted with unlabeled MPP+ to final concentrations of 1 to 90 μmol/L and 0.1 mmol/L N-methyl-(R)SAL or 1-benzyl-TIQ (0.05 mmol/L for OCT1; 0.1 mmol/L for OCT2). The cells were then washed 3 × with 0.5 mL of ice-cold ECF buffer, solubilized overnight at RT in 0.5 mL of 1% Triton X-100, and the released radioactive material and protein content was measured as described above.
The uptake data were analyzed using a nonlinear regression model as follows:
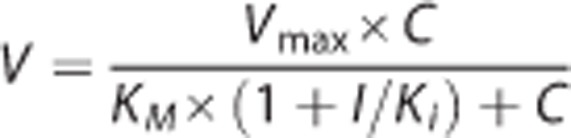
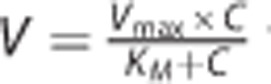 with or without a non-saturable component, K × C, where V represents the rate of substrate uptake; Vmax, the maximum uptake rate; C, the substrate concentration; KM, the Michaelis constant; and K, the first order constant. A suitable model for data interpretation was selected on the basis of the goodness of fit evaluated by Model Selection Criteria, the coefficient of determination, and the standard deviation for the parameter estimated. Nonlinear regression analyses were performed using Scientist v2.01 (MicroMath Scientific Software, Salt Lake City, UT, USA). For competitive inhibition, the rate of substrate uptake can be expressed as:
 |
The double reciprocal equation for competitive inhibition can be arranged to that of the Lineweaver-Burk plot:
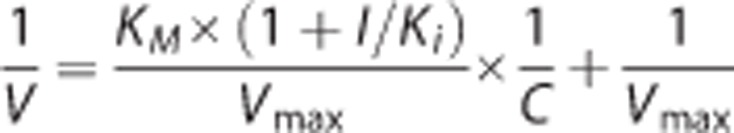 |
The inhibition constant (Ki) was estimated by plotting the slopes of the Lineweaver-Burk plot versus inhibitor concentrations (I), in which the x-intercept was equal to −Ki.
Uptake of N-methyl-(R)SAL and 1-Benzyl-Tetrahydroisoquinoine by MDCK-hOCT1 and MDCK-hOCT2 Cells
MDCK-hOCT1 and MDCK-hOCT2 cells (1 × 10⁴ cells/cm2) were grown on 12-well plates and were used for experiments 2 days after subculturing. To estimate the kinetic properties, MDCK-hOCT1 and MDCK-hOCT2 cells were incubated for 1 minute with 0.5 mL of ECF buffer, pH 7.4, containing either 20 to 1,000 μmol/L N-methyl-(R)SAL or 2 to 200 μmol/L 1-benzyl-TIQ. All cells were then washed with 1 mL of ice-cold ECF buffer, lysed with 0.5 mL of 4 mmol/L perchloric acid, and the amount of 1-benzyl-TIQ and N-methyl-(R)SAL in the lysates was measured by LC-MS-MS. The protein content was determined as described above.
Chromatographic separations were performed on a BEH C18 (1.7 μm, 50 × 2.1 mm; Waters, Dublin, Ireland) UPLC column by isocratic elution using 0.1% aqueous formic acid and acetonitrile as the solvent system. For quantification of N-methyl-(R)SAL, the multiple reaction monitoring transitions of a precursor ion [M+H]+ into a specific fragment ion were recorded in the positive ESI mode at 20 V cone energy and 20 eV collision energy. To quantify 1-benzyl-TIQ, the same method was used, except that the cone energy was 30 V. External calibration curves were prepared by linear regression using serial dilutions of the analyte in 4 mmol/L HClO4. The compound-specific multiple reaction monitoring transitions analyzed were N-methyl-(R)SAL, m/z 194→151; 1-benzyl-TIQ, m/z 224→129.1. Kinetic analysis of uptake data was performed as described above.
Statistical Analysis
Statistical differences were evaluated by Student's t-test or the analysis of variance, with a level of significance of 0.05. Pairwise comparisons between groups were made using the Bonferroni test. All analyses were performed using SYSTAT v10 (Systat, Inc., Evanston, IL, USA).
Results
Expression of Oct1-3 in Brain Microvessels of B6 and Swiss Mice
To investigate expression of OCTs in BMVs, mRNA levels of Oct1, Oct2, Oct3, and Mdr1 in BMVs and cerebral cortex were measured by RT-qPCR. As shown in Table 1, Mdr1 mRNA was detected in the BMVs of both B6 and Swiss mice, and the levels were approximately 12- and 7-fold higher, respectively, in BMVs relative to cerebral cortex samples, indicating an enriched expression of Mdr1 in BMVs. Oct1 and Oct2 mRNAs were also detected in isolated BMVs from B6 mice. The Oct1 mRNA level was approximately 6-fold higher in BMVs than in cerebral cortex, whereas Oct2 expression was comparable between BMVs and cerebral cortex. However, Oct1 and Oct2 mRNAs were negligible (Ct>36) in BMVs isolated from Swiss mice. Although Oct3 mRNA was detected in BMVs from B6 and Swiss mice, the relative mRNA levels in BMVs, compared with those in cerebral cortex, were 0.05±0.04 and 0.18±0.14 in B6 and Swiss mice, respectively. Therefore, Oct1 and Oct2, but not Oct3, proteins were examined in BMVs by IF staining. The results showed that both Oct1 and Oct2 proteins were colocalized with the endothelial markers, collagen IV (Figure 1), Mdr1 (Supplementary Figure 1) and CD31 (Supplementary Figure 2), in isolated BMVs, confirming the expression of Oct1 and Oct2 proteins in the BBB.
Table 1. Quantitative RT-PCR data showing the relative expression of Oct1, Oct2, Oct3, and Mdr1 mRNAs in brain microvessels (BMVs) compared with levels in cerebral cortex samples of C57BL/6 (B6) and Swiss mice.
| Oct1 | Oct2 | Oct3 | Mdr1 | |
|---|---|---|---|---|
| BMVs | ||||
| B6 | 6.36±2.07 | 1.05±0.17 | 0.05±0.04 | 11.74±1.75 |
| Swiss | NL | NL | 0.18±0.14 | 6.69±1.37 |
| Cortex | ||||
| B6 | 1.15±0.35 | 1.11±0.52 | 1.06±0.49 | 1.02±0.23 |
| Swiss | 1.18±0.44 | 1.00±0.1 | 1.12±0.31 | 1.17±0.46 |
BMVs, brain microvessels; NL, negligible levels (Ct>36).
Relative expression was calculated by 2−ΔΔCt. ΔΔCt values were obtained by subtracting the ΔCt value of each BMVs from that of cerebral cortex, in which ΔCt is the relative quantity of Oct1, Oct2, Oct3, and Mdr1 mRNA normalized to Gapdh mRNA.
Data are given as mean±s.d. of three different preparations, each in duplicate.
Figure 1.

Immunofluorescence staining of collagen IV (green), Oct1 (red), and Oct2 (red) in brain microvessels (BMVs) isolated from male B6 mice. (A–C) Protein expression of collagen IV (A), Oct1 (B), and colocalization of collagen IV and Oct1 (C). (D–F) Protein expression of collagen IV (D), Oct2 (E), and colocalization of collagen IV and Oct2 (F). (G–I) Controls with primary anti-Oct antibodies omitted are also shown. BMVs stained with collagen IV (G) and secondary (anti-rabbit) antibodies without (H) or with (I) costaining of collagen IV. Scale bars=10 μm.
Effect of Aging on Oct1 and Oct2 Expression in the Brain and Brain Microvessels of B6 Mice
To investigate whether the expression of OCTs changes during aging, we examined Oct1 and Oct2 mRNA levels in the whole brain of male B6 mice aged 2, 6, 15, and 24 months. The results showed that, compared with levels at 2 months, Oct1 mRNA levels showed significant reductions of 30% at 6 months and 75% to 90% at 15 and 24 months (Figure 2A, left panel), while mRNA levels for Oct2 showed a significant decrease of approximately 50% to 60% at 24 months (Figure 2A, right panel). In addition, levels of Oct1 and Oct2 proteins were examined in lysates of BMVs from male B6 mice aged 2 and 15 months by western blotting. As shown in Figure 2B, Oct1 and Oct2 levels decreased by approximately 39% and 18%, respectively, in 15-month-old mice, compared with mice at 2 months of age. Immunofluorescence data showed that Oct1 and Oct2 protein levels in BMVs of aged B6 mice (at 15 months of age) decreased by approximately 44% and 52%, respectively, compared with mice at 2 months of age (Figures 2C and 2D), corroborating the results of western blot analyses. Likewise, in IHC analysis, both Oct1 (Figures 2E and 2F) and Oct2 (Figures 2G and 2H) can be detected in the BMVs of striatum and cortex, and both are lower in mice at 15 months than at 2 months of age. For Oct1 on striatal microvessels, H-score values were 324±12 and 213±33 in mice at 2 and 15 months of age, respectively; for Oct1 on cortical microvessels, H-score values were 314±9 and 200±6 in mice at 2 and 15 months of age, respectively. Also, for Oct2 on striatal microvessels, H-score values were 340±10 and 254±23 in mice at 2 and 15 months of age, respectively; for Oct2 on cortical microvessels, H-score values were 309±16 and 222±21 in mice at 2 and 15 months of age, respectively (all as mean±s.e.m.).
Figure 2.

Effects of aging on expression of Oct1 and Oct2 in the brain and brain microvessels of male B6 mice. (A) Quantification of mRNA levels for Oct1 (the left panel) and Oct2 (the right panel) in the brain of mice during aging (n=2 to 3). (B) Western blotting of Oct1 and Oct2 proteins in the lysate of brain microvessels isolated from mice of different ages (n=3). (C and D) Immunofluorescence (IF) staining of Oct1 and Oct2 proteins in the brain microvessels isolated from mice at different ages (n=3). (E and F) Immunohistochemical (IHC) analysis of Oct1 proteins in brain striatum and cortex of B6 mice at different ages (n=3). (G and H) IHC analysis of Oct2 proteins in brain striatum and cortex of B6 mice at different ages (n=3). Scale bars=50 μm. The quantification results are shown on the right hand side of IF and IHC figures (D, F, and H). The data are presented as the mean±s.e.m. and the asterisks indicate a P value of <0.05 compared with the results at 2 months.
Brain Extracellular Levels of 1-Methyl-4-Phenyl-1,2,3,6-Tetrahydropyridine and 1-Methyl-4-Phenyl-Pyridinium in B6 Mice, Swiss Mice, Oct1/2 −/− Mice, and Wild-Type FVB Mice
Because MPTP is a substrate of OCTs, the expression of Oct1 and Oct2 proteins can influence MPTP levels in the brain. Therefore, in vivo brain microdialysis studies were conducted to measure MPTP transport across the BBB in B6 mice at different ages, Swiss mice, Oct1/2−/− mice, and WT FVB mice. After an intraperitoneal administration of MPTP (15 mg/kg), brain extracellular levels of MPTP were higher in 2-month-old B6 mice than in Swiss mice at 2 months of age and in B6 mice at 15 months of age (Figure 3A). The areas under the time-concentration curve (AUC) in collection interval for MPTP were 142±2, 104±6, and 70±5 μg-min/mL in young B6 mice, Swiss mice, and aged B6 mice, respectively. Likewise, brain extracellular levels of MPP+ were also higher in young B6 mice than in Swiss mice and aged B6 mice (Figure 3B). The AUC values were 7±1, 4±0, and 3±1 μg-min/mL in young B6 mice, Swiss mice, and aged B6 mice, respectively. Thus, BBB transport of MPTP is not only different between B6 and Swiss mice, but also it is different between young and aged B6 mice. The role of Oct1/Oct2 in MPTP transport was further evaluated in Oct1/2−/− mice. After an intraperitoneal administration of MPTP, brain extracellular levels of both MPTP and MPP+ were higher in the age-matched WT FVB mice (AUC values were 126±6 and 8±0 μg-min/mL for MPTP and MPP+, respectively) than in Oct1/2−/− mice (AUC values were 87±8 and 4±1 μg-min/mL for MPTP and MPP+, respectively) (Figures 3C and 3D).
Figure 3.

Brain extracellular levels of 1-methyl-4-phenyl-1,2,3,6-tetrahydropyridine (MPTP) and 1-methyl-4-phenyl-pyridinium (MPP+) in male B6 mice, Swiss mice, wild-type (WT) FVB mice, and Oct1/2−/− mice after an intraperitoneal administration of MPTP (15 mg/kg). The results are shown for B6 mice at different ages (black and white circles for mice at 2 months and 15 months of age, respectively) and 2-month-old Swiss mice (black triangles) (A and B), and for WT FVB mice (black squares) and Oct1/2−/− mice (white squares) (C and D). The data are presented as the mean±s.e.m. for three experiments.
Plasma levels of 1-Methyl-4-Phenyl-1,2,3,6-Tetrahydropyridine and 1-Methyl-4-Phenyl-Pyridinium in B6 Mice, Oct1/2 −/− Mice, and Wild-type FVB Mice
After an intraperitoneal administration of 15 mg/kg MPTP, the AUC values in collection interval for MPTP and MPP+ in young B6 mice were 824±195 and 346±73 μg-min/mL, respectively, which were comparable to those in aged B6 mice (829±103 and 368±38 μg-min/mL for MPTP and MPP+, respectively). Likewise, plasma concentrations of both MPTP and MPP+ were not different between Oct1/2−/− mice and the aged-matched WT FVB mice (Supplementary Figure 3). Along with the data from in vivo brain microdialysis study, these data suggest that the change in brain extracellular levels of MPTP and MPP+ is through the differences in BBB transport of MPTP in these animals.
Dopaminergic Toxicity of 1-Methyl-4-Phenyl-1,2,3,6-Tetrahydropyridine in Senescent Mice and Oct1/2 −/− Mice
Given that OCTs are bidirectional uniporters, MPTP was applied to mice by peripheral (intraperitoneal) and central (intrastriatal) administrations to investigate MPTP-induced dopaminergic toxicity in B6 mice of different ages and in mice with or without the Oct1/Oct2 double knockout.
In mice of different ages, for peripheral administration, the dopaminergic neuron number in the substantia nigra (SN) was evaluated 2 days after three high-dose MPTP treatments (15 mg/kg; intraperitoneally, once daily for 3 days). The loss of TH-positive neurons was still slightly higher in aged mice than in younger mice despite the lower brain extracellular MPTP/MPP+ levels in aged mice (Figures 4A and 4B); for central administration, intrastriatal infusion of low-dose MPTP (2 ng/kg per minute for 7 days) reduced TH-positive dopaminergic neurons in the SN of both ages, but the effect was much greater in aged mice (Figures 4C and 4D). Without MPTP treatment, TH expression was comparable in the SN of young and aged mice, regardless of administration routes.
Figure 4.

Immunohistochemical (IHC) analysis of tyrosine hydroxylase (TH) levels in the substantia nigra (SN) of male B6 mice, wild-type (WT) FVB mice and Oct1/2−/− mice when given 1-methyl-4-phenyl-1,2,3,6-tetrahydropyridine (MPTP) (15 mg/kg) or Ringer's solution (RS) by multiple intraperitoneal administrations (A and E) or infused intrastriatally for 7 days with MPTP or RS (C and G). The results are shown for young mice (2 months old) and aged mice (15 months old) (A and C) and for WT mice and Oct1/2−/−mice (E and G). Scale bars=300 μm. Average numbers of TH-positive cells from the anterior to the posterior extent of the SN are shown on the right-hand side of IHC figures (B, D, F, and H). The data are presented as the mean±s.e.m. aP<0.05 compared with vehicle-treated controls and bP<0.05 compared with MPTP-treated mice (young or WT mice).
To confirm the role of OCTs in MPTP-induced dopaminergic toxicity, MPTP was administered to 2-month-old Oct1/2−/− mice and WT-FVB mice. After multiple intraperitoneal administrations, no significant difference in the number of TH-positive neurons was observed between vehicle-treated Oct1/2−/− and WT-FVB mice. The MPTP treatment caused TH-positive neuronal loss in WT-FVB mice, whereas the knockout of Oct1 and Oct2 protected Oct1/2−/− mice from MPTP-induced neurotoxicity (Figures 4E and 4F). However, after intrastriatal infusion, no significant difference in the number of TH-positive cells was observed between vehicle-treated Oct1/2−/− and WT mice, whereas intrastriatal MPTP infusion caused a severe loss of dopaminergic neurons in the SN of Oct1/2−/− mice, but not in the WT controls (Figures 4G and 4H).
Uptake of N-methyl-(R)SAL and 1-Benzyl-Tetrahydroisoquinoine by MDCK-hOCT1 and MDCK-hOCT2 Cells
To examine whether human OCT1 and OCT2 also interact with the endogenous neurotoxins N-methyl-(R)SAL and 1-benzyl-TIQ, MDCK cells that express OCT1 (MDCK-hOCT1) and OCT2 (MDCK-hOCT2) were established (Supplementary Figure 4) and cellular uptake of MPP+, a commonly used substrate of OCTs, was measured with or without the presence of N-methyl-(R)SAL or 1-benzyl-TIQ. Without N-methyl-(R)SAL or 1-benzyl-TIQ, the KM and Vmax values for MPP+ uptake were 7±2 μmol/L and 1,021±112 pmol/mg per minute, respectively, in MDCK-hOCT1 cells, and the corresponding values were 5±1 μmol/L and 296±35 pmol/mg per minute in MDCK-hOCT2 cells (Supplementary Table 2). Both N-methyl-(R)SAL (Figures 5A and 5B) and 1-benzyl-TIQ (Figures 5C and 5D) competitively inhibited MPP+ uptake by MDCK-hOCT1 and MDCK-hOCT2 cells. For N-methyl-(R)SAL, the values of the inhibitory constant Ki were 46 and 186 μmol/L, respectively, for MPP+ uptake by MDCK-hOCT1 and MDCK-hOCT2 cells. For 1-benzyl-TIQ, the corresponding Ki values for MPP+ uptake were 41 and 18 μmol/L, respectively, showing that 1-benzyl-TIQ is a more potent inhibitor of MPP+ uptake by hOCT2 cells.
Figure 5.

1-Methyl-4-Phenyl-Pyridinium (MPP+) uptake by control and transfected cells. (A and B) Effect of N-methyl-(R)SAL on MPP+ uptake by (A) MDCK-hOCT1 cells and (B) MDCK-hOCT2 cells in the absence (black circles) or presence (white circles) of the indicated concentrations of N-methyl-(R)SAL. (C and D) Effect of 1-benzyl-TIQ on MPP+ uptake by (C) MDCK-hOCT1 cells and (D) MDCK-hOCT2 cells in the absence (black circles) or presence (white circles) of the indicated concentrations of 1-benzyl-TIQ. Each plot was generated from the mean value of the individually fitted parameters. The data are presented as the mean±s.e.m. for three experiments, each in triplicate.
Because N-methyl-(R)SAL and 1-benzyl-TIQ competed with MPP+ for uptake by hOCT1 and hOCT2 cells, we then examined whether these neurotoxins were substrates of the OCTs by measuring their uptake by these cells and calculating the kinetic properties. The results showed that uptake of N-methyl-(R)SAL (Figures 6A and 6B) and 1-benzyl-TIQ (Figures 6C and 6D) by these cells was saturable. For N-methyl-(R)SAL uptake, the KM and Vmax values were 572±165 μmol/L and 10,270±1,512 pmol/mg per minute, respectively, for MDCK-hOCT1 cells and 202±90 μmol/L and 6,983±1,516 pmol/mg per minute, respectively, for MDCK-hOCT2 cells. For 1-benyzl-TIQ uptake, the KM and Vmax values were 20±7 μmol/L and 4,041±843 pmol/mg per minute, respectively, for MDCK-hOCT1 cells, and the corresponding values were 13±1 μmol/L and 2817±561 pmol/mg per minute, respectively, for MDCK-hOCT2 cells. The KM values for 1-benzyl-TIQ uptake by MDCK-hOCT1 and MDCK-OCT2 cells were comparable to the Ki values for MPP+ uptake by these clones. Likewise, the KM value for N-methyl-(R)SAL uptake by MDCK-hOCT2 cells was similar to the Ki value for MPP+ uptake. The Vmax/KM ratios for uptake of 1-benzyl-TIQ by MDCK-hOCT1 and MDCK-hOCT2 cells were comparable. The Vmax/KM ratios for uptake of N-methyl-(R)SAL by hOCT1 and hOCT2 were also comparable, and both were much lower than the corresponding value for 1-benzyl-TIQ.
Figure 6.

(A and B) Concentration-dependent uptake of N-methyl-(R)SAL by MDCK-hOCT1 cells in the range 62.5 to 1,000 μmol/L (A) and MDCK-hOCT2 cells in the range 20 to 500 μmol/L (B). (C and D) Concentration-dependent uptake of 1-benzyl-TIQ by MDCK-hOCT1 cells (C) and MDCK-hOCT2 cells (D) in the range 2 to 200 μmol/L. In (B, C, and D), uptake is presented as total uptake (white circles), with a saturable component (black circles) and a linear component (black triangles), while, in (A), there is no linear component. Each plot was generated from the mean value of the individually fitted parameters. The data are presented as the mean±s.e.m. for three experiments, each in triplicate.
Discussion
Exposure of humans to MPTP causes a syndrome that mimics the dopaminergic neurodegeneration of Parkinson's disease (PD). The MPTP and its active metabolite MPP+ were showed to be substrates of OCTs.1,2 In this study, we showed that Oct1 and Oct2 expression was decreased in BMVs of aged B6 mice. Reduced Oct1/Oct2 expression (in aged mice) or Oct1/Oct2 double knockout (in Oct1/2−/− mice) resulted in a significant reduction in brain extracellular levels of MPTP and MPP+ when MPTP was applied by an intraperitoneal route. Because chronic, but not acute, exposure to brain-derived endogenous neurotoxins has been suggested as a possible cause of PD, further studies using MPTP as a model compound showed that the dopaminergic toxicity caused by intrastriatal infusion of low-dose MPTP was greater in aged mice and in Oct1/2−/− mice, suggesting that decreased expression or knockout of Oct1/Oct2 reduces the BBB efflux of MPTP/MPP+ and makes mice more susceptible to MPTP-induced dopaminergic toxicity.
PD is an age-related disease. A number of cellular and molecular changes have been observed in aging, and the interaction of these changes with genetics, lifestyle, and environment may account for dopaminergic degeneration and the occurrence of PD.15 Loss of dopaminergic neurons has been reported in elderly humans without PD,16 however, this has been disputed.17 In the present study, TH expression in the striatum/SN was found to be comparable in young and aged mice that did not receive MPTP treatment. Corroboratively, others have reported that the number of dopaminergic cells remains almost constant in mice from 3 to 21 months of age.18 However, the susceptibility to MPTP-induced dopaminergic toxicity is age related. Age-related persistent activation of microglia has been observed in the SN of B6 mice receiving multiple intraperitoneal MPTP injections.19 Additionally, MPTP caused greater generation of reactive oxygen species in the nigrostriatal system of 12-month-old rather than 1-month-old B6 mice.20 On the other hand, MPP+ is accumulated in dopaminergic neurons via the dopamine transporter.21,22 However, our preliminary results showed that dopamine transporter mRNA levels are not changed in the brain of aged B6 mice (data not shown), whereas other authors found that dopamine transporter function and expression decrease in aged rats.23 In either case (i.e., either unchanged or decreased expression with age), MPP+ uptake via dopamine transporter will not increase with age.
1-Methyl-4-phenyl-1,2,3,6-tetrahydropyridine is a potent neurotoxin that induces reactive oxygen species production at a very low level (1 nmol/L or 0.17 ng/mL).24 This is why intrastriatal infusion of low-dose MPTP (2 ng/kg per minute) reduced TH-positive dopaminergic neurons not only in the SN of aged mice but also of young mice. Thus, despite that aged mice had lower brain extracellular MPTP/MPP+ levels than young mice after intraperitoneal administration, these levels (300 to 450 ng/mL for MPTP and 10 to 25 ng/mL for MPP+) were sufficient to cause reactive oxygen species production and neurotoxicity. However, compared with MPTP, the toxicity of endogenous isoquinoline neurotoxin is much lower and is chronic.25 Tetrahydroisoquinoine and its derivatives (salsolinol, 1-benzyl-TIQ, and N-methyl-(R)SAL) are structurally similar to MPTP, of which both 1-benzyl-TIQ, and N-methyl-(R)SAL can induce parkinsonism in rodents and monkeys.25 Levels of these TIQ derivatives are higher in the cerebrospinal fluid of patients with PD than in controls.26, 27, 28 It was reported that salsolinol is an endogenous substrate of human OCT2.3 As shown in the present study, both 1-benzyl-TIQ and N-methyl-(R)SAL are substrates of human OCT1 and OCT2. Because OCTs are facilitative (bidirectional) transporters, their expression in BMVs is responsible for either the influx or the efflux of substrates across the BBB. Therefore, the downregulation of OCTs during aging may reduce the clearance of endogenous neurotoxins in the brain and affect the induced toxicity.
The MPTP-induced dopaminergic toxicity in mice is the most commonly studied animal model of PD, in which B6 and Swiss mice are sensitive and resistant to the neurotoxicity caused by MPTP, respectively.29,30 One of the explanations for these observations is the difference in monoamine oxidase B (MAO-B) activity, which is an important enzyme that converts MPTP into MPP+, and its activity in brain preparations of B6 mice is higher than that of Swiss mice.31 Additionally, MAO-B activity seems to increase with age in B6 mice,32 which may be able to explain why the susceptibility to MPTP increases with age in B6 mice.33 Although MAO-B activity has been positively correlated with MPTP toxicity,34,35 others failed to show a correlation.36, 37, 38 Because the basal level of MAO-B activity seems to be adequate for the conversion of MPTP into MPP+,32 the increased MAO-B activity in senescent mice may not render them more susceptible to MPTP toxicity. In addition, factors that control or maintain brain levels of MPTP need to be considered. Our results showed that the expression of OCTs in BMVs and BBB transfer of MPTP are strain-dependent in mice. Thus, the expression levels of OCTs at the BBB that influence MPTP transfer may in part contribute to the differential susceptibility to MPTP-induced dopaminergic toxicity in B6 and Swiss mice.
In conclusion, the expression of Oct1 and Oct2 at the BBB is downregulated in aged mice. Aging and Oct1/Oct2 knockout reduce BBB transfer of MPTP, which significantly affects MPTP-induced dopaminergic toxicity in Oct1/2−/− mice but not in aged mice. Despite the lower brain MPTP levels, the aged mice are more susceptible to MPTP-induced dopaminergic toxicity than the young mice. Given that both 1-benzyl-TIQ and N-methyl-(R)SAL are substrates of human OCT1 and OCT2, these findings suggest that downregulation of organic cation transporters during aging may reduce brain efflux of endogenous neurotoxins and have a role in the development of dopaminergic toxicity.
The authors declare no conflict of interest.
Footnotes
Supplementary Information accompanies the paper on the Journal of Cerebral Blood Flow & Metabolism website (http://www.nature.com/jcbfm)
Supplementary Material
References
- Koepsell H, Lips K, Volk C. Polyspecific organic cation transporters: structure, function, physiological roles, and biopharmaceutical implications. Pharm Res. 2007;24:1227–1251. doi: 10.1007/s11095-007-9254-z. [DOI] [PubMed] [Google Scholar]
- Liou HH, Hsu HJ, Tsai YF, Shih CY, Chang YC, Lin CJ. Interaction between nicotine and MPTP/MPP+ in rat brain endothelial cells. Life Sci. 2007;81:664–672. doi: 10.1016/j.lfs.2007.07.004. [DOI] [PubMed] [Google Scholar]
- Taubert D, Grimberg G, Stenzel W, Schomig E.Identification of the endogenous key substrates of the human organic cation transporter OCT2 and their implication in function of dopaminergic neurons PLoSONE20072e385. [DOI] [PMC free article] [PubMed] [Google Scholar]
- Lin CJ, Tai Y, Huang MT, Tsai YF, Hsu HJ, Tzen KY, et al. Cellular localization of the organic cation transporters, OCT1 and OCT2, in brain microvessel endothelial cells and its implication for MPTP transport across the blood-brain barrier and MPTP-induced dopaminergic toxicity in rodents. J Neurochem. 2010;114:717–727. doi: 10.1111/j.1471-4159.2010.06801.x. [DOI] [PubMed] [Google Scholar]
- Dickens D, Owen A, Alfirevic A, Giannoudis A, Davies A, Weksler B, et al. Lamotrigine is a substrate for OCT1 in brain endothelial cells. Biochem Pharmacol. 2012;83:805–814. doi: 10.1016/j.bcp.2011.12.032. [DOI] [PubMed] [Google Scholar]
- Friedrich A, George RL, Bridges CC, Prasad PD, Ganapathy V. Transport of choline and its relationship to the expression of the organic cation transporters in a rat brain microvessel endothelial cell line (RBE4) Biochim Biophys Acta. 2001;1512:299–307. doi: 10.1016/s0005-2736(01)00333-9. [DOI] [PubMed] [Google Scholar]
- Okura T, Hattori A, Takano Y, Sato T, Hammarlund-Udenaes M, Terasaki T, et al. Involvement of the pyrilamine transporter, a putative organic cation transporter, in blood-brain barrier transport of oxycodone. Drug Metab Dispos. 2008;36:2005–2013. doi: 10.1124/dmd.108.022087. [DOI] [PubMed] [Google Scholar]
- Sung JH, Yu KH, Park JS, Tsuruo T, Kim DD, Shim CK, et al. Saturable distribution of tacrine into the striatal extracellular fluid of the rat: evidence of involvement of multiple organic cation transporters in the transport. Drug Metab Dispos. 2005;33:440–448. doi: 10.1124/dmd.104.002220. [DOI] [PubMed] [Google Scholar]
- Geier EG, Chen EC, Webb A, Papp AC, Yee SW, Sadee W, et al. Profiling solute carrier transporters in the human blood-brain barrier. Clin Pharmacol Ther. 2013;94:636–639. doi: 10.1038/clpt.2013.175. [DOI] [PMC free article] [PubMed] [Google Scholar]
- André P, Saubaméa B, Cochois-Guégan V, Marie-Claire C, Cattelotte J, Smirnova M, et al. Transport of biogenic amine neurotransmetters at the mouse blood-retina and blood-brain barriers by uptake 1 and uptake2. J Cerebral Blood Flow Metab. 2012;32:1989–2001. doi: 10.1038/jcbfm.2012.109. [DOI] [PMC free article] [PubMed] [Google Scholar]
- Wu KC, Pan HJ, Yin HS, Chen MR, Lu SC, Lin CJ. Change in P-glycoprotein and caveolin protein expression in brain striatum capillaries in New Zealand obese mice with type 2 diabetes. Life Sci. 2009;85:775–781. doi: 10.1016/j.lfs.2009.10.014. [DOI] [PubMed] [Google Scholar]
- Chang TT, Shyu MK, Huang MC, Hsu CC, Yeh SY, Chen MR, et al. Hypoxia-mediated down-regulation of OCTN2 and PPARα expression in human placentas and in BeWo cells. Mol Pharm. 2011;7:117–125. doi: 10.1021/mp100137q. [DOI] [PubMed] [Google Scholar]
- Zhang W, Wang T, Qin L, Gao HM, Wilson B, Ali SF, et al. Neuroprotective effect of dextromethorphan in the MPTP Parkinson's disease model: role of NADPH oxidase. FASEB J. 2004;18:589–591. doi: 10.1096/fj.03-0983fje. [DOI] [PubMed] [Google Scholar]
- Yeh SY, Pan HJ, Lin CC, Kao YH, Chen YH, Lin CJ. Hyperglycemia-induced down-regulation of renal P-glycoprotein expression. Eur J Pharmacol. 2012;690:42–50. doi: 10.1016/j.ejphar.2012.06.013. [DOI] [PubMed] [Google Scholar]
- Hindle JV. Ageing, neurodegeneration and Parkinson's disease. Age Aging. 2010;39:156–161. doi: 10.1093/ageing/afp223. [DOI] [PubMed] [Google Scholar]
- Rudow G, O'Brien R, Savonenko AV, Resnick SM, Zonderman AB, Pletnikova O, et al. Morphometry of the human substantia nigra in ageing and Parkinson's disease. Acta Neuropathol. 2008;115:461–470. doi: 10.1007/s00401-008-0352-8. [DOI] [PMC free article] [PubMed] [Google Scholar]
- Kubis N, Faucheux BA, Ransmayr G, Damier P, Duyckaerts C, Henin D, et al. Preservation of midbrain catecholaminergic neurons in very old human subjects. Brain. 2000;123:366–373. doi: 10.1093/brain/123.2.366. [DOI] [PubMed] [Google Scholar]
- Schumm S, Sebban C, Cohen-salmon C, Callebert J, Launay JM, Golmard JL, et al. Aging of the dopaminergic system and motor behavior in mice intoxicated with the parkinsonian toxin 1-methyl-4-phenyl-1,2,3,6-tetrahydropyridine. J Neurochem. 2012;122:1032–1036. doi: 10.1111/j.1471-4159.2012.07837.x. [DOI] [PubMed] [Google Scholar]
- Sugama S, Yang L, Cho BP, DeGiorgio LA, Lorenzl S, Albers DS, et al. Age-related microglial activation in 1-methyl-4-phenyl-1,2,3,6-tetrahydropyridine (MPTP)-induced dopaminergic neurodegeneration in C57BL/6 mice. Brain Res. 2003;964:288–294. doi: 10.1016/s0006-8993(02)04085-4. [DOI] [PubMed] [Google Scholar]
- Ali SF, David SN, Newport GD, Cadet JL, Slikker W., Jr MPTP-induced oxidative stress and neurotoxicity are age-dependent: evidence from measures of reactive oxygen species and striatal dopamine levels. Synapse. 1994;18:27–34. doi: 10.1002/syn.890180105. [DOI] [PubMed] [Google Scholar]
- Javitch JA, D'Amato RJ, Stritimatter SM, Snyder SH. Parkinism-inducing neurotoxin, N-methyl-4-phenyl-1,2,3,6-tetrahydropyridine: uptake of the metabolite N-methyl-4-phenylpyridine by dopamine neurons explains selective toxicity. Proc Natl Acad Sci USA. 1985;82:2173–2177. doi: 10.1073/pnas.82.7.2173. [DOI] [PMC free article] [PubMed] [Google Scholar]
- Cui M, Aras R, Christian WV, Rappold PM, Hatwar M, Panza J, et al. The organic cation transporter-3 is a pivotal modulator of neurodegeneration in the nigrastriatal dopaminergic pathway. Proc Natl Acad Sci USA. 2009;106:8043–8048. doi: 10.1073/pnas.0900358106. [DOI] [PMC free article] [PubMed] [Google Scholar]
- Salvatore MF, Apparsundaram S, Gerhardt GA. Decreased plasma membrane expression of striatal dopamine transporter in aging. Neurobiol Aging. 2003;24:1147–1154. doi: 10.1016/s0197-4580(03)00129-5. [DOI] [PubMed] [Google Scholar]
- Sriram K, Pai KS, Boyd MR, Ravindranath V. Evidence for generation of oxidative stress in brain by MPTP: in vitro and in vivo studies in mice. Brain Res. 1997;749:44–52. doi: 10.1016/s0006-8993(96)01271-1. [DOI] [PubMed] [Google Scholar]
- LeDoux MS.Tetrahydroisoquinolines and Parkinson's disease. In: Pfeiffer RF, Wszolek ZK, Ebadi M (eds),Parkinson's Disease. 2nd edn.CRC Press: Boca Raton, FL; 201291–108. [Google Scholar]
- Kotake Y, Tasaki Y, Makino Y, Ohta S, Hirobe M. 1-benzyl-1,2,3,4-tetrahydroisoquinoline as a Parkinsonism-inducing agent: A novel endogenous amine in mouse brain and Parkinsonian CSF. J Neurochem. 1995;65:2633–2638. doi: 10.1046/j.1471-4159.1995.65062633.x. [DOI] [PubMed] [Google Scholar]
- Maruyama W, Abe T, Toligi H, Dostert P, Naoi M. A dopaminergic neurotoxin, (R)-N-methylsalsolinol, increases in Parkinsonian cerebraospinal fluid. Ann Neurol. 1996;40:119–122. doi: 10.1002/ana.410400120. [DOI] [PubMed] [Google Scholar]
- Antkiewicz-Michaluk L, Krygowska-Wajs A, Szezudlik A, Romanska I, Vetulani J. Increase in salsolinol level in the cerebrospinal fluid of parkinsonian patients is related to dementia: Advantage of a new high-performance liquid chromatography methodology. Biol Psychiatry. 1997;42:514–518. doi: 10.1016/S0006-3223(96)00408-8. [DOI] [PubMed] [Google Scholar]
- Hamre K, Tharp R, Poon K, Xiong X, Smeyne RJ. Differential strain susceptibility following 1-methyl-4-phenyl-1,2,3,6-tetrahydropyridine (MPTP) administration acts in an autosomal dominant fashion: quantitative analysis in seven strains of Mus musculus. Brain Res. 1999;828:91–103. doi: 10.1016/s0006-8993(99)01273-1. [DOI] [PubMed] [Google Scholar]
- Jakowee MW, Petzinger GM. 1-methyl-4-phenyl-1,2,3,6-tetrahydropyridine-lesioned model of Parkinson's disease, with emphasis on mice and nonhuman primates. Comp Med. 2004;54:497–513. [PubMed] [Google Scholar]
- Riachi NJ, Harik SI. Strain differences in systemic 1-methyl-4-phyenyl-1,2,3,6-tetrahydropyridine neurotoxicity in mice correlate best with monoamine oxidase activity at the blood-brain barrier. Life Sci. 1988;42:2359–2363. doi: 10.1016/0024-3205(88)90189-0. [DOI] [PubMed] [Google Scholar]
- Nicotra A, Piecucci F, Parvez H. Senatori. Monoamine oxidase expression during development and aging. Neurotoxicology. 2004;25:155–165. doi: 10.1016/S0161-813X(03)00095-0. [DOI] [PubMed] [Google Scholar]
- Irwin I, DeLanney LE, Langston JW. MPTP and aging: studies in C57BL/6 mouse. Adv Neurol. 1993;60:197–206. [PubMed] [Google Scholar]
- Giovanni A, Sieber BA, Heikkila RE, Sonsalla PK. Correlation between the neostriatal content of the 1-methyl-4-phynylpyridinium species and dopaminergic neurotoxicity following 1-methyl-4-phenyl-1,2,3,6-tetrahydropyridine administration to several strains of mice. J Pharmacol Exp Ther. 1991;257:691–697. [PubMed] [Google Scholar]
- Walsh S, Wagner G. Age-dependent effects of 1-methyl-4-phenyl-1,2,3,6-tetrahydropyridine (MPTP): correlation with monoamine oxidase-B. Synapse. 1989;3:308–314. doi: 10.1002/syn.890030403. [DOI] [PubMed] [Google Scholar]
- Jossan SS, Sakurai E, Oreland L. MPTP toxicity in relation to age, dopamine uptake and MAO-B activity in two rodent species. Pharmacol Toxicol. 1989;64:314–318. doi: 10.1111/j.1600-0773.1989.tb00654.x. [DOI] [PubMed] [Google Scholar]
- Andersen JK, Frim DM, Isacson O, Beal MF, Breakefield XO. Elevation of neuronal MAO-B activity in a transgenic mouse model does not increase sensitivity to the neurotoxin 1-methyl-4-phenyl-1,2,3,6-tetrahydropyridine (MPTP) Brain Res. 1994;656:108–114. doi: 10.1016/0006-8993(94)91371-4. [DOI] [PubMed] [Google Scholar]
- Ito T, Suzuki K, Uchida K, Nakayama H. Different susceptibility to 1-methyl-4-phenylpyridium (MPP+)-induced nigro-striatal dopaminergic cell loss between C57BL/6 and BALB/c mice is not related to the difference of monoamine oxidase-B (MAO-B) Exp Toxicol Pathol. 2013;65:153–158. doi: 10.1016/j.etp.2011.07.004. [DOI] [PubMed] [Google Scholar]
Associated Data
This section collects any data citations, data availability statements, or supplementary materials included in this article.