

Abstract
Tissue sodium concentration increases in irreversibly damaged (core) tissue following ischemic stroke and can potentially help to differentiate the core from the adjacent hypoperfused but viable penumbra. To test this, multinuclear hydrogen-1/sodium-23 magnetic resonance imaging (MRI) was used to measure the changing sodium signal and hydrogen-apparent diffusion coefficient (ADC) in the ischemic core and penumbra after rat middle cerebral artery occlusion (MCAO). Penumbra and core were defined from perfusion imaging and histologically defined irreversibly damaged tissue. The sodium signal in the core increased linearly with time, whereas the ADC rapidly decreased by >30% within 20 minutes of stroke onset, with very little change thereafter (0.5–6 hours after MCAO). Previous reports suggest that the time point at which tissue sodium signal starts to rise above normal (onset of elevated tissue sodium, OETS) represents stroke onset time (SOT). However, extrapolating core data back in time resulted in a delay of 72±24 minutes in OETS compared with actual SOT. At the OETS in the core, penumbra sodium signal was significantly decreased (88±6%, P=0.0008), whereas penumbra ADC was not significantly different (92±18%, P=0.2) from contralateral tissue. In conclusion, reduced sodium-MRI signal may serve as a viability marker for penumbra detection and can complement hydrogen ADC and perfusion MRI in the time-independent assessment of tissue fate in acute stroke patients.
Keywords: apparent diffusion coefficient, middle cerebral artery occlusion, onset of elevated tissue sodium, penumbra, sodium MRI
Introduction
Ischemic stroke is a catastrophic event that causes pathological restrictions in arterial blood flow to a specific brain region. In the penumbra, tissue viability can nevertheless be maintained by a mix of aerobic and anaerobic metabolism for several hours after stroke onset. Eventually, if hypoperfusion persists, cells in the penumbra become irreversibly damaged and incorporated into the ischemic core. The term ‘penumbra' is used in this paper to describe hypoperfused tissue identified on magnetic resonance imaging (MRI) perfusion scans that did not exhibit markers of irreversible damage on subsequent post-mortem histological analysis (i.e., potentially viable hypoperfused tissue).
The accurate identification of penumbral tissue is critical in identifying stroke patients who could benefit from thrombolysis and in designing future clinical trials of potential neuroprotectants. Indeed, it has been shown that thrombolytic treatment outcomes are improved in patients selected using an MRI diagnosis.1 Brain tissue viability strongly depends on the severity and duration of hypoperfusion.2 Nevertheless, while hypoperfusion can be determined noninvasively with MRI, stroke onset time (SOT) and duration of hypoperfusion cannot be accurately determined from acute scans. For instance, in ‘wake-up' patients, which account for ~25% of strokes,3 the exact SOT cannot be determined accurately, preventing established acute stroke treatments such as thrombolysis with recombinant tissue plasminogen activator being applied.4 Thus, an onset time-independent method that could accurately identify core and penumbra tissue in patients would be a valuable addition to MRI protocols. However, the identification of subregions within hypoperperfused tissue (i.e., core and penumbra) using MRI remains elusive. The most promising approach relies on measuring water mobility in tissue via hydrogen diffusion MRI. The resulting quantitative value, the apparent diffusion coefficient (ADC), drops rapidly within minutes after stroke onset in regions that are initially smaller than the volume of hypoperfused tissue. Such ADC reduction, however, is not exclusively restricted to irreversibly damaged tissue during acute stroke. Low ADC values have also been measured in still viable stroke tissue,5 requiring a specific threshold to be defined to support the ADC/core tissue hypothesis. For example, ADC values reduced and maintained below a threshold of 0.53 μm2/ms were reported for permanently damaged tissue as determined by triphenyl-tetrazolium chloride staining analysis at 24 hours after experimental stroke (middle cerebral artery occlusion, MCAO) in rats.6 Such ADC thresholds may hence serve as a prospective marker for core tissue during the acute phase. Validation of this hypothesis remains a challenge because of the lack of histological markers that could serve as an independent gold standard to define early tissue damage during the acute phase.
Monitoring changes in local sodium ion concentration may provide an alternative or complementary MRI approach for identification of core and penumbra regions noninvasively via sodium MRI. It is reported that following an ischemic insult, sodium concentration (intracellular plus extracellular) increases within core tissue at a rate of ~2%/hour in humans,7, 8, 9 ~5-8%/hour in monkeys,10 ~12%/hour in rabbits,11 and ~22–25%/hour in rats.12, 13, 14 The core lesion size appears to determine the rate of sodium increase as a function of time, with faster rates in smaller lesions as described recently in a mathematical adaptation of Fick's second law.15 A study by Wang et al.16 suggested that sodium MRI may also serve as a ticking clock for determining SOT, whereas Jones et al.12 reported that SOTs in rat models of MCAO can be calculated retrospectively from a linear extrapolation with less than a 4-minute error.
In a previous rat MCAO study, variable delays were observed in the hemisphere ipsilateral to the stroke before the tissue sodium concentration (TSC) increased, with an early increase in the presumed core and a delayed increase in the presumed penumbra (regions of interest (ROIs) estimated from experience with this model).13,17 Furthermore, an initial decrease in sodium concentration of ~4 mmol/L was observed in the presumed penumbra.13 Bartha et al.11 also reported a decrease of ~8% in stroke tissue (no discrimination made between the core and penumbra) during the acute phase in a rabbit stroke model, whereas Tyson et al.18 measured a 5% sodium reduction, acquired spectroscopically, in normoglycemic tissue during 10 minutes of transient forebrain ischemia. However, as neither perfusion nor diffusion values were recorded in these studies, it was impossible to verify whether the tissue was hypoperfused and potentially salvageable. The lack of precise time course measurements and localization of penumbra and core tissues has thus hampered a full evaluation of the use of sodium MRI in acute stroke.
Recent patient data indicate that the sodium signal remains unchanged in presumed penumbra tissue8,9 and that sodium signal changes in the core do not reverse after reperfusion.19 During acute stroke it has been reported that the lesion identified from increased sodium concentration can be smaller than the lesion identified from decreased ADC.19 However, the heterogeneity in stroke progression between individual patients as well as the need for a dedicated ADC threshold to determine lesion size poses a challenge. The lack of sufficient clinical data at different acute time points makes it difficult to interpret these results with respect to sodium signal changes in relation to the time after arterial occlusion and the time of tissue viability loss. In vivo serial scanning of ischemic stroke models can deliver the required temporal information in individual animals.
The aim of the current study was to investigate the changes in sodium signal and ADC values in penumbra and core tissues and to check the validity of using sodium image intensity, first, to predict the SOT and, second, to identify potentially salvageable penumbral tissue. Using an established model of permanent focal cerebral ischemia (MCAO), alternating sodium and ADC measurements were made from 0.5 to 6 hours after stroke with subsequent perfusion imaging for penumbra assessment using perfusion/histology mismatch. To check the validity of using tissue sodium to predict the SOT, the time point after MCAO at which sodium increases above normal tissue sodium in the affected hemisphere is hereinafter called the onset of elevated tissue sodium (OETS).
We hypothesize that in the penumbra, where cells are still capable of maintaining a membrane potential and a sodium concentration gradient, the sodium signal will be normal or reduced and will remain below or at the sodium signal level from nonischemic (contralateral ROI) tissue. As time progresses and the tissue loses its viability—transitioning to core tissue—the sodium signal in this region will increase and will be higher than contralateral sodium levels.
Materials and Methods
Sodium- and Hydrogen MRI
A double-tuned sodium/hydrogen surface resonator was used for sodium-and hydrogen—MRI; the design of this transceiver (TXRX) coil is described in detail elsewhere.17 A three-dimensional 3D Fast Low Angle SHot (FLASH) sequence was used to acquire sodium images with high spatial and temporal resolution using a 7T system (Bruker BioSpec 70/30 system, Ettlingen, Germany). A TE of 2.6 ms was achieved with 10% partial echo acquisition to minimize T2*-weighting effects on the measured signal intensity. Steady-state imaging was achieved using a short repetition time (TR) of 23 ms, which was appropriate considering that T1 in brain tissue at high field strengths ⩾7 T for sodium in vivo is ~40 ms.20,21 The transmit power was set so that a flip angle equal to the Ernst angle was located in the center of the brain, and the receiver bandwidth was set to 4 kHz. The field of view was 80 mm × 80 mm × 80 mm and the matrix size was 80 × 80 × 20 resulting in a voxel resolution of 1 mm × 1 mm × 4 mm in a 5-minutes acquisition time (TA) for eight averages. A nominal voxel resolution of 0.5 mm × 0.5 mm × 2 mm was achieved after twofold three-dimensional zero-filling. Two 8-mm-diameter cylindrical fiducial vials, permanently attached to the top of the surface detector coil, were included in the imaged field of view to establish the symmetrical coil positioning relative to the rat head in each experiment.
1H diffusion weighted images (DWIs) were acquired using an echo planar imaging sequence with TR/TE=4,000/32 ms, a b value of 600 s/mm2 applied along three different orthogonal directions, voxel size (0.25 × 0.25 × 1.9) mm3, eight slices with 0.1 mm slice gap, and 8.5 minutes acquisition time. ADC maps were generated for each slice.
Hydrogen perfusion images (PI) were acquired before the rats were killed by swopping the sodium coil system with a standard transmit-only receive-only (TORO) resonator system (72 mm diameter linear volume resonator and 20 mm diameter receive-only surface coil) in a pseudocontinuous arterial spin labeling (pCASL) echo planar imaging-based sequence22 with repetitive labeling pulse applied every 60 ms (50 pulses) and slice selective labeling once around the neck and once above the head. The read-out EPI parameters were as follows: TR/TE=4,000/22 ms, TA=2 minutes per slice, in-plane resolution=(0.26 × 0.26) mm2, and slice thickness=2 mm. Five slices were acquired that matched the diffusion slice positions. Perfusion images were computed as the difference between the labeled and unlabeled images, and values reported herein are given as a percentage change relative to the contralateral cortex.
A final hydrogen DWI data set was then acquired with the same hydrogen TORO resonator system using a 2D echo planar imaging sequence with the following: TR/TE=4,000/26 ms, voxel size (0.25 × 0.25 × 1.9) mm3, eight slices with 0.1 mm slice gap, and 2 minutes 8 seconds acquisition time. A b value of 600 s/mm2 was applied along each of the three orthogonal directions in space, and one unweighted b=0 s/mm2 acquisition was recorded. ADC maps were generated for each slice.
Stroke Model
In vivo experiments were performed under license from the UK Home Office and were subject to the Animals (Scientific Procedures) Act, 1986. All research complied with the Declaration of Helsinki. Six male Sprague–Dawley rats (bodyweight ~300 g, Harlan, Bicester, UK) were anesthetized with 5% isoflurane in a ratio of nitrous oxide:oxygen of 70:30. A tracheal cannula was surgically implanted for artificial ventilation via a small animal respirator pump (6025 rodent ventilator, Ugo Basile Srl, Monvalle Varese, Italy), anesthesia maintained using 2–2.5% isoflurane and femoral arteries, and veins were cannulated. Experimental stroke was induced by permanently occluding the left middle cerebral artery with an intraluminal filament.23 Filaments were prepared from 3/0 Dermalon blue nylon monofilament (1744-41, Sherwood, UK), the tip was heated with a low-temperature cauterizing pen (AA90, Bovie, UK) to create a bulb of 300 μm diameter for animals of 275-350 g. Data from all animals that were included in the study are presented. No animals died under procedure or were excluded from the study. Blood pressure (from femoral artery cannula), heart rate (MRI-compatible electrocardiogram electrodes, Red Dot neonatal monitoring electrodes, 2269 T, 3 M), body temperature (MRI-compatible rectal probe, Bruker), and blood gases were monitored and maintained within normal limits throughout surgery and MRI scanning.
Experimental Workflow
Following induction of cerebral ischemia, the rat was positioned on a support cradle, for movement in and out of the magnet bore, and kept warm by a warm water circulation jacket. The double-tuned surface resonator was tuned and matched in situ. The automatic adjustment procedures of the MRI system were performed via the hydrogen channel on the resonator, following which the survey hydrogen images were acquired to verify correct animal and coil positioning inside the magnet. Manual adjustments of the reference pulse attenuation value and shimming were then performed for the sodium surface coil using a sodium-free induction decay experiment. Ten sodium-MRI scans and one hydrogen DWI acquired consecutively were recorded for up to 5.5 hours using the TXRX surface resonator, followed by a hydrogen-PI and -DWI scan with the standard hydrogen TORO resonator system. Six stroke rats were scanned in total, referred to herein as stroke 1–6. For the last two experiments (strokes 5 and 6) a different sodium surface transceiver resonator with similar detection properties (20 mm inner diameter, planar, double-tuned hydrogen/sodium surface transceiver, Bruker BioSpin GmbH) was used. The spacing between ADC acquisitions was 30 minutes for strokes 1, 5, and 6 and 60 minutes for strokes 2, 3, and 4.
Infarct Size Analysis
Following completion of scanning (330±50 minutes after MCAO, Table 1) animals were killed (time of killing=378±42 minutes after SOT, Table 1) by transcardial perfusion fixation using 4% paraformaldehyde in phosphate buffer and the location and volume of irreversible ischemic damage was determined from histology sections. The brains were harvested, processed, and embedded in paraffin wax, subsequently sectioned at 6 μm and collected over eight stereotaxic coronal levels covering the same rostrocaudal extent of MCA territory as the MRI slices (2–12.2 mm from the interaural line24) with appropriate sections matched up to each of the sodium-MRI brain slices using neuroanatomical landmarks. Histology sections were stained with hematoxylin and eosin and examined with light microscopy. The boundary of the ischemic lesion was determined on the basis of neuronal morphology (darkly stained, pyknotic neurones) and vacuolated neuropil. This boundary was then transcribed on coronal line diagrams from a stereotaxic atlas24 as described elsewhere25 to correct infarct measurements for any ischemia-associated brain swelling and brain shrinkage associated with histological processing.
Table 1. Timings and sodium data in the penumbra and core.
| Rat stroke number | 1 | 2 | 3 | 4 | 5 | 6 | Mean±s.d. | P value |
|---|---|---|---|---|---|---|---|---|
| OETS (min after actual stroke onset) | 75 | 61 | 99 | 57 | 98 | 39 | 72±24 | 0.00003a |
| Final MR measurement time after stroke (min) | 290 | 351 | 330 | 419 | 280 | 315 | 330±50 | |
| Time of killing after stroke (min) | 325 | 370 | 340 | 440 | 400 | 390 | 378±42 | |
| Na in penumbra at OETS (% contr.) | 91 | 83 | 88 | 99 | 83 | 86 | 88±6 | 0.0008b |
| Na in penumbra at end (% contr.) | 95 | 109 | 102 | 127 | 93 | 82 | 101±16 | 0.83b |
| Na in core at end (%contr.) | 147 | 152 | 138 | 214 | 140 | 142 | 155±29 | 0.0009b |
| Na slope in core (%contr/hour) | 13.1 | 10.8 | 9.9 | 18.9 | 13.2 | 9.1 | 12.5±3.5 | |
| Histology defined lesion size (mm3) | 292 | 146 | 119 | 364 | 298 | 208 | 238±96 |
MR, magnetic resonance; OETS, onset of elevated tissue sodium; SOT, stroke onset time.
Timings and sodium data in the penumbra and core for each rat (n=6). The measurement time point ‘end' corresponds to the final MR measurement time after stroke given in this table.
With respect to actual SOT.
With respect to contralateral tissue.
Image Co-Registration
The fourth stereotaxic coronal level covering the center slice of the rostrocaudal extent of MCA territory (8.2 mm from the interaural line) was used to carry out noninvasive perfusion, ADC, and sodium measurements on a single slice.
The hydrogen-PI and -DWI images acquired with the hydrogen TORO system and the histology maps were co-registered to the sodium and hydrogen ADC images that were acquired with the double-tuned surface resonator. In order to maintain the high spatial resolution of the histology maps, all images were resized using nearest neighbor interpolation to a matrix size of 1,024 × 1,024. Image co-registration was carried out by setting corresponding markers in anatomically identical regions of the brain using the control point selection tool in Matlab (The Mathworks, Natick, MA, USA), with an affine transformation used to register the images. This allowed for the accurate placement of ROIs in the different multimodal images and parametric maps for later computation purposes, some examples of which are shown in Figure 1.
Figure 1.

Region of interest (ROI) selection for penumbra and core tissue for one representative rat (stroke 2) using imaging data acquired at the end of the experiment (5 hours after middle cerebral artery occlusion (MCAO)) and histology maps. (A) Relative perfusion-weighted images and (B) apparent diffusion coefficient (ADC) maps were used to determine (C) the perfusion–diffusion mismatch area, where the perfusion deficit was defined as regions exhibiting perfusion level <57% of the contralateral cortex, whereas ADC values below a threshold of 0.53 μm2/ms defined the ADC lesion. Dark gray regions indicate the diffusion–perfusion mismatch, and white the hypoperfused core with low ADC. (D) Core (white) and penumbra (dark gray) ROIs defined with reference to the histology and perfusion image (PI) data. Mirror ROIs in contralateral hemisphere are also shown. The histology defined outline, delineating permanently damaged core tissue is superimposed on each of the four images/maps.
Determination of Penumbra and Ischemic Core
In this study the core ROI was defined within the boundary of the histologically verified, irreversibly damaged tissue, and the penumbra ROI from the mismatch between the area of hypoperfusion and the histology defined area of irreversible tissue damage. The area of perfusion deficit was calculated on the basis of a 57% reduction of the cerebral blood flow relative to the mean contralateral cerebral blood flow in the cortex25,26 using a code developed in Matlab (The Mathworks). ROIs delineating core and penumbra regions (Figure 1d) were manually defined, guided by the location of hypoperfusion and histology at 5–6 hours after stroke in order to observe the temporal sodium signal and hydrogen ADC evolution in each distinct region. Corresponding ROIs were also manually defined in contralateral tissue homotopic to the core and penumbra in order to correct for the slight sodium coil-sensitivity profile; an example of all ROIs thus defined for one representative rat are presented in Figure 1d. The sodium values were then computed as the mean and s.d. of the respective ROIs relative to the contralateral tissue. All images were masked to the rat brain, wherein the mask was computed from manually drawn contours drawn around the edge of the brain as visualized in a diffusion-weighted image.
23Na and Apparent Diffusion Coefficient Data Analysis
For qualitative presentation of the ADC maps and sodium MR images, each pixel value was normalized to the mean sodium signal values and ADC in contralateral tissue using a ROI placed over the entire contralateral hemisphere. For quantitative measurements of the sodium signal, the mean signal in the core and penumbra was normalized to the mean sodium signal values measured in ROIs contralateral to the core and penumbra, respectively. Assuming a linear increase in the sodium signal in ischemic core tissue (as reported in previous studies12,13,17), the signal in core ROI was fitted to a linear function according to
 |
where the line to which the sodium signal was fitted was characterized by the intercept c (the estimated sodium signal at SOT) and the rate of sodium signal change as a function of time s (the slope).
The OETS—the time after MCAO at which tissue sodium in the ischemic core ROI starts to rise above contralateral tissue sodium—was computed from the linear regression results according to
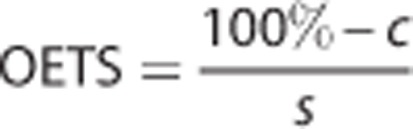 |
The s.d. and the mean values were computed for the ADC and sodium signal in both the core and penumbra ROIs at OETS and at the end of the experiment.
Statistical Analysis
Data are presented as the mean±s.d. The paired samples' t-test was used for comparison of ipsilateral sodium and ADC signals with contralateral values. Statistical significance was assumed when P<0.05.
Results
Middle cerebral artery occlusion induced a region of reduced ADC with a larger perfusion deficit and an increase in tissue sodium signal within MCA territory. The spatial change in the ADC and the normalized sodium signal as a function of time after MCAO, are presented for a representative rat in Figure 2. The quantitative sodium values for the group, together with experimental timings, histology-defined lesion size, and OETS, are listed in Table 1. The corresponding ADC values are listed in Table 2.
Figure 2.

Apparent diffusion coefficient (ADC) maps (upper row) and sodium images (lower row) for one representative rat (stroke 2), where the signal in the latter was normalized to the contralateral hemisphere. Numbers above each image indicate the time after middle cerebral artery occlusion (MCAO). The lower boundary of the gray scale on the ADC maps represents the 0.53-μm2/ms core threshold and delineates the ADC-defined lesion. The histology defined white outline, delineating permanently damaged core tissue is superimposed on each of the ADC and sodium images. Note the low sodium signal in the ipsilateral cortex during the early time points (arrow 1) and during the entire experiment (arrow 2). Sodium signal change is highly heterogeneous in core and penumbra. Within the core territory, the ipsilateral ventral cortex (arrow 3) presenting with initially low sodium exhibits a delayed onset of tissue sodium elevation at 3 hours after stroke. Note that the sodium signal is approximately twofold higher in voxels containing cerebrospinal fluid (i.e., within the ventricles) compared with voxels containing brain tissue.34
Table 2. Hydrogen ADC results in the penumbra and core.
| Rat stroke number | 1 | 2 | 3 | 4 | 5 | 6 | Mean±s.d. | P value |
|---|---|---|---|---|---|---|---|---|
| ADC in penumbra at OETS (μm2/ms) | 0.68 | 0.71 | 0.78 | 0.79 | 0.82 | 0.86 | 0.77±0.07 | 0.180 |
| ADC in ROI contralateral to penumbra at OETS (μm2/ms) | 0.70 | 0.81 | 0.83 | 0.88 | 0.94 | 0.85 | 0.84±0.08 | |
| ADC in penumbra at end (μm2/ms) | 0.61 | 0.69 | 0.77 | 0.59 | 0.77 | 0.84 | 0.71±0.10 | 0.026 |
| ADC in ROI contralateral to the penumbra at end (μm2/ms) | 0.78 | 0.80 | 0.80 | 0.81 | 0.90 | 0.91 | 0.83±0.06 | |
| ADC in core at OETS (μm2/ms) | 0.54 | 0.51 | 0.57 | 0.52 | 0.49 | 0.59 | 0.54±0.04 | 5 × 10⁻⁹ |
| ADC in ROI contralateral to the core at OETS (μm2/ms) | 0.84 | 0.88 | 0.90 | 0.90 | 0.90 | 0.86 | 0.88±0.03 | |
| ADC in the core at end (μm2/ms) | 0.52 | 0.54 | 0.54 | 0.51 | 0.52 | 0.60 | 0.54±0.03 | 2 × 10⁻⁸ |
| ADC in ROI contralateral to the core at end (μm2/ms) | 0.80 | 0.90 | 0.87 | 0.91 | 0.87 | 0.85 | 0.87±0.04 |
ADC, apparent diffusion coefficient; OETS, onset of elevated tissue sodium; ROI, region of interest.
Hydrogen ADC results in the penumbra and core for each rat (n=6). The measurement time point ‘end' corresponds to the final MR measurement time after stroke given in Table 1.
In the contralateral hemisphere, the ADC values were 0.83±0.06 and 0.87±0.04 μm2/ms, respectively, for ROIs homotopic to the penumbra and core. The ipsilateral ADC data were thresholded at 0.53 μm2/ms,6 with values below this threshold shaded black. Qualitative data in Figure 2 show that tissue with ADC values below this threshold appeared rapidly within the first 20 minutes in a large fraction of the (later defined) core ROI. Thereafter, there was a slight increase in ADC-defined lesion size in this and other animals in the group (Figures 2 and 3).
Figure 3.

Relative sodium signal and apparent diffusion coefficient (ADC) profiles in each animal. Data are averaged across regions of interest (ROIs) in the penumbra and core tissue (shown in the inset stereotaxic atlas plates), expressed as a % of the contralateral ADC of ROI ADC and sodium values and plotted as a function of time after middle cerebral artery occlusion (MCAO). Note that linear extrapolation of the core sodium signal (red circles) back to the y axis intersects at a value well below 100% of contralateral ROI sodium, leading to an underestimation of stroke onset times in all cases (averaging at 72±24 minutes).
A linear increase in the sodium signal was observed in core tissue (Figure 3). By the end of the experiment (330±50 minutes after MCAO), the sodium signal in core tissue averaged 155±29% of contralateral values. The OETS, averaged across the group, deviated by 72±24 minutes from the actual time of arterial occlusion.
When sodium in the core starts to rise above contralateral values (OETS=72±24 minutes after MCAO), the penumbra sodium signal was significantly decreased (88±6% of contralateral, P=0.0008) gradually rising to 101±16% of contralateral tissue (P=0.83) by the end of the experiment. Using sodium data from OETS to the end of the experiment, the rate of rise in tissue sodium was 2.9±2.3%/hour in the penumbra and 12.5±3.6%/hour in the core tissue.
At the OETS, the ADC value in histologically defined core was already significantly lower than in the contralateral ROI, whereas the ADC value in the penumbra was not significantly different from the contralateral ROI (Table 2). By the end of the experiment, the penumbra ADC value was significantly lower than the contralateral ROI but was still above the viability threshold (group data 0.71±0.10 μm2/ms, P=0.026).
Discussion
Because viability of brain tissue requires maintenance of a strong sodium concentration gradient between the intra- and extracellular spaces, the ischemic penumbra may be defined as a region of constrained blood supply in which the sodium concentration gradient is maintained. If perfusion is not restored, energy stores become exhausted, membranes depolarize and the concentration gradient is lost as sodium levels increase in the intracellular space. When this occurs, the tissue takes on the characteristics of the ischemic core, which also includes a significant reduction in ADC. We have explored two potential uses for MR-defined TSC: (1) to predict SOT and (2) to identify penumbral tissue.
1. Tissue Sodium Signal to Predict Stroke Onset Time
The time point at which tissue sodium, in the affected hemisphere, increases above contralateral levels (i.e., the OETS) has been reported to provide an estimation of the SOT; the present study highlights the limitations of such an approach, given the heterogeneity in ischemic stroke patients.
Defining the onset of elevated tissue sodium from linear regression data
Jones et al.12 reported a linearly extrapolated sodium signal equal to normal sodium signal levels at the time of arterial occlusion, resulting in an estimated SOT accuracy of ±4 minutes. From the current study, it is clear that SOT estimation via extrapolation of sodium time course data is prone to significant errors. In all rats investigated, the backward extrapolation of the linearly increasing sodium signal resulted in a consistent underestimation of the SOT (Table 1). The tissue sodium signal in the core ROI rose above normal contralateral levels at ~70 minutes after arterial occlusion. The linear-extrapolation method is based on the hypothesis that the tissue within the analyzed core ROI becomes irreversibly damaged immediately following the arterial occlusion. However, tissue included in the core region, as determined by PI and post-mortem histology analysis at 7 hours after MCAO, may not have been irreversibly damaged at early time points, resulting in the significant error in the SOT estimation. Indeed, in a previous study carried out using this experimental stroke model, time delays varying from 0 to 4 hours after MCAO were observed before the sodium concentration increased in tissue that was subsequently displayed as infarct on histology.13 An earlier study in rats estimated SOT with an error of 41–52 minutes using this method,16 whereas in monkeys a study reported estimated SOTs that were out by 27 minutes.10 Recent studies involving human sodium MRI in the acute stroke period showed that sodium signal levels measured in the core tissue, defined by visibly increased DWI signal, remained normal up to 7 hours after arterial occlusion before eventually increasing.8,9 This is consistent with the current and previous13,17 rat stroke studies, where variable delay times were measured before TSC increased, coupled with early small decreases in sodium levels in the penumbra, suggesting that any increase above normal levels (we propose this as a viability threshold level) would indicate irreversible damage. In this case, permanent tissue damage would not be directly correlated with SOT, that is, the time of arterial occlusion, but rather the time at which sodium signal begins to increase above normal levels. Hence, given a viability threshold at nonpathological TSC values,13 a pixelwise linear extrapolation back in time (for any regions exhibiting an increase in Na signal above normal values) may indicate the time of tissue viability loss at that specific location, rather than the time of arterial occlusion. Indeed, the very concept of a ‘SOT' is not particularly useful from a sodium MRI perspective, given the impossibility of uniquely defining ‘core' tissue (i.e., tissue that was definitively irreversibly damaged immediately after the stroke occurred) and hence the impossibility of estimating the onset time with any degree of accuracy by extrapolating sodium time course data back in time. From a clinical perspective, it is also unlikely that repeat measurements on patients in the acute phase would be justifiable before treatment is initiated, and hence the minimum of two time point measurements required to determine a slope and thereby extrapolate back to estimate an onset time are unlikely to ever be realized in practice.
2. TSC to Identify Penumbral Tissue—23Na Decrease in Penumbra Tissue
At the OETS, in comparison with the core, the penumbra displays a significant decrease in sodium signal (88±6% compared with contralateral sodium signal) coincident with a small nonsignificant decrease in ADC value (Tables 1 and 2). A similar-sized decrease in sodium signal was observed in a previous study,11 although the authors did not differentiate between penumbra and core tissues. We have previously reported a 4 mmol/L decrease in sodium at various times after MCAO in presumed penumbra tissue,13 whereas a nuclear magnetic resonance study reported a 5% sodium signal decrease after artery occlusion in normoglycemic tissue, with no change in hypo- and hyperglycemic tissues.18 Factors that could conceivably contribute to the observed decrease in tissue sodium in the penumbra include the following:
A perfusion effect
Immediately after arterial occlusion, blood flow reduces in the territory of the blocked blood vessel, whereas the intravascular volume remains constant, which will have no effect on the overall sodium content in the intravascular space of hypoperfused voxels. Consequently, perfusion effects are not thought to contribute significantly to the observed decrease in tissue sodium in the penumbra.
Relaxation-time effect
The relaxation time differences between intra- and extracellular sodium nuclei can have a strong effect on the measured sodium signal, particularly considering that intra- and extracellular T2* relaxation times are quite different27 and that the compartmental sodium content changes during nonhomeostasis. During the acute stroke phase, a strong sodium influx into cells has been observed in isolated heart muscle after coronary artery occlusion and reperfusion using chemical shift reagents to separate the intra- and extracellular sodium components.28 Despite no change in the overall sodium content, the measurable relaxation time-weighted signal, hence, can change dramatically because of faster relaxation effects on sodium ions in the intracellular compartment. Furthermore, during the chronic phase, at 24 hours after ischemic stroke, a recent mouse study reported increasing T2* relaxation time in the core tissue.29 Although a decrease in T2* relaxation time remains to be experimentally verified during the acute phase, it must be considered as one potential reason for the sodium signal reduction measured in the current study, for instance, as an effect of increased intracellular sodium concentration.
Considering that the intravascular compartment (with a 5% volume fraction) and the extracellular compartment (20% volume fraction) both contain a 140-mmol/L concentration of sodium, whereas the intracellular compartment (75% volume fraction) has a lower concentration of 10 mmol/L, the net density-weighted sodium signal originating from the extracellular space is ~82%. At 9.4 T, the transversal relaxation time for the sodium nuclei T2*brain was measured to be 4.8 ms in the mouse brain.29 However, there is a lack of further data in the published literature reporting specific compartmental T2*-relaxation times, and hence we estimated the extracellular component T2*e to be in the range of 6 ms, with an intracellular component T2*i of ~2.1 ms, using the fact that the extracellular T2* component is longer than the intracellular T2* component and the assumption of a monoexponential relaxation behavior in each compartment.
At 8.5 T, the intracellular longitudinal relaxation time, T1i has been determined to be monoexponential with a value of 23 ms30 and T1e is assumed to be similar to measured brain cerebrospinal fluid of 50 ms.31 For further computational purposes, the following sequence parameters were extracted from the current study: TR=23 ms, TE=2.6 ms, and flip angle=60°.
The relative sodium signal for each compartment (Srel) can then be computed according to the following equation:32
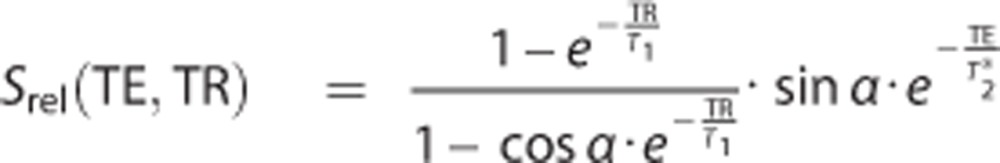 |
The signal levels measured for different sodium concentrations, (Na), and volumes, V, can be computed as follows:
 |
To give a numerical estimation, it is further assumed that the influx of sodium ions into still viable penumbra cells leads to an increase in intracellular sodium concentration to 20 mmol/L33 because the Na/K ATPase pump is still active and the extracellular sodium compartment is much smaller volumetrically so that it would be hard to increase the intracellular concentration drastically from 10 to 140 mmol/L within minutes. Then we further assume that the net amount of sodium ions contributing to the MR signal measured from a single voxel in such tissue remains constant and that the volumetric ratios are unchanged during the acute stroke phase. To raise the intracellular sodium concentration by 10 mmol/L through an influx of ions from the extracellular compartment, the extracellular sodium concentration must decrease from 140 to 110 mmol/L. This would result in a 4% signal reduction. If the extracellular sodium concentration were to be reestablished at 140 mmol/L, a 14% signal increase would thus be expected, in obvious contradiction to the measured values in the penumbra in the current study. Although present, the relaxation time effect on the measured sodium reduction may thus be negligible when a sufficiently short TE is used in the data acquisition, as in this study.
Cell swelling effect
A decrease in TSC of 7±2% has been measured in the presumed penumbra in a rat permanent MCAO study in which there was no relaxation time weighting.13 It is thus assumed that the sodium signal reduction observed in the current study most likely results from an actual TSC reduction in observed penumbra tissue. An actual TSC decrease can be caused by an increase in intracellular sodium concentration, resulting in disturbed homeostasis and subsequent water influx, which in turn increases the intracellular compartmental volume fraction. Because the measured voxel size is constant during the experiment, the extracellular space thus decreases and consequently the total sodium concentration reduces. Assuming an increase in the intracellular volume normally comprising 75% of a tissue voxel to 79% and an intracellular sodium concentration that, hence, is diluted to the normal content of 10 mmol/L with 140 mmol/L extracellular sodium concentration, a 13% signal decrease is computed using the above-mentioned equations. This is in good agreement with the measured reduction of 12% in this study. Cell swelling will be accompanied by an ADC decrease, as measured in penumbra in the current study where an ADC decrease of ~15% was evident by 6 hours after stroke. Indeed, the reduction in ADC values because of cellular edema during the acute stroke phase is a well-documented phenomenon.5 The specific time at which the ADC decreases below the viability threshold appears to occur later in tissue that remains viable for longer,5 whereas the sodium signal was observed to be decreased in penumbra tissue long before ADC values reduced significantly below contralateral values in the same region (Figure 3).
Reduced sodium signal may hence serve as a measure for cell swelling in still-viable tissue. A decreased sodium signal in hypoperfused tissue was also previously reported in a study involving stroke in rabbits.11 However, no pathophysiological interpretation was proffered because separate penumbra and core identification was not possible.
Temporal Variations in Sodium Signal in Core and Penumbra Tissue
The observed sodium slope in the core was measured to be 12.5±3.5%/hour, which is below the rate reported in previous rat studies (~22–25%/hour).12, 13, 14 However, considering the T2*- and T1-weighting of the sequence used in this study, a lower overall effect of the sodium accumulation was expected and hence these values are within the expected slope range for rat MCAO experiments. The sodium signal difference between brain tissue and cerebrospinal fluid is normally a factor of three; however, for the sequence used herein these differences reduced to a factor of two (see Figure 2). Furthermore, the maximum sodium signal that can be reached with the imaging pulse sequence is also reduced. As an explanation serves that the sequence has been set to achieve the Ernst angle for brain tissue and its respective longitudinal relaxation parameters. In permanently damaged tissue, one can assume that the longitudinal relaxation time becomes more like in cerebrospinal fluid and hence a reduced slope is measured.
After the OETS, the subsequent gradual increase of 2.5%/hour observed in the penumbra sodium signal could potentially be explained by the gradual rupturing of cellular membranes within the affected region, that is, as the tissue gradually becomes irreversibly damaged. The resulting increase in TSC this would engender has been described previously;7 in the model proposed here, the occurrence of an intermediary phase in tissue at risk, wherein cellular swelling results in a reduction in TSC, is added. Further studies are required to verify this hypothesis.
It remains unclear, however, whether the slow increase in sodium signal observed in penumbra tissue is occurring in still-viable tissue, or whether it is because of the loss of cellular integrity for progressively large numbers of individual cells within the penumbra tissue, with the rest remaining intact. It should be noted that the observed increase could be influenced by a partial volume effect from the neighboring core area, given the relatively small penumbral area in these animals, or diffusion in extracellular Na+ along the concentration gradient from the core, to the neighboring penumbral tissue. This question could be answered by chemical shift imaging experiments. Shift reagents have acute toxicity issues in vivo but allow a discrimination of intracellular and extracellular sodium in each voxel.
Prolonged Tissue Survival in the Penumbra
By 6 hours after MCAO, it had been expected, from previous experience with this model that no penumbra would remain. Over the first 4–6 hours after MCAO, the ADC lesion normally grows until it encompasses the whole of the hypoperfused region. The results in this study show that this was the case for none of the six investigated strokes (suggesting that the penumbra can survive for longer than previously thought). We assume that the tight control and maintenance of the physiology of the animals within normal limits (e.g., PaO2, PaCO2, blood pressure, and temperature) during MRI scanning may have resulted in the prolonged tissue survival.
Sodium magnetic resonance imaging for Clinical Acute Stroke Diagnostic Imaging
The current treatment guidelines for stroke patients recommend a time window of 4.5 hours from stroke onset for thrombolytic therapy. In cases where SOT is unknown, a technique that could determine SOT would clearly be of benefit within this framework. However, a technique that could reveal the extent of penumbral tissue is arguably of more utility to stroke clinicians. Thrombolytic therapy could benefit some patients who still have penumbra beyond 4.5 hours, but put patients lacking penumbra within the 4.5-hour window at increased risk of hemorrhage. It may be here that sodium MRI has most to offer, through identification of the presence of penumbral tissue, leading to a more patient-specific treatment regime. A combination of sodium MRI and DWI, for example, could represent an optimal protocol for guiding patient management: the former indicating whether at-risk but potentially salvageable tissue is still present in the patient, with the latter giving an overall sense of the extent of damage in the brain, and the combination used to determine whether the patient is likely to benefit from the treatment.
Conclusion
A significant decrease in the sodium signal in the acute phase of stroke has been measured for the first time in penumbra tissue identified using a combination of perfusion and histology data. It is clear from the current and previous studies that increased tissue sodium levels indicate irreversibly damaged tissue, suggesting that a threshold for tissue viability lies close to normal values. Given that it is now accepted that the DWI (or ADC) lesion is likely to include some penumbral tissues at early time points after stroke, sodium MRI may more accurately identify both potentially viable penumbra and nonviable core tissue, although its potential to accurately determine a patient's SOT seems doubtful. Nevertheless, by serving as a marker for tissue viability, sodium MRI may obviate the need to estimate SOT, opening the way for a more patient-specific treatment regime, perhaps via a combination of sodium and diffusion MRI. Normal and reduced sodium levels are a good indicator for still-viable tissue.
Acknowledgments
Dr Friedrich Wetterling acknowledges funding from the School of Physics and the Faculty of Engineering (Marie Curie Fellowship, SYSWIND) at the Trinity College Dublin as well as financial postdoctoral fellowship support from the University of Heidelberg.
The authors declare no conflict of interest.
Footnotes
This work was funded by the Science Foundation Ireland (grant numbers “06/RFP/PHY006” and “06/RFP/PHY006STTF08”).
References
- Schellinger PD, Thomalla G, Fiehler J, Kohrmann M, Molina CA, Neumann-Haefelin T, et al. MRI-Based and CT-based thrombolytic therapy in acute stroke within and beyond established time windows—an analysis of 1210 patients. Stroke. 2007;38:2640–2645. doi: 10.1161/STROKEAHA.107.483255. [DOI] [PubMed] [Google Scholar]
- Jones TH, Morawetz RB, Crowell RM, Marcoux FW, Fitzgibbon SJ, DeGirolami U, et al. Thresholds of focal cerebral ischemia in awake monkeys. J Neurosurg. 1981;54:773–782. doi: 10.3171/jns.1981.54.6.0773. [DOI] [PubMed] [Google Scholar]
- Barreto AD, Martin-Schild S, Hallevi H, Morales MM, Abraham AT, Gonzales NR, et al. Thrombolytic therapy for patients who wake-up with stroke. Stroke. 2009;40:827–832. doi: 10.1161/STROKEAHA.108.528034. [DOI] [PMC free article] [PubMed] [Google Scholar]
- Marler JR. Tissue plasminogen activator for acute ischemic stroke. N Engl J Med. 1995;333:1581–1588. doi: 10.1056/NEJM199512143332401. [DOI] [PubMed] [Google Scholar]
- Miyasaka N, Kuroiwa T, Zhao FY, Nagaoka T, Akimoto H, Yamada I, et al. Cerebral ischemic hypoxia: discrepancy between apparent diffusion coefficients and histologic changes in rats. Radiology. 2000;215:199–204. doi: 10.1148/radiology.215.1.r00ap24199. [DOI] [PubMed] [Google Scholar]
- Shen Q, Ren H, Fisher M, Bouley J, Duong T. Dynamic tracking of acute ischemic tissue fates using improved unsupervised ISODATA analysis of high-resolution quantitative perfusion and diffusion data. J Cereb Blood Flow Metab. 2004;24:887–897. doi: 10.1097/01.WCB.0000124321.60992.87. [DOI] [PMC free article] [PubMed] [Google Scholar]
- Thulborn KR, Gindin TS, Davis D, Erb P. Comprehensive MR imaging protocol for stroke management: tissue sodium concentration as a measure of tissue viability in nonhuman primate studies and in clinical studies. Radiology. 1999;213:156–166. doi: 10.1148/radiology.213.1.r99se15156. [DOI] [PubMed] [Google Scholar]
- Tsang A, Stobbe R, Asdaghi N, Hussain MS, Bhagat Y, Beaulieu C, et al. Relationship between sodium intensity and perfusion deficits in acute ischemic stroke. J Magn Reson Imaging. 2011;33:41–47. doi: 10.1002/jmri.22299. [DOI] [PubMed] [Google Scholar]
- Tsang A, Stobbe R, Hussain S, Bhagat Y, Beaulieu C, Emery D, et al. Sodium Image Intensity Increases in Ischemic Core Tissue, but not Penumbra in Acute and Sub-Acute Stroke. In Stroke Journal of the American Heart Association: San Diego; 2009. [Google Scholar]
- LaVerde GC, Jungreis CA, Nemoto E, Boada FE. Sodium time course using 23Na MRI in reversible focal brain ischemia in the monkey. J Magn Reson Imaging. 2009;30:219–223. doi: 10.1002/jmri.21723. [DOI] [PubMed] [Google Scholar]
- Bartha R, Lee TY, Hogan MJ, Hughes S, Barberi E, Rajakumar N, et al. Sodium T2*-weighted MR imaging of acute focal cerebral ischemia in rabbits. Magn Reson Imaging. 2004;22:983–991. doi: 10.1016/j.mri.2004.02.004. [DOI] [PubMed] [Google Scholar]
- Jones SC, Kharlamov A, Yanovski B, Kim DK, Easley KA, Yushmanov VE, et al. Stroke onset time using sodium MRI in rat focal cerebral ischemia. Stroke. 2006;37:883–888. doi: 10.1161/01.STR.0000198845.79254.0f. [DOI] [PubMed] [Google Scholar]
- Wetterling F, Gallagher L, Macrae IM, Junge S, Fagan AJ. Regional and temporal variations in tissue sodium concentration during the acute stroke phase. Magn Reson Med. 2012;67:740–749. doi: 10.1002/mrm.23031. [DOI] [PubMed] [Google Scholar]
- Yushmanov VE, Kharlamov A, Yanovski B, LaVerde G, Boada FE, Jones SC. Inhomogeneous sodium accumulation in the ischemic core in rat focal cerebral ischemia by Na-23 MRI. J Mag Reson Imaging. 2009;30:18–24. doi: 10.1002/jmri.21816. [DOI] [PMC free article] [PubMed] [Google Scholar]
- Boada FE, Qian Y, Nemoto E, Jovin T, Jungreis C, Jones SC, et al. Sodium MRI and the assessment of irreversible tissue damage during hyper-acute stroke. Transl Stroke Res. 2012;3:236–245. doi: 10.1007/s12975-012-0168-7. [DOI] [PubMed] [Google Scholar]
- Wang Y, Hu W, Perez-Trepichio AD, Ng TC, Furlan AJ, Majors AW, et al. Brain tissue sodium is a ticking clock telling time after arterial occlusion in rat focal cerebral ischemia. Stroke. 2000;31:1386–1391. doi: 10.1161/01.str.31.6.1386. [DOI] [PubMed] [Google Scholar]
- Wetterling F, Högler M, Molkenthin U, Junge S, Gallagher L, Mhairi Macrae I, et al. The design of a double-tuned two-port surface resonator and its application to in vivo Hydrogen- and Sodium-MRI. J Magn Reson. 2012;217:10–18. doi: 10.1016/j.jmr.2012.02.002. [DOI] [PubMed] [Google Scholar]
- Tyson RL, Sutherland GR, Peeling J. 23Na nuclear magnetic resonance spectral changes during and after forebrain ischemia in hypoglymeci, normoglymic, and hyperglymic rats. Stroke. 1996;27:957–964. doi: 10.1161/01.str.27.5.957. [DOI] [PubMed] [Google Scholar]
- Wetterling F, Ansar S, Handwerker E. Sodium-23 magnetic resonance imaging during and after transient cerebral ischemia: multinuclear stroke protocols for double-tuned 23 Na/ 1 H resonator systems. Phys Med Biol. 2012;57:6929. doi: 10.1088/0031-9155/57/21/6929. [DOI] [PubMed] [Google Scholar]
- Schepkin VD, Ross BD, Chenevert TL, Rehemtulla A, Sharma S, Kumar M, et al. Sodium magnetic resonance imaging of chemotherapeutic response in a rat glioma. Magn Reson Med. 2005;53:85–92. doi: 10.1002/mrm.20332. [DOI] [PMC free article] [PubMed] [Google Scholar]
- Winter PM, Bansal N. TmDOTP5- as a Na-23 shift reagent for the subcutaneously implanted 9 L gliosarcoma in rats. Magn Reson Med. 2001;45:436–442. doi: 10.1002/1522-2594(200103)45:3<436::aid-mrm1057>3.0.co;2-6. [DOI] [PubMed] [Google Scholar]
- Baskerville TA, McCabe C, Weir CJ, Macrae IM, Holmes WM. Noninvasive MRI measurement of CBF: evaluating an arterial spin labelling sequence with Tc-99m-HMPAO CBF autoradiography in a rat stroke model. J Cereb Blood Flow Metab. 2012;32:973–977. doi: 10.1038/jcbfm.2012.19. [DOI] [PMC free article] [PubMed] [Google Scholar]
- Longa EZ, Weinstein PR, Carlson S, Cummins R. Reversible middle cerebral-artery occlusion without craniectomy in rats. Stroke. 1989;20:84–91. doi: 10.1161/01.str.20.1.84. [DOI] [PubMed] [Google Scholar]
- Paxinos G, Watson C. The rat brain in stereotaxic coordinates/George Paxinos, Charles Watson. Elsevier: Amsterdam; 2007. [Google Scholar]
- McCabe C, Gallagher L, Gsell W, Graham D, Dominiczak AF, Macrae IM. Differences in the evolution of the ischemic penumbra in stroke-prone spontaneously hypertensive and Wistar-Kyoto rats. Stroke. 2009;40:3864–3868. doi: 10.1161/STROKEAHA.109.559021. [DOI] [PMC free article] [PubMed] [Google Scholar]
- Santosh C, Brennan D, McCabe C, Macrae IM, Holmes WM, Graham DI, et al. Potential use of oxygen as a metabolic biosensor in combination with T2*-weighted MRI to define the ischemic penumbra. J Cereb Blood Flow Metab. 2008;28:1742–1753. doi: 10.1038/jcbfm.2008.56. [DOI] [PMC free article] [PubMed] [Google Scholar]
- LaVerde G, Nemoto E, Jungreis CA, Tanase C, Boada FE. Serial triple quantum sodium MRI during non-human primate focal brain ischemia. Magn Reson Med. 2007;57:201–205. doi: 10.1002/mrm.21087. [DOI] [PubMed] [Google Scholar]
- Jansen MA, Van Emous JG, Nederhoff MGJ, Van Echteld CJA. Assessment of myocardial viability by intracellular Na-23 magnetic resonance Imaging. Circulation. 2004;110:3457–3464. doi: 10.1161/01.CIR.0000148132.15105.0E. [DOI] [PubMed] [Google Scholar]
- Heiler PM, Langhauser FL, Wetterling F, Ansar S, Grudzenski S, Konstandin S, et al. Chemical shift sodium imaging in a mouse model of thromboembolic stroke at 9.4 T. J Magn Reson Imaging. 2011;34:935–940. doi: 10.1002/jmri.22700. [DOI] [PubMed] [Google Scholar]
- Burstein D, Fossel ET. Intracellular sodium and lithium NMR relaxation times in the perfused frog heart. Magn Reson Med. 1987;4:261–273. doi: 10.1002/mrm.1910040307. [DOI] [PubMed] [Google Scholar]
- Madelin G, Regatte RR. Biomedical applications of sodium MRI in vivo. J Magn Reson Imaging. 2013;38:511–529. doi: 10.1002/jmri.24168. [DOI] [PMC free article] [PubMed] [Google Scholar]
- Konstandin S, Nagel A. Measurement techniques for magnetic resonance imaging of fast relaxing nuclei. Magn Reson Mater Phys Biol Med. 2014;27:5–19. doi: 10.1007/s10334-013-0394-3. [DOI] [PubMed] [Google Scholar]
- van Emous JG, van Echteld CJA. Changes of intracellular sodium T2 relaxation times during ischemia and reperfusion in isolated rat hearts. Magn Reson Med. 1998;40:679–683. doi: 10.1002/mrm.1910400505. [DOI] [PubMed] [Google Scholar]
- Thulborn KR, Davis D, Adams H, Gindin T, Zhou J. Quantitative tissue sodium concentration mapping of the growth of focal cerebral tumors with sodium magnetic resonance imaging. Magn Reson Med. 1999;41:351–359. doi: 10.1002/(sici)1522-2594(199902)41:2<351::aid-mrm20>3.0.co;2-h. [DOI] [PubMed] [Google Scholar]