Abstract
Rationale and Objectives
Pulmonary vascular control mechanisms are complex and likely to differ between species. We wish to quantify regional perfusion and the effects of gravity using computed tomography.
Materials and Methods
Sequential density measurements following the administration of a bolus of iodinated contrast medium were acquired from four healthy human subjects and four dogs.
Results
In humans, perfusion (Q) was linear throughout most of the range of vertical height, with an overall gradient of −2.6% cm−1. However, when perfusion was normalized to “tissue” density (blood plus tissue: sQt), maximum perfusion occurred around the mid-range of vertical height, being 9% (range 1–22%) greater than either the dorsal or ventral extreme. Within discrete transverse axial sections, concentric zones of perfusion centered on blood vessels were demonstrated. The relationship between sQt and vertical height in dogs was distinctly linear, with a gradient of −7.2% cm−1. In dogs, the median gradient of Q was −13.6% cm−1 (range −9.7 to −17.1%).
Conclusions
Differences in regional pulmonary perfusion, particularly the vertical gradient observed in humans and dogs, may in part reflect anatomic differences between the symmetric dichotomous branching structure of the human pulmonary vasculature and the more asymmetrical structure found in dogs.
Keywords: Pulmonary circulation, image processing, computer assisted
The mechanisms that regulate pulmonary vascular control are poorly understood, but assume therapeutic significance in patients with clinical conditions characterized by ventilation perfusion (V/Q) mismatch, such as pulmonary embolism and the acute respiratory distress syndrome. Regional pulmonary perfusion has been studied using radioactive tracers (1–3), positron emission tomography (PET) (4,5), single positron emission computed tomography (6,7), and magnetic resonance imaging (8). Computed tomography (CT), despite its superior spatial resolution and shorter acquisition times, has not been as fully explored (9 –11). Previous studies of pulmonary perfusion in humans using CT have been limited to discrete sampling at defined regions of interest (ROIs), and revealed increased perfusion to dependent lung regions (9,10,12), but were not analyzed on a pixel-by-pixel basis. The aims of this study were twofold. First, using four-dimensional CT, regional pulmonary perfusion was characterized in conscious, normal human subjects, to identify the effect of gravity on perfusion gradients in the normal lung. Second, previously acquired data from dogs using the same methodology (11) were reanalyzed using the technical modifications necessary in human subjects. This allowed interspecies comparisons to identify differences that might relate to the different vascular branching patterns in the two species. Quadrupeds have been used extensively to study pulmonary perfusion, and inference has been drawn to perfusion in humans, although equivalence of their pulmonary physiology has not been demonstrated.
MATERIALS AND METHODS
Study Subjects
Volunteer studies were performed in six male human subjects between the ages of 30 and 48 years) at the Royal Brompton Hospital, London, UK. All subjects were nonsmokers and self-reported to be healthy. Males were chosen to avoid exposure of breast tissue to radiation. The protocol was approved by local institutional board review, and all subjects provided informed written consent. All animal studies were performed within guidelines for animal care stipulated by the American Physiological Society and the National Institutes of Health. Dogs evaluated in this study are reported in Chon et al and preparation details are provided in that study (11). Studies were approved by the University of Pennsylvania Institutional Animal Care and Use Committee.
Study Design
The study methodology was based on the Fick principle that perfusion is equivalent to the arteriovenous difference in concentration of an indicator, as used in other CT perfusion studies (10,13,14). ROIs were placed over the pulmonary parenchyma and a feeding blood vessel. A gamma variate curve, which models the indicator washout, was fitted to serial density measurements (in Hounsfield units [HU]) of each ROI during the passage of a bolus of iodinated contrast medium. Pulmonary perfusion is given by:
where ΔHUt = the difference between baseline and peak density in the tissue ROI (HU) and AUCa = the area under the time attenuation curve of the feeding vessel (HU). Thus, perfusion is measured as blood flow per unit voxel, and is independent of the volume of the ROI sampled. This method assumes negligible contrast washout from the parenchymal ROI before peak opacification (15).
This expression then describes perfusion per spatial volume (Q). To obtain a measure of tissue perfusion, the calculated perfusion for each voxel was divided by the measured “water” fraction, as detailed elsewhere (15). This denominator was chosen in preference to tissue fraction as it is accurately determined from direct measurement of radiologic density. In contrast, tissue fraction (calculated as the difference between “water” fraction and blood) is less robust because a small error in either results in negative tissue value. To express perfusion per tissue/blood mass (sQt), the result was multiplied by the known density of lung parenchyma (1.050 g/mL−1).
METHODS
Scanning Protocol
For all studies, a C150L electron beam CT scanner was used (Imatron Inc., San Francisco, CA). Images for volunteer and animal studies were obtained simultaneously at eight contiguous levels (6-mm section width) over a total transaxial width of 76 mm, at 140 kVp, 120 mA, and an acquisition time of 100 ms. A field of view of 35 cm was used with a resolution of 360 × 360 pixels, so that each pixel was approximately 1 × 1 × 6 mm. Volunteers received a radiation dose of 3.3 mSv, equivalent to 1.6 years of background radiation exposure.
Volunteers
Subjects were positioned supine on the scanning table, head first through the gantry, and a localization scan performed during an inspiratory breathhold. An eight-level scan was then performed likewise, with the third of eight images (counted in a caudad direction) centered on the bifurcation of the pulmonary artery.
Peripheral rather than central venous administration of contrast was employed. To mitigate against the greater bolus dispersion occurring during the longer vascular transit consequent on injection via a peripheral venous cannula, a small volume of more concentrated contrast (40 mL, 350 mg iodine/mL iohexol, injected at 10 mL/sec−1 via a 14-gauge cannula placed in the antecubital vein) was used. A series of 15 cardiac-gated images was obtained, with each exposure performed at a point 80% of the way through the cardiac cycle, timed from the upstroke of the R wave. The first scan in the sequence commenced simultaneously with the contrast injection, with subsequent acquisitions every heartbeat for 11 heartbeats, and thereafter every second heartbeat for a further three heartbeats. Images in volunteer studies were obtained during an inspiratory breathhold, under which conditions apnea is better tolerated (16).
Animals
Anesthetized dogs were positioned supine on the scanner table, head first through the gantry. For the pulmonary blood flow studies in the ventilated dogs, an eight-level scan was performed with lungs held at functional residual capacity with the most cranial image acquired at the level of the carina during automated injection of contrast (1 mL/kg body weight of iohexol 240 mg iodine mL−1) at 20 mL/sec−1. Image acquisition was cardiac gated, one being obtained before contrast injection, and nine subsequently. Further details of the imaging protocol are given in the study of Chon et al (11).
Data Analysis
The acquired data were exported from the electron beam computed tomographic storage disk to a PC where files were converted into the Analyze format using the Pulmonary Analysis Software Suite (17) and then imported into the VIDA (18) Time Series Image Analysis module (19) where all analysis was performed. A ROI was drawn to encompass both lungs using a mouse-controlled video cursor to trace around the chest wall and cardiac borders to exclude the major hilar vessels. A second ROI was placed within the main pulmonary artery for acquisition of an inflow function. A third ROI was placed in a pulmonary vein to measure tissue washout before peak tissue opacification.
A gamma variate was fitted (20) to both opacification curves to exclude any secondary opacification peak arising from recirculation of contrast within the observational time frame. The following parameters were calculated and returned within a text file: goodness of fit of gamma variate to tissue opacification (chi squared), fractional air content of the lung, fractional blood content of the lung, fractional tissue content of the lung, perfusion (Q), perfusion normalized to water content (sQt), time of arrival of the contrast bolus (arrival time), time to peak of bolus (rise time), peak CT value.
Sampling
Compared to the animal studies, bolus dispersion in human subjects produced a lower amplitude signal, with relatively greater noise, and less fits were possible. Therefore, a modified sampling technique was adopted for the human data. Both means of sampling were used in animal studies to validate the modified method.
Animal Studies
A matrix with square size 5 × 5 pixels was superimposed on the pulmonary ROI, and mean data derived for each square from its constituent pixels as per Chon et al (11). A second analysis was then performed, equivalent to that used in humans. In this method, a sampling square 5 × 5 pixels was translated around the pulmonary lung field by movements of a single pixel, therefore resulting in as many observations as there were pixels in the ROI. Thus, the perfusion value calculated for each pixel was the mean of 25 surrounding pixels.
Humans
In human subjects, the noisier data resulted in a reduction in the number of curve fits when a sampling square of 5 × 5 (the matrix used by Chon et al in the dogs) (11). Trial of various grid sizes showed that a sampling square of 11 × 11 pixels produced the most curve fits (21).
Filtering
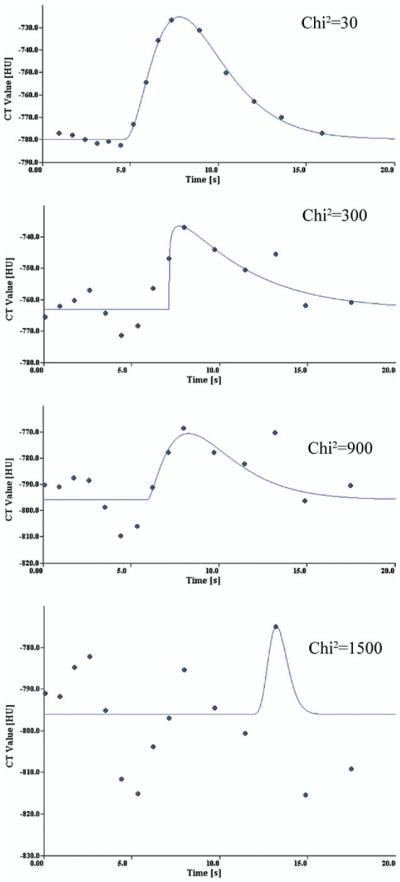
Selection criteria based on constituent fractions of air, tissue, and blood, mean transit time, and arrival time were employed to ensure that ROIs encompassed predominantly lung parenchyma. Because volunteer scans were performed after a tidal inspiration, and had a greater air fraction, modification of these criteria was necessary. Preliminary analysis (21) demonstrated that pixels with an air fraction greater than the 90th centile for that scan corresponded to airways, and likewise with a blood fraction greater than the 90th centile to vessels. Observation points for which the chi-squared value of the gamma variate fit was greater than 1,500 were excluded as graphic examination of a range of curve fits and associated chi-square values showed poor reliability of data beyond this value (Fig 1).
Figure 1.
Specimen curve fits for a range of chi-squared values. Each figure illustrates a gamma variate fit typical of the given chisquared value.
Statistical Analysis
The text file containing imaging and physiologic data was imported into Splus (Insightful, Inc., Seattle, WA) for analysis. Summary data for each lung were expressed as the mean of each grid square within the pulmonary ROI. Comparisons between subgroups were made by the Wilcoxon matched pairs signed-rank sum test. Plots of perfusion against vertical height were made suitable for comparison by binning the vertical axes values into 100 gradations.
RESULTS
Volunteers
Perfusion studies were performed in six normal human volunteers, but two were excluded from further analysis because of unstable baseline attenuation. There was a general trend throughout all scans for the density of the parenchyma to decrease over the duration of the baseline precontrast images. The early tissue washout measurements, calculated as the proportion of the contrast bolus that was present in the venous ROI before peak tissue opacification, for each subject were 5.3, 6.8, 8.7, 8.3, 16.8, and 24.6%. Minimal tissue washout is an assumption of the model, and those scans with values of greater than 10% were deemed unacceptable, and excluded from further analysis. The mean early tissue washout in the remaining four subjects was 7.2%. Subject demographic data are shown in Table 1.
Table 1.
Subject Demographic Data
| MC | EM | LP | SS | Mean | |
|---|---|---|---|---|---|
| Age (y) | 30 | 33 | 35 | 30 | 34 |
| Mass (kg) | 73 | 89 | 76 | 81 | 82 |
| Height (m) | 1.82 | 1.83 | 1.68 | 1.83 | 1.81 |
The mean number of observations recorded for each of the remaining subjects after filtration was 77,000. Points for which the chi-square value of the fit of the gamma variate to the tissue opacification curve exceeded 1,500 were removed; examples of such fits are shown in Fig 1, including one with a chi-square value greater then 1,500, two within the cutoff and a good fit. The spatial distribution of such points was uniform throughout both lung fields. The distribution of perfusion values in this group was such as to contain an excess of low perfusion outliers, but as the numbers were small (0.3–3% of the total number of observations within each individual) removal of these data had negligible effect of the mean value of perfusion measured, and no effect on the spatial distribution of perfusion. Topographic maps of the distribution of air fraction (Fair), Q, and sQt are shown in Figure 2. Basic radiologic and physiologic parameters are shown in Table 2.
Figure 2.
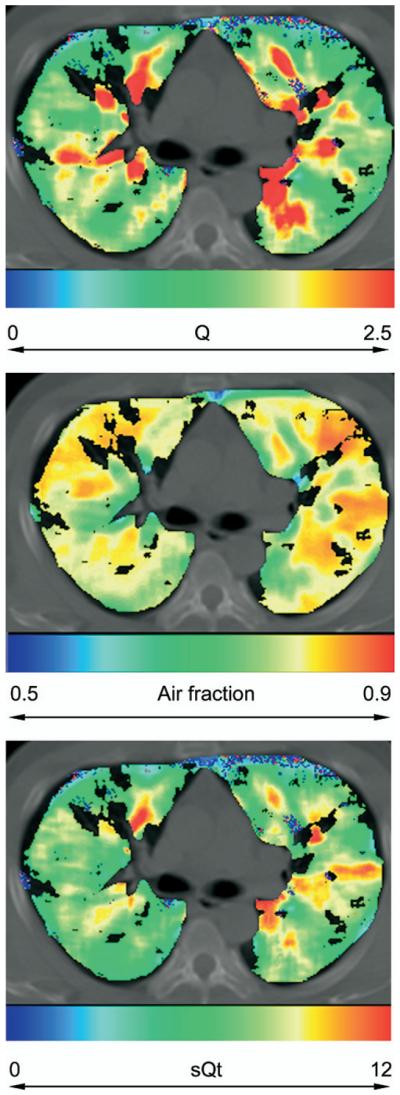
Distribution of (a) perfusion (Q/mL/min−1/mL−1), (b) air fraction, and (c) normalized perfusion (sQt/mL/min−1/g−1) in a volunteer subject (L.P.).
Table 2.
Radiologic and Physiologic Parameters
| Dog |
|||
|---|---|---|---|
| Human | Adjacent Grid | Overlapping Grid | |
| N | 76,515 | 2,163 | 60,503 |
| Baseline | −745 | −663 | −665 |
| Opacification | 37 | 123 | 124 |
| Chi-squared | 83 | 139 | 136 |
| MTT | 0.3 | 6.1 | −91.2 |
| Rise time | 3.3 | 2.1 | 2 |
| Fair | 0.75 | 0.66 | 0.67 |
| Q | 1.5 | 2.4 | 2.4 |
| sQt | 5.6 | 6.8 | 6.6 |
n, number of gamma variate fits; baseline, baseline attenuation before opacification with contrast (Hounsfield units); opacification, difference between baseline and peak attenuation during opacification (Hounsfield units); chi-squared, goodness of fit of gamma variate to tissue opacification/time curve; MTT, mean transit time of contrast bolus in tissue ROI; rise time, time of arrival of contrast bolus in tissue ROI; Fair, air fractional content of tissue ROI; Q, perfusion; sQtm, perfusion normalized to “water” fraction; ROI, region of interest.
Data are intersubject means of radiologic and physiologic parameters.
Mean sQt for each lung was calculated as the mean for each square of the grid covering the parenchymal ROI. There was no significant difference between the group mean sQt for the right and left lungs (5.5 vs. 5.6 mL/min−1/g−1). There was no difference between mean sQt on different slices in the cephalocaudal (z) axis (Fig 3).
Figure 3.
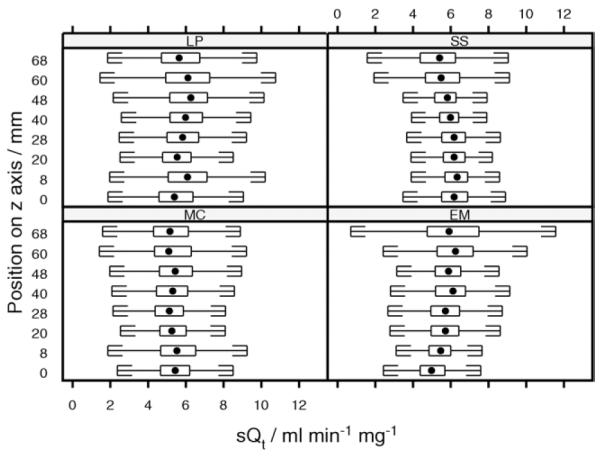
Distribution of normalized perfusion (sQt) along the z axis for human scans. Box and whisker plots show the distribution of values of sQt measured within each z axial plane. Central dot, median value, extremes of box indicate upper and lower quartiles. Whiskers are drawn at a standard span from each quartile. The slice at 20 mm was positioned on the pulmonary artery bifurcation, with other slices reading caudally.
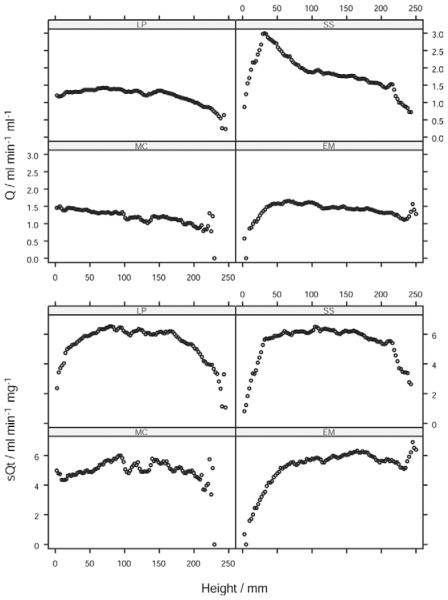
The plot of Q against vertical height (Fig 4) was linear throughout most of the range of height, flattening or falling slightly in the dorsal extreme (r2 = 0.87, 0.04, 0.60, 0.62 for scans of the volunteer subjects M.C., E.M., L.P., S.S.). When the perfusion data for all eight axial slices of lung were pooled, Q increased from ventral to dorsal with an overall gradient of −2.6% cm−1. However, the plot of sQt against vertical height showed a maximum around the midpoint of vertical height, with lower perfusion both above and below (Fig 4). To confirm this, each lung was divided into three equal-sized zones with respect to vertical height: ventral, middle, and dorsal, and the mean sQt calculated for each. sQt for the middle zone (6.0 mL/min−1/g−1) was greater than that in either the dorsal (5.6 mL/min−1/g−1, P = .05, n = 8) or ventral extreme (5.4 mL/min−1/g−1, P = .008 Wilcoxon). Thus, sQt was 9% greater in the midrange of vertical height than that at the extremity. Regression analysis was not undertaken because of the nonlinear nature of this relationship. The distribution of perfusion was further examined by dividing data from single slices of individual scans into eight octiles with respect to sQt. The topographic distribution of each octile was plotted within the outline of the hemithorax (Fig 5). It was seen that points with approximately equal perfusion fell into circumferential isoperfusion lines centered on blood vessels.
Figure 4.
Distribution of perfusion along the vertical axis in humans. Distribution of Q/perfusion (upper panel) and sQt/normalized perfusion (lower panel) along the vertical axis in volunteer subjects.
Figure 5.
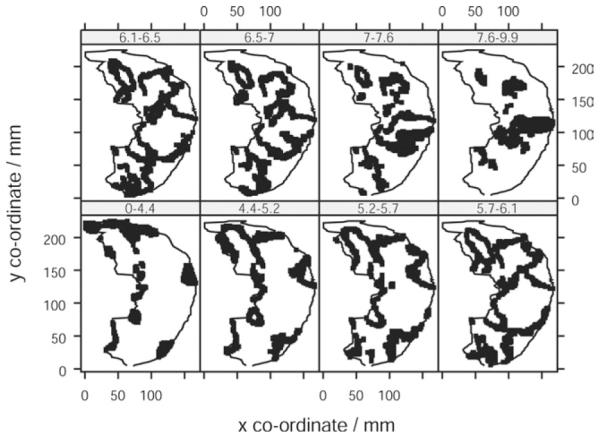
Topographic distribution of iso-sQt points in human lung. Topographic distribution of iso-sQt points (points with equal normalized perfusion) in human lung. Each plot represents an octile in the distribution of values of sQt. The points plotted are those whose sQt lies within the range indicated on the panel header strip (mL/min−1/g−1). The lung outline indicated within each panel is the same slice of the left lung subject (L.P.).
Dogs
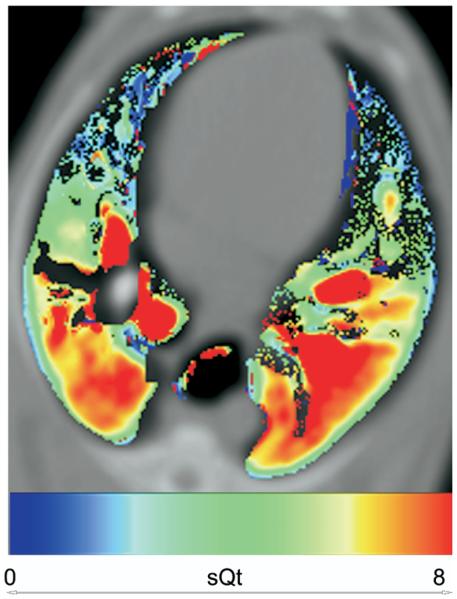
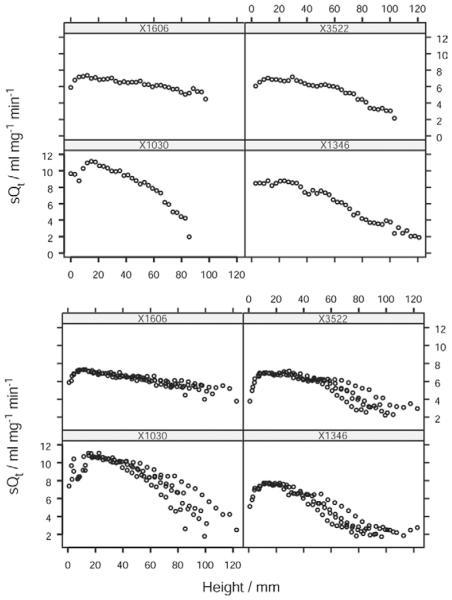
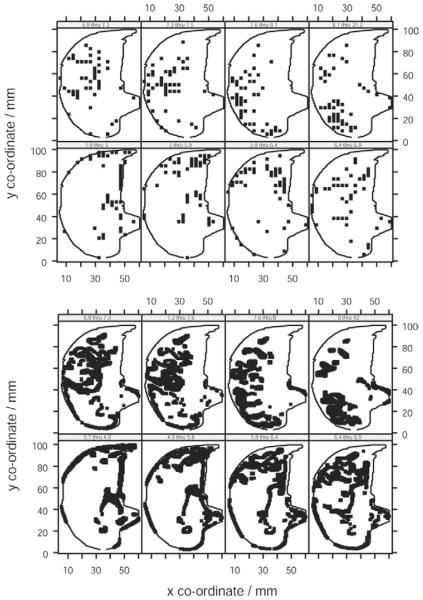
The air fraction in dogs was lower than that in human subjects (0.63 vs. 0.75), in keeping with image acquisition at functional residual capacity (FRC) rather than at full inspiration (Table 2). The distribution of sQt against vertical height in dogs was linear across most of the range of vertical height, with a minor falloff in the most dependent region of the lung (Figs 6 and 7). When plots of the data obtained by the overlapping and nonoverlapping translational methods were compared, there was no visible difference in the form of the relationship (Fig 8). The median gradient of the lines of fit of the binned sQt data against vertical height (obtained by the nonoverlapping translational method) was −7.2% cm−1 (range −4.2 to −9.0). The equivalent median gradient for Q was −13.6% cm−1 (range −9.7 to −17.1). Other parameters of the linear regression are shown in Table 3. The median coefficient of variation of sQt was 0.28 (range 0.22–0.57). When the distribution of sQt was examined by octile, as mentioned previously, it was seen to be maximal at a point in the center of the dorsal lung, corresponding to where the main dorsal artery passed through the axial section. sQt reduced progressively toward the periphery of the ventral lung (Fig 8).
Figure 6.
Color map showing distribution of normalized perfusion (sQt mL/min−1/g−1) in a supine dog.
Figure 7.
Distribution of sQt along the vertical axis in dogs. Distribution of normalized perfusion (sQt) along the vertical axis in dogs using nonoverlapping (upper panel) and overlapping (lower panel) translational methods of sampling. Each plot within the trellis represents a different animal subject.
Figure 8.
Topographic distribution of iso sQt points in dog lungs. Topographic distribution of iso sQt points (points with equal normalized perfusion) in dog lungs using nonoverlapping (upper panel) and overlapping (lower panel) translational methods of sampling. Each plot within the trellis represents an octile in the distribution of values of sQt. The points plotted are those whose sQt lies within the range indicated on the panel header strip (mL/min−1/g−1). The lung outline indicated within each panel is the same slice of the left lung of one subject.
Table 3.
Derived Parameters for Linear Regression of Q on Vertical Height for Dog Studies
| Subject | Intercept | Gradient | r 2 | P |
|---|---|---|---|---|
| X1030 | 11.8 | −9.1 | 0.76 | 0 |
| X1346 | 9.9 | −9.6 | 0.95 | 0 |
| X1606 | 7.3 | −3.2 | 0.75 | <10−5 |
| X3522 | 7.8 | −7.1 | 0.83 | 0 |
| Median | 8.85 | −8.1 | 0.8 | 0 |
DISCUSSION
There were three principal findings from these studies. First, no overall gravitational sQt gradient was identified in supine humans, although the middle segment of the lung has greater perfusion than that ventral and dorsal in the transaxial plane. Second, when the perfusion data from human studies are examined by individual transverse plane, points with approximately equal perfusion occur in iso-sQt lines, which form circumferentially around blood vessels. Third, and in contrast, the relationship between sQt and vertical height in dogs is approximately linear, with a gradient of −7.2% cm−1.
Methodologic Considerations
The theoretical and experimental bases of dye dilution measurements of blood flow are established (11,12). The fluctuating baseline attenuation seen in some human subjects, but not animal, studies represents a methodologic problem, resulting in the discarding of two datasets, and some degradation of data quality in other subjects. At its extreme, this was of the order of 30 HU, equating to an increase in air fraction of 3%. Dogs were imaged at FRC, which is widely used in perfusion studies for its easy reproducibility without the need for measurement. We chose to scan volunteers during an inspiratory breathhold to facilitate comparison patients with lung disease, in whom apnea is more consistent at the end inspiration (16). Imaging at the higher lung inflation than was used in dogs in this study would, if anything, accentuate any vertical gradient in pulmonary perfusion; thus, the reduced gradient in humans found in this study is given greater significance. Anesthesia has not been shown to have any consistent effect on the distribution of pulmonary perfusion (22,23).
Regional Distribution of Perfusion
Raw perfusion (Q) increased from ventral to dorsal lung regions, flattening or falling slightly in the dorsal extreme, with an overall gradient of −2.6% cm−1, in keeping with the generally accepted model of pulmonary perfusion (1). Gradients of perfusion that increased by 4 –14% for every centimeter below the right ventricular border have been reported using PET (24,25). Mean compositional values in humans were similar to those obtained by others using PET (blood = 0.16, air = 0.73, tissue = 0.10), although, the mean Q of 1.5 mL/min−1/g−1 was slightly lower (1.92 mL/min−1/g−1) (5). When data from the present studies were normalized to the water fraction, to make account of partial volume effects where vascular structures encroach on alveoli, a significant reduction in perfusion was seen in the dorsal half of the lung, so that the plot of perfusion against vertical height assumed an “n-shaped” form, which was more apparent in the prone than the supine position (11). Although such an extensive volume of Zone IV contrasts with some other work in which perfusion data were not normalized has been described in other studies (24,25), the distribution of perfusion is similar to that found at FRC in an early study performed on erect volunteers (1), which established the existence of the fourth zone in the most dependent portion of the lung. It was postulated by the authors that the gravitational increase in perfusion seen through West zones 1–3 reached a maximum toward the lung bases in erect humans, before declining again in zone 4 from the compressive effect of the overlying parenchyma on the pulmonary vasculature. Because those data were expressed per unit of lung tissue, they may be considered analogous to our own. Although a zone of reduced perfusion in the basal regions of primate lungs is apparent on the plots produced from microsphere experiments, application of linear regression to those data showed an overall increase in perfusion of 8.8% per centimeter of vertical height of lung (26). In the present studies, gravity had a relatively small effect upon perfusion, accounting for an increase in sQt of the order of 10% between the ventral or dorsal segments at a peak that occurred approximately midway between the two extremes.
Intraregional Distribution of Perfusion
When the topographic distribution of sQt within an axial plane was examined, concentric isoperfusion bands were seen, suggesting that perfusion was greater in the periarterial region. However, such a phenomenon could not be predicted from a simple analysis of the human pulmonary vascular anatomy, which best conforms to a model of symmetric dichotomy (27). Thus, the pulmonary parenchyma immediately adjacent to a conducting vessel is not therefore supplied directly by that vessel, but lies many dichotomous generations downstream.
Ex vivo studies in dogs have demonstrated spatial correlation of pulmonary perfusion (28). Spatial correlation is characteristic of an underlying fractal nature. Such a pattern of perfusion has been attributed to the locally shared heritage of a pulmonary vascular tree. Thus, those regions that have common parent branches will be more likely to have similar magnitudes of flow. In contrast, those regions that are distantly related through the tree will be more likely to have disparate magnitudes of flow. A detailed microspheres study divided the lungs of primates into 1,500 sections that were labeled according to a three-dimensional reference system, allowing for a matrix of approximately 10 × 10 on each transverse plane, which is probably inadequate to detect such variation (26). Recent PET studies have been acquired within a 40-sec breathhold, but still have a comparatively large pixel size of 12 × 12 mm (24). The images presented from the latter studies had isolated hotspots, suggesting a patchy distribution of perfusion, but the smoothing algorithms used for presentation of data appeared to eliminate these features. The overlapping grid technique used for sampling perfusion in volunteers precludes estimation of spatial correlation demonstrated previously (28), and this calculation was not performed. However, if isoperfusion points fall into concentric rings, then there are more points close together with similar perfusion than there are far apart, suggesting that such correlation may exist.
Comparison of Human Data to Animal Species
In the present studies, perfusion increased linearly in the ventral to dorsal plane in dogs in the supine position, which is consistent with the classical model of pulmonary perfusion traditionally believed to apply in humans. The large zone four visible in the human studies was not present in dogs, despite image acquisition in canine studies at a smaller lung volume. Moreover, there was considerably less vertical gradient in humans, a finding of particular significance because it has previously been shown that vertical gradients in regional perfusion are accentuated at higher lung volumes in dogs (29).
In summary, we have shown the pattern of regional pulmonary perfusion observed in human and canine species to be different. Although our studies confirm the established finding that pulmonary perfusion in dogs has a strong gravitational bias, a predominantly arteriocentric pattern was observed in humans, with a weak gravitational bias (despite imaging the lungs at a volume above FRC) countered by an extensive area in which zone four conditions apply. Anatomic differences in the pulmonary vasculature between species may be in part responsible for the differences observed.
ACKNOWLEDGMENTS
We gratefully acknowledge the assistance of Chulho Won and Hidenori Shikata with VIDA, and Blake Robinswood for statistical advice.
Supported in part by Grants NIH-RO1-HL-064368 and HL-060158 from the National Institutes of Health, Bethesda, MD; J.D. was supported by the Doverdale Fellowship, Royal Brompton and Harefield NHS Trust, London, UK, for the duration of his work; E.A.H. is a shareholder in VIDA Diagnostics, which markets the Pulmonary Analysis Software Suite used in this work.
REFERENCES
- 1.Hughes JM, Glazier JB, Maloney JE, et al. Effect of lung volume on the distribution of pulmonary blood flow in man. Respir Physiol. 1968;4:58–72. doi: 10.1016/0034-5687(68)90007-8. [DOI] [PubMed] [Google Scholar]
- 2.Anthonisen NR, Milic-Emili J. Distribution of pulmonary perfusion in erect man. J Appl Physiol. 1966;21:760–766. doi: 10.1152/jappl.1966.21.3.760. [DOI] [PubMed] [Google Scholar]
- 3.Kaneko K, Milic-Emili J, Dolovich MB, et al. Regional distribution of ventilation and perfusion as a function of body position. J Appl Physiol. 1966;21:767–777. doi: 10.1152/jappl.1966.21.3.767. [DOI] [PubMed] [Google Scholar]
- 4.Brudin LH, Rhodes CG, Valind SO, et al. Relationships between regional ventilation and vascular and extravascular volume in supine humans. J Appl Physiol. 1994;76:1195–1204. doi: 10.1152/jappl.1994.76.3.1195. [DOI] [PubMed] [Google Scholar]
- 5.Brudin LH, Rhodes CG, Valind SO, et al. Regional lung density and blood volume in nonsmoking and smoking subjects measured by PET. J Appl Physiol. 1987;63:1324–1334. doi: 10.1152/jappl.1987.63.4.1324. [DOI] [PubMed] [Google Scholar]
- 6.Sanchez-Crespo A, Petersson J, Nyren S, et al. A novel quantitative dual-isotope method for simultaneous ventilation and perfusion lung SPET. Eur J Nucl Med Mol Imaging. 2002;29:863–875. doi: 10.1007/s00259-002-0803-8. [DOI] [PubMed] [Google Scholar]
- 7.Bajc M, Bitzen U, Olsson B, et al. Lung ventilation/perfusion SPECT in the artificially embolized pig. J Nucl Med. 2002;43:640–647. [PubMed] [Google Scholar]
- 8.Levin DL, Chen Q, Zhang M, et al. Evaluation of regional pulmonary perfusion using ultrafast magnetic resonance imaging. Magn Reson Med. 2001;46:166–171. doi: 10.1002/mrm.1172. [DOI] [PubMed] [Google Scholar]
- 9.Wolfkiel CJ, Rich S. Analysis of regional pulmonary enhancement in dogs by ultrafast computed tomography. Invest Radiol. 1992;27:211–216. doi: 10.1097/00004424-199203000-00006. [DOI] [PubMed] [Google Scholar]
- 10.Jones AT, Hansell DM, Evans TW. Pulmonary perfusion in supine and prone positions: an electron-beam computed tomography study. J Appl Physiol. 2001;90:1342–1348. doi: 10.1152/jappl.2001.90.4.1342. [DOI] [PubMed] [Google Scholar]
- 11.Chon D, Beck KC, Larsen RL, et al. Regional pulmonary blood flow in dogs by 4D-X-ray CT. J Appl Physiol. 2006;101:1451–1465. doi: 10.1152/japplphysiol.01131.2005. [DOI] [PubMed] [Google Scholar]
- 12.Wu X, Latson LA, Wang T, et al. Regional pulmonary perfusion estimated by high-speed volume scanning CT. Am J Physiol Imaging. 1988;3:73–80. [PubMed] [Google Scholar]
- 13.Wolfkiel CJ, Ferguson JL, Chomka EV, et al. Measurement of myocardial blood flow by ultrafast computed tomography. Circulation. 1987;76:1262–1273. doi: 10.1161/01.cir.76.6.1262. [DOI] [PubMed] [Google Scholar]
- 14.Jones AT, Hansell DM, Evans TW. Pulmonary perfusion quantified by electron-beam computed tomography: effects of hypoxia and inhaled NO. Eur Respir J. 2003;21:855–861. doi: 10.1183/09031936.03.00085002. [DOI] [PubMed] [Google Scholar]
- 15.Georgiou D, Wolfkiel C, Brundage BH. Ultrafast computed tomography for the physiological evaluation of myocardial perfusion. Am J Card Imaging. 1994;8:151–158. [PubMed] [Google Scholar]
- 16.Noble MI, Eisele JR, Frankel HL, et al. The role of the diaphragm in the sensation of holding the breath. Clin Sci. 1971;41:275–283. doi: 10.1042/cs0410275. [DOI] [PubMed] [Google Scholar]
- 17.Reinhardt J, Guo J, Zhang M. Integrated system for objective assessment of global and regional lung structure. In: Viergever M, editor. Lecture notes in computer science. Springer-Verlag; Utrecht: 2001. pp. 1384–1385. [Google Scholar]
- 18.Hoffman EA, Gnanaprakasam D, Gupta KB, et al. VIDA: an environment for multi-dimensional image display and analysis. SPIE Proc Biomed Image Proc 3D Microsc. 1992;1660:694–711. [Google Scholar]
- 19.Won C, Chon D, Tajik J, et al. CT-based assessment of regional pulmonary microvascular blood flow parameters. J Appl Physiol. 2003;94:2483–2493. doi: 10.1152/japplphysiol.00688.2002. [DOI] [PubMed] [Google Scholar]
- 20.Press WH, Flannery BP, Teukolsky SA, et al. Numerical recipes: the art of scientific computing (Fortran version) Cambridge University Press; Cambridge: 1989. [Google Scholar]
- 21.Dakin J. Critical Care unit of the National Heart & Lung Institute. Imperial College London; London: 2004. Quantification of pulmonary perfusion using electron beam computed tomography; p. 260. [Google Scholar]
- 22.Hulands GH, Greene R, Iliff LD, et al. Influence of anaesthesia on the regional distribution of perfusion and ventilation in the lung. Br J Anaesth. 1969;41:789–790. [PubMed] [Google Scholar]
- 23.Landmark SJ, Knopp TJ, Rehder K, et al. Regional pulmonary perfusion and V/Q in awake and anesthetized-paralyzed man. J Appl Physiol. 1977;43:993–1000. doi: 10.1152/jappl.1977.43.6.993. [DOI] [PubMed] [Google Scholar]
- 24.Musch G, Layfield JD, Harris RS, et al. Topographical distribution of pulmonary perfusion and ventilation, assessed by PET in supine and prone humans. J Appl Physiol. 2002;93:1841–1851. doi: 10.1152/japplphysiol.00223.2002. [DOI] [PubMed] [Google Scholar]
- 25.Brudin LH, Rhodes CG, Valind SO, et al. Interrelationships between regional blood flow, blood volume, and ventilation in supine humans. J Appl Physiol. 1994;76:1205–1210. doi: 10.1152/jappl.1994.76.3.1205. [DOI] [PubMed] [Google Scholar]
- 26.Glenny RW, Bernard S, Robertson HT, et al. Gravity is an important but secondary determinant of regional pulmonary blood flow in upright primates. J Appl Physiol. 1999;86:623–632. doi: 10.1152/jappl.1999.86.2.623. [DOI] [PubMed] [Google Scholar]
- 27.Weibel ER. Design of airways and blood vessels considered as branching trees. In: Crystal R, Barnes PJ, West JB, et al., editors. The lung: scientific foundations. Lippincott, Williams & Wilkins; Philadelphia, PA: 1997. pp. 1061–1071. [Google Scholar]
- 28.Glenny RW. Spatial correlation of regional pulmonary perfusion. J Appl Physiol. 1992;72:2378–2386. doi: 10.1152/jappl.1992.72.6.2378. [DOI] [PubMed] [Google Scholar]
- 29.Pattekar M. Department of Physiological Imaging. University of Iowa; Iowa: 1997. Role of right ventricle in pulmonary blood flow distribution. [Google Scholar]


