

Background: The physiological role of trehalose as a hemolymph sugar during insect development remains unclear.
Results: Mutants of the trehalose-synthesizing enzyme Tps1 failed to produce trehalose.
Conclusion: Drosophila larvae lacking the hemolymph sugar trehalose exhibit diet-dependent phenotypes of growth and survival.
Significance: Tps1 mutant flies are particularly useful in unraveling a wide range of physiological processes, such as homeostasis, aging, and stress resistance.
Keywords: Development, Drosophila, Drosophila Metabolism, Glucose Metabolism, Glycogen, Insulin, Blood Sugar, Trehalose
Abstract
Living organisms adapt to environmental changes through metabolic homeostasis. Sugars are used primarily for the metabolic production of ATP energy and carbon sources. Trehalose is a nonreducing disaccharide that is present in many organisms. In insects, the principal hemolymph sugar is trehalose instead of glucose. As in mammals, hemolymph sugar levels in Drosophila are regulated by the action of endocrine hormones. Therefore, the mobilization of trehalose to glucose is thought to be critical for metabolic homeostasis. However, the physiological role of trehalose as a hemolymph sugar during insect development remains largely unclear. Here, we demonstrate that mutants of the trehalose-synthesizing enzyme Tps1 failed to produce trehalose as expected but survived into the late pupal period and died before eclosion. Larvae without trehalose grew normally, with a slight reduction in body size, under normal food conditions. However, these larvae were extremely sensitive to starvation, possibly due to a local defect in the central nervous system. Furthermore, Tps1 mutant larvae failed to grow on a low-sugar diet and exhibited severe growth defects on a low-protein diet. These diet-dependent phenotypes of Tps1 mutants demonstrate the critical role of trehalose during development in Drosophila and reveal how animals adapt to changes in nutrient availability.
Introduction
Animal development and physiology are modulated by a wide variety of environmental factors, such as light, temperature, and food availability, and adaptation to changes in nutrition often involves hormonal regulation and metabolic homeostasis. In mammals, systemic regulation by insulin and glucagon maintains circulating glucose levels during fluctuating nutritional conditions (1). Upon feeding, elevated circulating glucose is taken up by several tissues (such as liver, adipose, and muscle tissues) through the action of insulin. In contrast, starvation promotes lipid mobilization, glycogen breakdown, and gluconeogenesis through the action of glucagon.
Sugars are used primarily for the metabolic production of ATP energy and carbon sources. Trehalose is a nonreducing disaccharide that is present in several organisms, including bacteria, yeast, fungi, plants, and invertebrates (2, 3). Because of its unique chemical properties, trehalose has the advantage of protecting organisms against several environmental stresses in general, such as cold, oxidation, anoxia, and desiccation (3, 4). Trehalose is the major hemolymph sugar in most insects (5). It is synthesized in the fat body, an organ that is analogous to the mammalian liver and adipose tissue, and is released into the hemolymph (6, 7). Trehalose is synthesized from glucose by the trehalose-6-phosphate (Tre-6-P)4 synthase Tps1, which is thought to be a cytoplasmic protein and has two functionally distinct catalytic domains (3). The N-terminal TPS (Tre-6-P synthase) domain catalyzes the production of Tre-6-P using glucose 6-phosphate and UDP-glucose. The C-terminal TPP (Tre-6-P phosphatase) domain then dephosphorylates Tre-6-P to generate trehalose. As in mammals, hemolymph sugar levels in Drosophila are regulated by the action of two endocrine hormones, Drosophila insulin-like peptides (Dilps) and glucagon-like peptide (adipokinetic hormone (Akh)). Genetic manipulation of the function of Dilps and Akh alters trehalose levels in the circulating hemolymph (8–13). Therefore, the mobilization of trehalose to glucose is believed to be critical for metabolic homeostasis. However, the physiological role of trehalose as an energy source during insect development remains largely unclear.
Here, we directly demonstrate the essential role of trehalose in Drosophila. Our characterization of the Tps1 mutant phenotype and its reliance on environmental conditions provides a basis for the further understanding of the physiological role of hemolymph sugar in an insect model.
EXPERIMENTAL PROCEDURES
Drosophila Strains
The following stocks were used: w1118 (used as a control) and Tps1k08903 (from the Bloomington Drosophila Stock Center, no. 10838). Tps1 RNAi lines were obtained from the National Institute of Genetics Drosophila RNAi Center. The following stocks were obtained from the Bloomington Drosophila Stock Center: Tps1MI03087, Df(2L)BSC295 (a deficiency of the Tps1 locus), FRT40A, ovoD1-18 FRT40A, Tub-Gal4, Repo-Gal4, Mef2-Gal4, CG-Gal4, Elav-Gal4, and Myo1A-Gal4.
Characterization and Generation of Tps1 Mutants
A transposable P-element insertion (P{lacW}k08903) from the Bloomington Drosophila Stock Center was back-crossed four times with the w− control strain. The resulting P-element line was used to generate Tps1 mutants by imprecise excision. The progeny were first screened for the loss of an eye color marker (w+), and the extent of the deletion in each mutant was determined by PCR and subsequent DNA sequencing. Tps1d1 has a deletion of 1372 bp, resulting in the lack of amino acids 44–294 of the coding region. Tps1d2 has a deletion of 2331 bp, resulting in the lack of amino acids 44–594 of the coding region. Homozygotes and heterozygotes were assessed by the presence of a fluorescent marker on a balancer chromosome (CyO). Because metabolic parameters are affected by food conditions, heterozygous mutants in the same vials were used as an internal control for homozygous mutants in some experiments. To generate maternal and zygotic mutants of Tps1, germ line clones were made by flippase-mediated recombination with the stock ovoD1-18 FRT40A.
Plasmid Construction
The cDNA encoding Tps1 was cloned by RT-PCR using sequenced strains obtained from the Bloomington Drosophila Stock Center and was subcloned into the pUAST vector. Transformants were obtained by a standard injection method (BestGene Inc.).
Fly Food, Quantification of Weight, and Starvation Experiments
The detailed food compositions are described in Table 1. Developmental staging and quantification of weight were performed as described previously (14). For the transient starvation experiments, early third-instar larvae were washed with PBS and transferred to a vial that contained 0.8% agar in PBS. The percentage of puparium formation and adult flies was determined by counting homozygotes and heterozygotes in the same vials as an internal control. All experiments were conducted under uncrowded conditions. No yeast paste was added to the fly tubes for any of the experiments.
TABLE 1.
Food composition
| Food | Yeast | Corn flour | Glucose | Agar | Propionic acid | Butylparaben (15% ) |
|---|---|---|---|---|---|---|
| g/100 ml | g/100 ml | g/100 ml | g/100 ml | ml/100 ml | ml/100 ml | |
| Normal food (1×) | 4.5 | 4 | 10 | 0.8 | 0.4 | 0.3 |
| YC food | 4.5 | 4 | 0.8 | 0.4 | 0.3 | |
| Yeast only | 10 | 0.8 | 0.4 | 0.3 | ||
| 1/3× yeast | 1.5 | 4 | 10 | 0.8 | 0.4 | 0.3 |
| 1/5× yeast | 0.9 | 4 | 10 | 0.8 | 0.4 | 0.3 |
| 2× glucose | 4.5 | 4 | 20 | 0.8 | 0.4 | 0.3 |
| Y10 + G10 | 10 | 10 | 0.8 | 0.4 | 0.3 | |
| Y10 + G3 | 10 | 3 | 0.8 | 0.4 | 0.3 | |
| Y10 + G0 | 10 | 0.8 | 0.4 | 0.3 | ||
| Y20 + G3 | 20 | 3 | 0.8 | 0.4 | 0.3 | |
| Y1 + G10 | 1 | 10 | 0.8 | 0.4 | 0.3 | |
| Y10 + G20 | 10 | 20 | 0.8 | 0.4 | 0.3 |
Y, yeast level; G, glucose level.
qRT-PCR Analysis
qRT-PCR analyses was done as described previously (15). Primers used in this study are listed in Table 2.
TABLE 2.
Primers used for qRT-PCR analyses
All sequences are from 5′ to 3′.
| Primer | Sequences |
|---|---|
| Tps1 | |
| Forward | TCCGATGAGATCCTACAGGGTATG |
| Reverse | CGCCATGTTCCACCAGCAGATTG |
| sTreh | |
| Forward | ATTAGCCGCGTGAATTGTCCAGTG |
| Reverse | TCCTCGTCGACGGGAATGGCATTG |
| cTreh | |
| Forward | CTCCAGCGAATCCATCGAGCAATC |
| Reverse | CATCATGGCATTAAAGTCCTCGAG |
| Tret1-1 | |
| Forward | ATGTCTCCGACATCGCCATGGTTC |
| Reverse | TCACCCATCATCAGCCAGGGAATG |
| Tret1-2 | |
| Forward | ATCCGACATCGCCATGATCGTGAC |
| Reverse | GTTGAAAGCCGTGACCACCGATGC |
| dilp2 | |
| Forward | ACGAGGTGCTGAGTATGGTGTGCG |
| Reverse | CACTTCGCAGCGGTTCCGATATCG |
| dilp3 | |
| Forward | GTCCAGGCCACCATGAAGTTGTGC |
| Reverse | CTTTCCAGCAGGGAACGGTCTTCG |
| dilp5 | |
| Forward | TGTTCGCCAAACGAGGCACCTTGG |
| Reverse | CACGATTTGCGGCAACAGGAGTCG |
| dilp6 | |
| Forward | TGCTAGTCCTGGCCACCTTGTTCG |
| Reverse | GGAAATACATCGCCAAGGGCCACC |
| InR | |
| Forward | TGAGCATGTGGAGCACATCAAGATG |
| Reverse | CGTAGGAGATTTTCTCGTTTGGCTG |
| Thor/4EBP | |
| Forward | TGATCACCAGGAAGGTTGTCATCTC |
| Reverse | GAGCCACGGAGATTCTTCATGAAAG |
| Akh | |
| Forward | CGTCCAGTGTCAATTGACCTTCTC |
| Reverse | AGCAGCATTTCGTTGGAGGTCTTG |
| AkhR | |
| Forward | TTCAACTCGTTCAGGAGCGACTTTG |
| Reverse | AGATGAACATGATCAGCGGAAAGGC |
| Fas | |
| Forward | CTCCACCATCGAGGAGTTCA |
| Reverse | CTTGAGCTTGCCAATCCTGT |
| ACC | |
| Forward | GGCTATGCTGCGCTTAACA |
| Reverse | GCCTCTGTTTTGTGGGTGAC |
| mondo | |
| Forward | GCGGCGTTACAACATAAAGA |
| Reverse | CTCCATGCGCAAAGCTTCAA |
| mlx | |
| Forward | GCCAAGTTTCAAGTGTTCCAG |
| Reverse | CTCCAGCCAGGGGATAATG |
Measurement of Protein, Triacylglycerol, and Sugar Levels
Samples were rinsed several times with PBS to remove all traces of food. The defined number of samples was collected (100 dechorionated embryos, 20 early second-instar larvae, six early third-instar larvae, four mid third-instar larvae, two late third-instar larvae, two pupae, and two adult flies). Frozen samples in tubes were homogenized using a pellet pestle in 100 μl of cold PBS containing 0.1% Triton X-100, immediately heat-inactivated at 80 °C for 10 min, and then cooled to room temperature. Ten μl of the homogenate was mixed with 10 μl of a triglyceride reagent (Sigma), incubated at 37 °C for >30 min, and cleared by centrifugation. Ten μl of the supernatant was used for the measurement of triacylglycerol (TAG) by free glycerol reagent (Sigma). The untreated remaining homogenate was cleared by centrifugation and used for the measurement of free glycerol and the determination of protein contents using a BCA assay (Thermo Scientific). A triolein equivalent glycerol standard (Sigma) was used as the standard. The TAG concentration for each sample was determined by subtracting the values of the free glycerol in the untreated samples. The amount of TAG per fly was normalized to the soluble protein level per fly. The cleared samples were further used to determine the sugar levels. Five μl of the sample was incubated with 10 μl of buffer A (5 mm Tris-HCl (pH 6.6), 137 mm NaCl, and 2.7 mm KCl) containing trehalase (Sigma) or amyloglucosidase (Roche Applied Science) overnight at 37 °C. Ten μl of the sample was incubated with 5 μl of buffer A without enzymes in parallel for the determination of glucose levels. The amount of glucose was determined using a glucose assay kit (Sigma). Trehalose and glycogen were used as standards. The trehalose and glycogen concentrations for each sample were determined by subtracting the values of free glucose in the untreated samples. The amounts of trehalose, glycogen, and glucose per fly were normalized to the soluble protein level per fly.
Measurement of ATP Levels
Samples in tubes were homogenized using a pellet pestle in 100 μl of lysis buffer (6 m guanidine HCl solution containing 0.1% Triton X-100) and immediately heat-inactivated at 100 °C for 10 min. Diluted samples were used for the determination of protein and ATP levels. The amount of ATP was determined using an ATP determination kit (Invitrogen) according to the manufacturer's instructions. The amount of ATP per fly was normalized to the soluble protein level per fly.
Food Intake
Early third-instar larvae were starved for 2 h under adverse food conditions (0.8% agar in PBS) and then transferred to fresh dye-containing food (0.5% Brilliant Blue FCF) for 10 or 20 min. After feeding, larvae were washed with PBS, dried on tissue paper, and homogenized in 100 μl of lysis buffer. After boiling and centrifugation, 2 μl of supernatant was analyzed in a spectrophotometer at 630 nm. A small amount of dye-containing food was weighed, processed as described above, and used as a standard to calculate the amount of ingested food.
Hemolymph Sample Preparation
Larvae were collected, rinsed with PBS, and dried on tissue paper. The cuticle was carefully torn to release the hemolymph on a Parafilm membrane. For the measurement of sugar levels, 2 μl of hemolymph was collected using a micropipette, diluted 20 times with cold buffer A, and cleared by centrifugation. The supernatant was boiled at 80 °C for 10 min and cleared by centrifugation again. Two and 6 μl of sample were used for the measurement for trehalose and glucose, respectively, as described above. The hemolymph trehalose concentration was determined by subtracting the value of free glucose in the untreated samples.
Immunohistochemistry
Larval tissues were dissected in PBS, fixed for 10 min in 3.7% formaldehyde in PBS containing 0.2% Triton X-100, and processed as described previously (16). The following primary antibodies were used: mouse anti-phospho-histone H3 and rabbit anti-cleaved caspase-3 (Cell Signaling Technology) and rabbit anti-Foxo antibodies (provided by P. Léopold). Alexa-conjugated secondary antibodies and phalloidin (Invitrogen) were used. The nuclei were stained with Hoechst 33342 (Invitrogen). For staining acidic organelles, including autolysosomes, larval tissues were dissected in PBS, incubated with 100 nm LysoTracker Red (Invitrogen) in PBS containing Hoechst 33342 for 2 min, washed twice with PBS, and mounted in 50% glycerol in PBS. Images were acquired with a Zeiss LSM 700 confocal microscope and were processed using Photoshop (Adobe Systems).
Histochemistry
For staining neutral lipids, larval tissues were dissected in PBS, fixed using 3.7% formaldehyde in PBS for 20 min, and washed twice with PBS. Samples were incubated with 0.18% Oil Red O solution (Sigma) in 60% isopropyl alcohol for 20 min at room temperature, washed twice with PBS, and mounted in 50% glycerol in PBS. For staining polysaccharides, including glycogen, larval tissues were dissected in 1% BSA in PBS, fixed using 3.7% formaldehyde in PBS for 20 min, washed twice with 1% BSA in PBS, incubated with periodic acid solution (Merck) for 5 min, and washed twice with 1% BSA in PBS. Samples were stained with Schiff's reagent (Merck) for 15 min, washed twice with 1% BSA in PBS, and mounted in 50% glycerol in PBS. Images were acquired with a Zeiss Primo Star microscope equipped with a Zeiss AxioCam ERc camera.
RESULTS
Change in Amount of Trehalose during Development
To understand the importance of trehalose as a hemolymph sugar, we first compared the amount of trehalose with the amount of the storage sugar glycogen and the storage lipid TAG during development (Fig. 1A). Trehalose was almost undetectable in the early embryo (0–2 h), whereas there were detectable levels of glycogen and TAG. The amount of trehalose increased significantly during the embryonic period; by contrast, the amounts of glycogen and TAG decreased during embryonic development, as reported previously (17, 18). These results suggest that during the early stages of embryonic development, stored glycogen and TAG, rather than trehalose, are used primarily as energy sources. The amounts of trehalose, glycogen, and TAG increased during the larval period as body mass and total protein amounts increased. The amount of trehalose then decreased significantly during the pupal period, indicating that trehalose is consumed during pupal development. Alternatively, the production of trehalose ceases during pupal development because the steady-state level is determined by the balance between synthesis and consumption. In contrast, glycogen and TAG gradually decreased during the pupal period, with ∼50% still remaining in the late pupa before eclosion.
FIGURE 1.

Developmental changes in the amount of trehalose and tissue distribution of trehalose metabolic genes. A, changes in the amounts of protein, trehalose, glycogen, and TAG during development under normal food conditions. The amount of protein indicates the soluble fraction in PBS containing 0.1% Triton X-100 after heat inactivation. The amounts of trehalose, glycogen, and TAG per fly were normalized to the soluble protein level per fly. The inset in the Protein panel is the close-up view during the embryonic stage. new adult indicates newly eclosed adult; 1w adult indicates 1-week-old adult after eclosion. B, metabolic pathway of trehalose synthesis and hydrolysis. C, the tissue distribution of gene transcripts related to trehalose metabolism was analyzed by qRT-PCR in mid third-instar larvae. CNS, central nervous system; FB, fat body; ID, imaginal discs; MT, Malpighian tubule; CA, carcass. Relative gene expression levels in each tissue are shown. Total values were set to 100. All values are means ± S.D. (n = six batches (A) or n = 3 (C)).
Because trehalose is present in the circulating hemolymph, we next analyzed the tissue distribution of the trehalose-synthesizing enzyme Tps1 and the trehalose hydrolase Treh (Fig. 1B). Consistent with the FlyAtlas database and previous reports (6, 7), qRT-PCR analysis revealed that Tps1 was specifically expressed in the fat body in mid third-instar larvae (Fig. 1C). Treh in Drosophila is produced in two different forms by alternative splicing variants: a putative secreted form (sTreh) with a signal peptide at the N terminus and a cytoplasmic form (cTreh) without a signal peptide. sTreh was expressed mainly in the gut and also in several other tissues, whereas cTreh was expressed mainly in the Malpighian tubules and in proliferating tissues, such as the central nervous system and imaginal discs. The bidirectional trehalose transporter Tret1-1 was expressed mainly in the fat body, as previously reported (19). A related gene, Tret1-2, was expressed in several tissues, including the central nervous system, imaginal discs, and Malpighian tubules. These results indicate that the sites of trehalose synthesis and catabolism are different.
Tps1 Is Required for the de Novo Synthesis of Trehalose
It has been reported that a P-element insertion into the Tps1 locus (originally named P838) leads to lethality at an early larval stage (20). The identical P-element allele obtained from the Bloomington Drosophila stock center (renamed k08903) indeed displayed this early larval lethality (Fig. 2A). However, we found that a transheterozygote of the P-element with a deficiency allele lacking the Tps1 locus survived the larval period and died at the late pupal stage. Therefore, we backcrossed the P-element line with control flies several times. Homozygous mutants of the backcrossed Tps1k08903 (hereafter named Tps1lacW) displayed lethality in the pharate adult (Fig. 2B), suggesting that second-site mutation(s) in the original P-element line are responsible for the observed lethality at the early larval stage.
FIGURE 2.

Tps1 mutants fail to produce trehalose and show lethality at the late pupal stage. A, schematic representation of the Tps1 locus and molecular nature of the mutants. Protein-coding regions and untranslated regions are represented by black boxes and white boxes, respectively. The P-element insertion sites are marked with inverted triangles. B, Tps1lacW homozygous mutants are lethal at the pharate adult stage. APF, after puparium formation. C, Tps1 mutants reduce trehalose levels at the late third-instar larval stage. D, trehalose levels in the hemolymph were analyzed in late third-instar larvae of the indicated genotypes. E, Tps1 expression was analyzed by qRT-PCR in mid third-instar larvae. F, Tps1MIC is a hypomorphic allele. The percentage of adult flies was determined by the ratio to flies with a balancer chromosome in each vial. All values are means ± S.D. (n > 6 (C, D, and F) or n = 4 (E)).
To confirm the mutant phenotype of Tps1, we generated Tps1 deletion mutants by imprecise excision of Tps1lacW. We obtained precise excision lines that were fully viable and two deletion lines, Tps1d1 and Tps1d2 (Fig. 2A). Tps1d1 lacks the N-terminal half of the TPS domain. Tps1d2 lacks the entire TPS domain and an N-terminal part of the TPP domain. Two independent deletion mutants showed complete lethality at the pharate adult stage. We observed similar results in a transheterozygote of the deletion mutants with the deficiency allele, suggesting that both the backcrossed P-element allele and deletion mutants are genetically null. Furthermore, maternal and zygotic mutants of Tps1lacW and Tps1d2 survived into the pupal period and exhibited identical lethality, as did the zygotic mutants. These results indicate that Tps1 is not required for embryonic development. To further characterize the Tps1 mutants, we next analyzed trehalose levels. Tps1 mutant larvae exhibited almost undetectable levels of trehalose at the late third-instar larval stage (Fig. 2C). Consistently, trehalose levels in the hemolymph of the Tps1 mutants were nearly undetectable (Fig. 2D), indicating that Tps1 is required for trehalose synthesis.
We also examined the mutant phenotype of an available Minos transposon in the Tps1 locus (MI03087; hereafter named Tps1MIC). The transposon is inserted in the 5′-untranslated region just before the first methionine of Tps1 (Fig. 2A). Homozygous Tps1MIC mutant larvae showed partially reduced expression of Tps1 (Fig. 2E). Consistent with the expression levels, the Tps1MIC mutants exhibited partially reduced trehalose levels compared with the Tps1lacW mutants (Fig. 2D), and adult escapers were observed (Fig. 2F), indicating that Tps1MIC is a hypomorphic allele. Although the reason remains unknown, male flies showed severe lethality during pupal period compared with female flies in the Tps1 hypomorphic mutants.
Tps1 Functions Exclusively in the Fat Body and Is Required for Adult Eclosion
To examine the role of Tps1 in the fat body, we next conducted tissue-specific knockdown analyses. Consistent with the fat body-restricted expression of Tps1 (Fig. 1C), knockdown of Tps1 by CG-Gal4, a fat body Gal4 driver, significantly reduced Tps1 expression and trehalose levels (Fig. 3, A and B). The knockdown flies underwent puparium formation but failed to eclose at the late pupal stage (Fig. 3C). Other tissue-specific Gal4 drivers, such as Mef2-Gal4 (muscle), Repo-Gal4 (glia), Elav-Gal4 (neurons), and Myo1-Gal4 (midgut enterocyte), which do not drive expression in the fat body, had no obvious phenotypic effects and produced viable adults. These results indicate that Tps1 functions to synthesize trehalose predominantly in the fat body. Because the loss of trehalose causes lethality in the late pupa, we assessed the consequence of the overproduction of trehalose. The ubiquitous overexpression of Tps1 by Tub-Gal4 caused early larval or embryonic lethality, as reported previously (20). However, the overexpression of Tps1 in the fat body did not result in larval lethality. As expected, trehalose levels were significantly increased, although glycogen and glucose levels were unchanged (Fig. 3B). Nevertheless, the overexpression of Tps1 caused lethality soon after or during eclosion (Fig. 3C). These results suggest that the precise regulation of trehalose metabolism, rather than its amount, is important for adult eclosion and viability.
FIGURE 3.
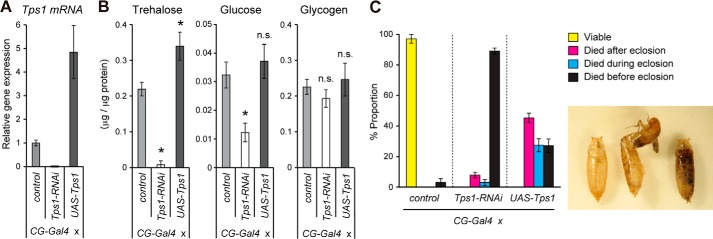
Knockdown and overexpression phenotype of Tps1. A, Tps1 transcript levels were analyzed by qRT-PCR at the mid third-instar stage of the indicated genotypes. B, trehalose, glucose, and glycogen levels were analyzed in late third-instar larvae of the indicated genotypes. C, the knockdown of Tps1 showed lethality in late pupae, whereas the overexpression of Tps1 showed lethality during or after adult eclosion. The percentages of flies at the indicated criteria are shown. The typical phenotype of the lethality during and before eclosion is shown on the right. All values are means ± S.D. (n = 4 (A and B) or n = five vials (C)). Statistical significance was determined by two-tailed Student's t test (*, p < 0.05). n.s., not significant.
Impact of Lack of Trehalose on Larval Development under Normal Food Conditions
To dissect the physiological role of trehalose during development, we focused on the larval period because nutritional conditions can be controlled. We first analyzed the mutant phenotype in detail under normal food conditions. The Tps1 mutant larvae grew almost normally and underwent puparium formation, similar to the control larvae. The body weight of the Tps1 mutant larvae was ∼9–12% lower than that of controls (Fig. 4A). Consistent with this, the Tps1 mutant pupae were ∼5–8% smaller. We also detected a delay in the timing of puparium formation of ∼10–12 h (Fig. 4B). These results suggest that Tps1 mutants exhibit minor but detectable defects in larval growth under normal food conditions.
FIGURE 4.

Impact of lack of trehalose on larval development under normal food conditions. A, both male and female Tps1 mutants are smaller than control and heterozygous mutants at the late third-instar larval stage. B, Tps1 mutants exhibit developmental delay in the timing of puparium formation. ALH, after larval hatching. The values are means ± S.E. (n = six vials). C, TAG, glycogen, and glucose levels were analyzed in late third-instar larvae of the indicated genotypes. D, Tps1 mutants show decreased glucose levels in the hemolymph at the late third-instar larval stage. E, measurement of food intake by early third-instar larvae as measured by blue food ingestion. The values are means ± S.D. (n > 15 (A), n = six (C and E), or n = four (D) batches). Statistical significance was determined by two-tailed Student's t test (*, p < 0.05). n.s., not significant.
We measured the amounts of glycogen and TAG to understand the metabolic consequences of defective trehalose synthesis in flies; however, the levels were not significantly altered in the Tps1 mutants (Fig. 4C). The expression of ACC and Fas, the rate-limiting enzymes for fatty acid synthesis, was not changed in the Tps1 mutants (Fig. 5A). Conversely, there was significantly less glucose in both the Tps1 mutants and Tps1 knockdown larvae (Figs. 3B and 4C). Circulating glucose in the hemolymph was also decreased in the Tps1 mutants (Fig. 4D). A possible explanation of this observation is that larvae lacking trehalose have impaired feeding behavior. However, we found that Tps1 mutant larvae showed a normal ingestion rate compared with control larvae (Fig. 4E). These results suggest that Tps1 mutants directly utilize dietary sugar rather than converting it into glycogen or TAG for nutrient storage.
FIGURE 5.

Loss of Tps1 alters gene expression patterns. A, the transcript levels of the indicated genes were analyzed by qRT-PCR. Early third-instar larvae (0 h) were transferred to a vial containing 0.8% agar in PBS for 16 h. The values are means ± S.D. (n = 6). Statistical significance was determined by two-tailed Student's t test (*, p < 0.05). B, Foxo localization was analyzed in the fat body. Scale bars = 20 μm.
Secreted Dilps and Akh control hemolymph sugar levels (8–13). However, it remains unknown how altered sugar metabolism inversely affects Dilp/Akh signaling. To test whether Tps1 mutants exhibit altered expression of dilp genes and insulin/insulin-like growth factor signaling (IIS), we conducted gene expression analysis in Tps1 mutants (Fig. 5A). The most prominent dilp genes (dilp2, dilp3, and dilp5) are expressed in brain neurosecretory cells known as insulin-producing cells (10, 21). We observed that dilp3 was significantly down-regulated in Tps1 mutants, suggesting that dilp3 expression is regulated by sugar levels. However, the expression of dilp2 and dilp5 was not changed in the Tps1 mutants. IIS negatively regulates the function of the transcription factor Foxo through the activation of the PI3K signaling pathway (8, 9). The expression of the Foxo target genes dilp6, InR, and Thor/4EBP was not changed, suggesting that the activity of IIS is not altered in a global manner in flies without trehalose. To further confirm these results, we analyzed the nuclear localization of Foxo. Foxo translocates from the cytoplasm into the nucleus when larvae have decreased InR-dependent PI3K activity (8, 9). As expected, nuclear localization of Foxo in the fat body was not affected in the Tps1 mutants (Fig. 5B). Nevertheless, we cannot rule out the possibility that IIS is altered by the loss of trehalose in a tissue-restricted manner.
In contrast, the expression of AkhR, but not of Akh, was slightly up-regulated (Fig. 5A). Although the regulatory mechanism of AkhR expression remains unknown, these results suggest that Akh signaling is affected in the absence of trehalose. Furthermore, we found that the expression of sTreh, but not of cTreh, was significantly down-regulated in Tps1 mutants, whereas the expression of Tret1-1 was up-regulated. These results suggest that the expression of sTreh and Tret1-1 responds to trehalose levels. The level of glucose is sensed by the conserved ChREBP (carbohydrate response element-binding protein) Mondo/Mio and its binding partner BigMax/Mlx (22). Tps1 mutants showed down-regulation of mondo, suggesting that the lower level of glucose in Tps1 mutants affects the function of glucose-sensing transcription factors. Taken together, these results demonstrate that the loss of Tps1 and trehalose causes certain defects and alters gene expression patterns, even though larvae without trehalose develop into pupae.
Tps1 Mutant Larvae Are Sensitive to Starvation
Our results revealed that trehalose is not crucial during the larval period under normal food conditions. We wondered whether nutrient-rich food masks potential defects in Tps1 mutants. To understand the role of trehalose under conditions of dietary stress, we analyzed starvation tolerance in Tps1 mutants. The control larvae survived for at least 3 days on a water-only diet, whereas almost all Tps1 mutant larvae died 1 day after starvation (Fig. 6A). The expression of both sTreh and cTreh was up-regulated, and the amount of trehalose coincidently decreased after starvation in the control larvae (Figs. 5A and 6B). These results further support the critical role of trehalose as an energy source under starvation conditions.
FIGURE 6.

Tps1 mutants exhibit severe defects in survival under fasting conditions. A, Tps1 mutants exhibit lethality under fasting conditions. Early third-instar larvae were transferred to a vial containing 0.8% agar in PBS, and the number of surviving larvae were counted at the indicated time points. B, the amounts of TAG, trehalose, and glycogen were analyzed in early third-instar larvae at the indicated time points. C, lethality in Tps1 mutant larvae after starvation is rescued by the addition of sucrose. D, Tps1 mutants do not show altered ATP levels before death under fasting conditions. All values are means ± S.D. (n > 6 (A, B, and D) or n = 4 (C)). Statistical significance is determined by two-tailed Student's t test (p < 0.05). n.s., not significant. E, Tps1 mutants show lipid mobilization after starvation similar to control larvae, as determined by the accumulation of lipid droplets in oenocytes. F, Tps1 mutants show autophagy in the fat body after starvation similar to control larvae, as determined by LysoTracker staining. G, Tps1 mutants show significant reduction of glycogen in the central nervous system after starvation, as determined by periodic acid-Schiff staining. H, Tps1 mutants reduce the number of mitotic cells and induce apoptotic cells after starvation. Scale bars = 50 μm.
We next analyzed the cause of lethality in Tps1 mutants after starvation. First, the lethality in Tps1 mutant larvae after starvation was completely suppressed by the addition of sucrose to the diet (Fig. 6C), indicating that Tps1 mutants are sensitive to the loss of sugar in their food. Second, global ATP levels in the Tps1 mutants were not apparently down-regulated 12 and 18 h after starvation, before death (Fig. 6D). Third, a detectable amount of glycogen and large amounts of TAG were still observed in the Tps1 mutants, as in the control larvae, 16 h after starvation (Fig. 6B). These results imply that the cause of death is a rapid rather than a gradual phenotype. Defects in lipid mobilization, autophagy, or altered insulin signaling result in starvation sensitivity (23–25). The accumulation of lipid droplets in oenocytes serves as a sensitive indicator of lipid mobilization in fat cells (26). The Tps1 mutants accumulated lipid droplets in oenocytes that were detected by Oil Red O staining only under fasting conditions, similar to the control larvae (Fig. 6E). These results indicate that lipid mobilization from the fat body was not affected in the Tps1 mutants. Furthermore, the formation of autophagic vesicles was induced in the Tps1 mutant fat body 4 h after starvation (Fig. 6F), suggesting that defects in autophagy are unlikely to be the cause of lethality in the Tps1 mutants. The Foxo target genes dilp6, InR, and 4EBP were up-regulated after starvation in the Tps1 mutants, whereas the expression of dilp5 was down-regulated, as in the control larvae (Fig. 5A), suggesting that IIS is not compromised in Tps1 mutants after starvation. Consistently, Foxo translocated into the nucleus after starvation in the Tps1 mutants (Fig. 5B). Taken together, these results suggest that Tps1 mutants suffer from energy production in a local manner rather than a systemic manner and that energy must be supplied from trehalose, but not from TAG.
Because both trehalose and glycogen are common energy sources of glucose, we assumed that glycogen might be utilized heavily in a local manner instead of trehalose in Tps1 mutants after starvation. We compared the tissue distribution of glycogen by histological periodic acid-Schiff staining, which primarily detects glycogen in tissues (27, 28). We found that the amount of glycogen significantly decreased in the central nervous system in Tps1 mutants only after starvation (Fig. 6G). Other tissues (such as the body wall muscles and fat body) in Tps1 mutants were indistinguishable from those in control flies. Furthermore, Tps1 mutants showed a significant reduction in the number of mitotic cells and induction of apoptotic cells in the central nervous system after starvation (Fig. 6H). These results suggest that the central nervous system is an important tissue in which sugar is critical to produce energy for survival and that problems in the brain are likely the primary cause that leads to death after starvation.
Systemic Growth of Tps1 Mutant Larvae Depends on Dietary Conditions
To further clarify the role of trehalose during development, we tested whether chronic shortage of nutrients affects the growth of Tps1 mutant larvae by limiting the sugar (glucose and corn flour) and yeast (major protein source) levels in food (Table 1). We found that the Tps1 mutant larvae failed to grow and pupariate under conditions of low dietary sugar, although the heterozygous Tps1 mutants survived into adulthood without any lethality (Fig. 7A). We confirmed these results by using food comprising only yeast and glucose because corn flour contains vitamins and minerals (Fig. 7B). Further analyses revealed lethality in the Tps1 mutants at the late second-instar and early third-instar larval stages with the yeast-only diet. In contrast, a high-sugar diet did not cause larval lethality in the Tps1 mutants (Fig. 7, A and B). These results indicate that the survival and systemic growth of Tps1 mutant larvae depend on dietary sugar. Although animals synthesize glucose from amino acids by gluconeogenesis, a 2-fold increase in dietary yeast did not rescue the low-sugar diet-induced lethality in the Tps1 mutants (Fig. 7B), suggesting that the shortage of glucogenic amino acids is unlikely to be the cause of the observed lethality. Because normal food containing glucose is sufficient to promote larval development in Tps1 mutants, enhanced gluconeogenesis and/or byproducts of amino acid catabolism appear to impair metabolic homeostasis in these mutants. Alternatively, it is possible that gluconeogenesis is not sufficient to sustain body growth in the absence of dietary sugar in larvae that are defective in trehalose synthesis.
FIGURE 7.

Chronic shortage of dietary nutrition affects survival and growth in Tps1 mutants. A and B, Tps1 mutants are sensitive to low-glucose dietary conditions. Percentages of homozygous mutant pupae were determined by the ratio to heterozygous mutants in each vial (A). A defined number of newly hatched first-instar larvae were seeded on each vial, and the number of pupae was counted (B). The percentage difference between the heterozygous mutants and homozygous mutants is shown on the right. Details of the food compositions are listed in Table 1. Y, yeast level; G, glucose level. C, Tps1 mutants show decreased body size under low-protein dietary conditions. Relative pupal volumes are shown on the right. D, Tps1 mutants exhibit developmental delay in the timing of puparium formation under low-protein dietary conditions. ALH, after larval hatching. E, shortage of dietary protein decreases IIS in Tps1 mutant larvae. The transcript levels of the indicated genes were analyzed by qRT-PCR in early third-instar larvae. The values are means ± S.E. (n = 8 (A and B) or n = 40 (C)) or means ± S.D. (n = 6 (D and E)). Statistical significance was determined by two-tailed Student's t test (*, p < 0.05).
When their food contained low levels of protein but a normal level of glucose, the Tps1 mutants displayed some lethality during the larval period, but many larvae survived to the pupal stage (Fig. 7, A and B). However, the Tps1 mutant pupae were much smaller than the control pupae (Fig. 7C). In addition, the timing of puparium formation was delayed in the Tps1 mutants (Fig. 7D). These results suggest that the growth of Tps1 mutants is sensitive to a reduction in protein levels in their food. Amino acids and dietary sugars are known to trigger the production of Dilps by insulin-producing cells through fat body-derived remote signals (29, 30). Because both size reductions and developmental delays are hallmarks of reduced IIS activity (8, 9), we analyzed the expression levels of dilp genes. The expression of dilp3 and dilp5, but not dilp2, was down-regulated in Tps1 mutants compared with heterozygous larvae in the same vials (Fig. 7E). Furthermore, the expression of the Foxo target genes dilp6, InR, and 4EBP was slightly up-regulated in Tps1 mutants, suggesting that IIS tends to decrease in Tps1 mutants under low-protein dietary conditions. Although the exact cause of the decrease in IIS and the degree to which decreased IIS is responsible for the Tps1 mutant phenotype remain unclear, it is reasonable to consider that the Tps1 mutants exhibit growth defects due to an imbalance between energy production and systemic growth with limited dietary protein. Taken together, these results indicate that trehalose metabolism is critical for survival and systemic growth in a manner that depends strongly on dietary conditions.
DISCUSSION
In the animal kingdom, trehalose was first reported in insect hemolymph over a half-century ago (5). Trehalose is thought to be an important source for production of ATP energy in flight muscles and for synthesis of glycogen that is stored in embryos (2). However, the exact role of trehalose has remained unclear because of the lack of model insects without trehalose. We reported here that trehalose is dispensable for the normal development of embryos and larvae if dietary sugar is available. Trehalose is most critical for survival under fasting conditions and is also important for body growth if dietary protein is limited. Therefore, the production of trehalose can be a crucial feature for adaptation to changes in nutrition.
The amount of trehalose is significantly increased during embryonic development. A recent metabolome analysis supports our results (17). Because trehalose is synthesized mostly in the fat body, it is likely that trehalose is detectable only after the development of the embryonic fat body. Our mutant analysis indicates that the synthesis of trehalose by Tps1 is not essential for embryonic development. It has been reported that the estrogen-related receptor regulates metabolic changes after larval hatching to utilize primarily the glycolytic pathway for energy production (18, 31). Because Tps1 mutant larvae are sensitive to starvation and a low-sugar diet, the physiological role of trehalose synthesis during the embryonic stage is likely for adaptation to dietary stress after larval hatching.
The amount of trehalose rapidly decreases after puparium formation. Nevertheless, Tps1 mutants almost complete metamorphosis and show lethality during the late pupal period. Although TAG cannot compensate for the role of trehalose under fasting conditions in survival, TAG and glycogen appear to compensate by producing ATP energy to complete metamorphosis in the absence of trehalose. It remains unknown whether the observed eclosion defects in the Tps1 mutants are caused simply by defects in global energy production. The overexpression of Tps1 causes similar defects in eclosion, suggesting that regulated trehalose metabolism is critical for eclosion. Adult eclosion is triggered by the neuropeptide hormone signaling pathway, including eclosion hormone and bursicon, and these neuropeptides are produced by a subset of neurons in the central nervous system (32, 33). Taking into account possible “local” defects in Tps1 mutants after starvation, trehalose appears to play an important role as an energy source in certain cells and tissues.
Hemolymph sugar levels, including those of trehalose and glucose, are regulated by Dilps and are therefore an important readout for understanding the systemic response of IIS by Dilps (8–10). Similarly, endocrine signaling through Akh and AkhR plays important roles in the accumulation and mobilization of storage fats and carbohydrates (11–13). However, it remains largely unknown how altered sugar metabolism inversely affects Dilp/Akh signaling and animal development. Our data demonstrate that flies without trehalose exhibit increased sensitivity to starvation and reduced tolerance to poor dietary nutrition. ChREBP/Mondo-Mlx glucose-sensing transcription factors control target gene expression in glycolysis and lipogenesis (22, 34). Larvae lacking Mondo or Mlx exhibit reduced survival on a diet containing sugar, representing dietary sugar tolerance (34). Although Tps1 mutants show altered expression of AkhR and mondo to some extent, abnormalities in fat storage, fat mobilization, and glycogen levels were not observed in these mutants. Further analyses will be required to understand how Tps1 mutants show deficits in survival and systemic growth depending on nutrient availability. It will also be important to clarify the overlapping and/or different roles of trehalose and glycogen as energy sources. It should be noted that we humans lack the gene Tps1 but retain trehalase. Trehalase is highly expressed in the kidney brush-border membranes, although the function and physiological meaning of the expression are still not clear (3). Nevertheless, a recent report identified that genetic variations in trehalase gene are associated with type 2 diabetes (35). Thus, we believe that Tps1 mutant flies lacking trehalose can be utilized as a useful tool to unravel a wide range of physiological processes, such as homeostasis, aging, and stress resistance, as well as over/undernutrition-dependent metabolic diseases.
Acknowledgments
We thank P. Léopold, S. Yoshiura, the Bloomington Drosophila Stock Center, and the National Institute of Genetics Drosophila RNAi Center for antibodies and fly stocks; Y. Yamauchi, O. Habara, and H. Kubo for technical help; N. Okamoto for sharing some materials; members of the fly laboratories at the RIKEN Center for Developmental Biology for valuable support and discussion; and N. Okamoto and T. Yasugi for critically reading the manuscript.
This work was supported in part by scientific research grants from the Ministry of Education, Culture, Sports, Science, and Technology (MEXT; to T. N.).
- Tre-6-P
- trehalose-6-phosphate
- Dilp
- Drosophila insulin-like peptide
- Akh
- adipokinetic hormone
- qRT-PCR
- quantitative RT-PCR
- TAG
- triacylglycerol
- sTreh
- secreted Treh
- cTreh
- cytoplasmic Treh
- IIS
- insulin/insulin-like growth factor signaling.
REFERENCES
- 1. Saltiel A. R., Kahn C. R. (2001) Insulin signaling and the regulation of glucose and lipid metabolism. Nature 414, 799–806 [DOI] [PubMed] [Google Scholar]
- 2. Becker A., Schlöder P., Steele J. E., Wegener G. (1996) The regulation of trehalose metabolism in insects. Experientia 52, 433–439 [DOI] [PubMed] [Google Scholar]
- 3. Elbein A. D., Pan Y. T., Pastuszak I., Carroll D. (2003) New insights on trehalose: a multifunctional molecule. Glycobiology 13, 17R–27R [DOI] [PubMed] [Google Scholar]
- 4. Crowe J. H., Carpenter J. F., Crowe L. M. (1998) The role of vitrification in anhydrobiosis. Annu. Rev. Physiol. 60, 73–103 [DOI] [PubMed] [Google Scholar]
- 5. Wyatt G. R., Kalf G. F. (1957) The chemistry of insect hemolymph. Trehalose and other carbohydrate. J. Gen. Physiol. 40, 833–847 [DOI] [PMC free article] [PubMed] [Google Scholar]
- 6. Candy D. J., Kilby B. A. (1959) Site and mode of trehalose biosynthesis in the locust. Nature 183, 1594–1595 [DOI] [PubMed] [Google Scholar]
- 7. Murphy T. A., Wyatt G. R. (1965) The enzymes of glycogen and trehalose synthesis in silk moth fat body. J. Biol. Chem. 240, 1500–1508 [PubMed] [Google Scholar]
- 8. Edgar B. A. (2006) How flies get their size: genetics meets physiology. Nat. Rev. Genet. 7, 907–916 [DOI] [PubMed] [Google Scholar]
- 9. Hietakangas V., Cohen S. M. (2009) Regulation of tissue growth through nutrient sensing. Annu. Rev. Genet. 43, 389–410 [DOI] [PubMed] [Google Scholar]
- 10. Rulifson E. J., Kim S. K., Nusse R. (2002) Ablation of insulin-producing neurons in flies: growth and diabetic phenotypes. Science 296, 1118–1120 [DOI] [PubMed] [Google Scholar]
- 11. Kim S. K., Rulifson E. J. (2004) Conserved mechanisms of glucose sensing and regulation by Drosophila corpora cardiaca cells. Nature 431, 316–320 [DOI] [PubMed] [Google Scholar]
- 12. Grönke S., Müller G., Hirsch J., Fellert S., Andreou A., Haase T., Jäckle H., Kühnlein R. P. (2007) Dual lipolytic control of body fat storage and mobilization in Drosophila. PLoS Biol. 5, e137. [DOI] [PMC free article] [PubMed] [Google Scholar]
- 13. Bharucha K. N., Tarr P., Zipursky S. L. (2008) A glucagon-like endocrine pathway in Drosophila modulates both lipid and carbohydrate homeostasis. J. Exp. Biol. 211, 3103–3110 [DOI] [PMC free article] [PubMed] [Google Scholar]
- 14. Okamoto N., Nakamori R., Murai T., Yamauchi Y., Masuda A., Nishimura T. (2013) A secreted decoy of InR antagonizes insulin/IGF signaling to restrict body growth in Drosophila. Genes Dev. 27, 87–97 [DOI] [PMC free article] [PubMed] [Google Scholar]
- 15. Okamoto N., Nishimori Y., Nishimura T. (2012) Conserved role for the Dachshund protein with Drosophila Pax6 homolog Eyeless in insulin expression. Proc. Natl. Acad. Sci. U.S.A. 109, 2406–2411 [DOI] [PMC free article] [PubMed] [Google Scholar]
- 16. Wirtz-Peitz F., Nishimura T., Knoblich J. A. (2008) Linking cell cycle to asymmetric division: Aurora-A phosphorylates the Par complex to regulate Numb localization. Cell 135, 161–173 [DOI] [PMC free article] [PubMed] [Google Scholar]
- 17. An P. N., Yamaguchi M., Bamba T., Fukusaki E. (2014) Metabolome analysis of Drosophila melanogaster during embryogenesis. PLoS ONE 9, e99519. [DOI] [PMC free article] [PubMed] [Google Scholar]
- 18. Tennessen J. M., Bertagnolli N. M., Evans J., Sieber M. H., Cox J., Thummel C. S. (2014) Coordinated metabolic transitions during Drosophila embryogenesis and the onset of aerobic glycolysis. G3 4, 839–850 [DOI] [PMC free article] [PubMed] [Google Scholar]
- 19. Kikawada T., Saito A., Kanamori Y., Nakahara Y., Iwata K., Tanaka D., Watanabe M., Okuda T. (2007) Trehalose transporter 1, a facilitated and high-capacity trehalose transporter, allows exogenous trehalose uptake into cells. Proc. Natl. Acad. Sci. U.S.A. 104, 11585–11590 [DOI] [PMC free article] [PubMed] [Google Scholar]
- 20. Chen Q., Ma E., Behar K. L., Xu T., Haddad G. G. (2002) Role of trehalose phosphate synthase in anoxia tolerance and development in Drosophila melanogaster. J. Biol. Chem. 277, 3274–3279 [DOI] [PubMed] [Google Scholar]
- 21. Ikeya T., Galic M., Belawat P., Nairz K., Hafen E. (2002) Nutrient-dependent expression of insulin-like peptides from neuroendocrine cells in the CNS contributes to growth regulation in Drosophila. Curr. Biol. 12, 1293–1300 [DOI] [PubMed] [Google Scholar]
- 22. Havula E., Hietakangas V. (2012) Glucose sensing by ChREBP/MondoA-Mlx transcription factors. Semin. Cell Dev. Biol. 23, 640–647 [DOI] [PubMed] [Google Scholar]
- 23. Scott R. C., Schuldiner O., Neufeld T. P. (2004) Role and regulation of starvation-induced autophagy in the Drosophila fat body. Dev. Cell 7, 167–178 [DOI] [PubMed] [Google Scholar]
- 24. Honegger B., Galic M., Köhler K., Wittwer F., Brogiolo W., Hafen E., Stocker H. (2008) Imp-L2, a putative homolog of vertebrate IGF-binding protein 7, counteracts insulin signaling in Drosophila and is essential for starvation resistance. J. Biol. 7, 10. [DOI] [PMC free article] [PubMed] [Google Scholar]
- 25. Palanker L., Tennessen J. M., Lam G., Thummel C. S. (2009) Drosophila HNF4 regulates lipid mobilization and β-oxidation. Cell Metab. 9, 228–239 [DOI] [PMC free article] [PubMed] [Google Scholar]
- 26. Gutierrez E., Wiggins D., Fielding B., Gould A. P. (2007) Specialized hepatocyte-like cells regulate Drosophila lipid metabolism. Nature 445, 275–280 [DOI] [PubMed] [Google Scholar]
- 27. Ruaud A. F., Lam G., Thummel C. S. (2011) The Drosophila NR4A nuclear receptor DHR38 regulates carbohydrate metabolism and glycogen storage. Mol. Endocrinol. 25, 83–91 [DOI] [PMC free article] [PubMed] [Google Scholar]
- 28. Zirin J., Nieuwenhuis J., Perrimon N. (2013) Role of autophagy in glycogen breakdown and its relevance to chloroquine myopathy. PLoS Biol. 11, e1001708. [DOI] [PMC free article] [PubMed] [Google Scholar]
- 29. Géminard C., Rulifson E. J., Léopold P. (2009) Remote control of insulin secretion by fat cells in Drosophila. Cell Metab. 10, 199–207 [DOI] [PubMed] [Google Scholar]
- 30. Rajan A., Perrimon N. (2012) Drosophila cytokine unpaired 2 regulates physiological homeostasis by remotely controlling insulin secretion. Cell 151, 123–137 [DOI] [PMC free article] [PubMed] [Google Scholar]
- 31. Tennessen J. M., Baker K. D., Lam G., Evans J., Thummel C. S. (2011) The Drosophila estrogen-related receptor directs a metabolic switch that supports developmental growth. Cell Metab. 13, 139–148 [DOI] [PMC free article] [PubMed] [Google Scholar]
- 32. McNabb S. L., Baker J. D., Agapite J., Steller H., Riddiford L. M., Truman J. W. (1997) Disruption of a behavioral sequence by targeted death of peptidergic neurons in Drosophila. Neuron 19, 813–823 [DOI] [PubMed] [Google Scholar]
- 33. Davis M. M., O'Keefe S. L., Primrose D. A., Hodgetts R. B. (2007) A neuropeptide hormone cascade controls the precise onset of post-eclosion cuticular tanning in Drosophila melanogaster. Development 134, 4395–4404 [DOI] [PubMed] [Google Scholar]
- 34. Havula E., Teesalu M., Hyötyläinen T., Seppälä H., Hasygar K., Auvinen P., Orešič M., Sandmann T., Hietakangas V. (2013) Mondo/ChREBP-Mlx-regulated transcriptional network is essential for dietary sugar tolerance in Drosophila. PLoS Genet. 9, e1003438. [DOI] [PMC free article] [PubMed] [Google Scholar]
- 35. Muller Y. L., Hanson R. L., Knowler W. C., Fleming J., Goswami J., Huang K., Traurig M., Sutherland J., Wiedrich C., Wiedrich K., Mahkee D., Ossowski V., Kobes S., Bogardus C., Baier L. J. (2013) Identification of genetic variation that determines human trehalase activity and its association with type 2 diabetes. Hum Genet. 132, 697–707 [DOI] [PMC free article] [PubMed] [Google Scholar]