

Background: The components of the cellulase induction pathway in fungi remain unclear.
Results: Identify the hypothetical protein CLP1 negatively regulates the cellulases induction through working with cellodextrin transporters CDT1 and CDT2.
Conclusion: CLP1 is a novel element of the cellulase induction pathway.
Significant: These data deepen the understanding of cellulase induction pathway and provide a new strategy to improve fungal cellulase production.
Keywords: Bioenergy, Biofuel, Cellulase, Fungi, Transporter, CLP1, Cellodextrin Transporter, Neurospora crassa
Abstract
Neurospora crassa recently has become a novel system to investigate cellulase induction. Here, we discovered a novel membrane protein, cellodextrin transporter-like protein 1 (CLP1; NCU05853), a putative cellodextrin transporter-like protein that is a critical component of the cellulase induction pathway in N. crassa. Although CLP1 protein cannot transport cellodextrin, the suppression of cellulase induction by this protein was discovered on both cellobiose and Avicel. The co-disruption of the cellodextrin transporters cdt2 and clp1 in strain Δ3βG formed strain CPL7. With induction by cellobiose, cellulase production was enhanced 6.9-fold in CPL7 compared with Δ3βG. We also showed that the suppression of cellulase expression by CLP1 occurred by repressing the expression of cellodextrin transporters, particularly cdt1 expression. Transcriptome analysis of the hypercellulase-producing strain CPL7 showed that the cellulase expression machinery was dramatically stimulated, as were the cellulase enzyme genes including the inducer transporters and the major transcriptional regulators.
Introduction
Cellulose is the acknowledged inducer of cellulase production in many fungi. However, it is insoluble and cannot be transported into the cell to induce cellulase gene expression directly. During cellulase induction, there are two stages: a basal level of cellulase expression and mass secretion of cellulases induced by soluble inducers (1). In the stage of the basal level of cellulase expression, a small amount of solid cellulose near the mycelia is degraded into a few soluble oligosaccharides such as cellulase provokers or inducers. Then the oligosaccharides enter the cell through sugar transporters to trigger the full-scale transcription of cellulase genes. Therefore, oligosaccharide transporters play critical roles in the induction of transport and downstream cellulase genes.
As yet seven oligosaccharide transporters from filamentous fungi have been shown to be involved in cellulose degradation and cellulase induction, including CDT1 and CDT2 in Neurospora crassa (2, 3), Stp1 and Crt1 in Trichoderma reesei (4), and CdtC, CdtD, and CdtG in Penicillium oxalicum (5). CDT1 and CDT2 were the first cellodextrin transporters identified to play an important role in cellulase production and cellulose degradation in N. crassa, especially CDT2. The deletion of cdt2 caused a severe growth defect in cellulose medium (2). The strain with a deletion of both cdt1 and cdt2 cannot utilize cellulose (6). Additionally, the cdt2 deletion mutant also has a severe growth defect in hemicellulose medium (6). In T. reesei, Stp1 can transport cellodextrin. However, stp1 inhibited cellulase gene expression (4). In P. oxalicum, CdtC, CdtD, and CdtG can transport cellodextrin. The deletion of cdtC and cdtD decreased cellulase gene expression and caused a growth defect on cellulose medium (5).
With respect to membrane proteins, besides the transporters that have transporting ability like CDT1 and CDT2, there are some proteins that serve as sugar sensor-like or receptor-like proteins, which also contain typical multiple transmembrane domains but lack the ability to transport sugar molecules. Proteins such as Snf3 and Rgt2 in Saccharomyces cerevisiae and RCO3 in N. crassa have been identified as glucose sensors (7–9) but have no glucose transport activity. Alternatively, there is also a group of membrane proteins that could serve as molecule sensors and transporters, called transceptors (10); the sensing and transport might not be the same molecule, for example, Crt1 in T. reesei (3, 4, 11). The detailed working mechanism of sugar transceptors is not known very well. It has been shown that the transceptor-like protein could be involved in the regulation of its homologous transporters' expression (10). CDT1 and CDT2 in N. crassa, which were recently characterized as cellodextrin transporters, might also have a role as transceptors and be involved in the induction of cellulases in N. crassa. However, how the pathway is regulated and what other components might be involved in the pathway remains unknown.
N. crassa, a model cellulosic filamentous fungus, has been a novel system for cellulose degradation and cellulase expression research since 2009 (12). Using the N. crassa system, we have a better understanding of the mechanism of cellulose, hemicellulose, pectin, and plant biomass degradation from the genome-wide level (13). Moreover, in addition to the two important cellodextrin transporters CDT1 and CDT2, a couple of novel lignocellulose degradation transcription regulators were identified from this organism, such as CLR1 (cellulose degradation regulator 1), CLR2 (cellulose degradation regulator 2) (14), XLR1 (xylan degradation regulator 1) (15), and HCR1 (hemicellulase regulator) (16). Very excitingly, after deleting the main β-glucosidase genes, cellobiose can induce cellulase production very efficiently in this engineered strain (Δ3βG), whereas cellulase induction by cellobiose was not detected in the wild-type N. crassa strain (17). The disruption strain of the major β-glucosidase genes (Δ3βG) is a very good system to investigate the cellulase induction signaling pathway.
In this study we discovered the membrane protein NCU05853, which is the closest homolog of the cellodextrin transporter CDT2, and named it cellodextrin transporter-like protein 1 (CLP1).2 CLP1 is a novel component of the cellulase induction pathway. Functionally, it cannot transport cellodextrin, but it can repress the expression of the cellodextrin transporter, inhibiting cellodextrin uptake in N. crassa. Under the Δ3βG strain background, co-disrupting clp1 and cdt2 (formed CPL7) can significantly speed up the cellulase induction and increased the cellulase production for up to 6.9-fold. The mechanism of hypercellulase production was also investigated by genome-wide analysis of the CPL7 strain on cellobiose.
EXPERIMENTAL PROCEDURES
Strains
All of the N. crassa single deletion mutants were obtained from the Fungal Genetics Stock Center (FGSC) (18, 19), including wild-type (FGSC 2489), Δcdt1 (NCU00801: FGSC 16575), Δcdt2 (NCU08114: FGSC 17869), Δncu05853 (NCU05853: FGSC 13771), and the three major β-glucosidase mutants, Δncu00130(NCU00130: FGSC 11822), Δncu04952 (NCU04952: FGSC 13731), and Δncu08755 (NCU08755: FGSC 18387). The triple deletion strain Δ3βG and multiple deletion strains with Δcdt1, Δcdt2, and/or Δncu05853 in the Δ3βG background were constructed by sequential crosses in N. crassa (20). All strains used in this study are listed in Table 1.
TABLE 1.
Strains and plasmids used in this study
| Genotype/Comment | Source | |
|---|---|---|
| Strain | ||
| N. crassa | ||
| Δ3βG | Triple deletion strain of β-glucosidase genes (gh1-1, gh3-4 and gh3-3) | This study |
| CPL2 | Δ3βGΔcdt1 | This study |
| CPL3 | Δ3βGΔcdt2 | This study |
| CPL4 | Δ3βGΔclp1 | This study |
| CPL5 | Δ3βGΔcdt1Δcdt2 | This study |
| CPL6 | Δ3βGΔcdt1Δclp1 | This study |
| CPL7 | Δ3βGΔcdt2Δclp1 | This study |
| CPL8 | Δ3βGΔcdt1Δcdt2Δclp1 | This study |
| S. cerevisiae | ||
| YPH499 | MATa ura3-52 lys2-801_amber ade2-101_ochre trp1-Δ63 his3-Δ200 leu2-Δ1 | (2) |
| YP130 | YPH499, LEU2::pRS425-PGK-gh1-1 | This study |
| YP801G-130 | YP130, URA3::pRS426-PGK-cdt1-GFP | This study |
| YP8114G-130 | YP130, URA3::pRS426-PGK-cdt2-GFP | This study |
| YP5853G-130 | YP130, URA3::pRS426-PGK-5853-GFP | This study |
| Plasmids | ||
| pRS425-PGK-gh1-1 | gh1-1 with PGK promoter in pRS425 | This study |
| pRS426-PGK-cdt1-GFP | cdt1 with PGK promoter in pRS426 | This study |
| pRS426-PGK-cdt2-GFP | cdt2 with PGK promoter in pRS426 | This study |
| pRS426-PGK-5853-GFP | ncu05853 with PGK promoter in pRS426 | This study |
The S. cerevisiae recombinant strain expressing the β-glucosidase gh1-1 (YP130) and S. cerevisiae recombinant strain expressing cdt1, cdt2, or ncu05853 in the YP130 background were constructed as previously described (2). The primers used to clone the S. cerevisiae ncu05853 gene were 5853G-F (TATTAAACTAGTATGGGCGGTGCAGGTGGT) and 5853G-R (TTATAAGAATTCTGGGACATGCTCCTTTACCTCAG).
Cellobiose Fermentation and CLP1 Localization
All of the S. cerevisiae recombinant strains were grown in liquid medium under selective conditions to the logarithmic growth phase. Then the cells were harvested, washed, and transferred to liquid minimal medium with 1% cellobiose as the sole carbon source with the same initial cell density. The cell density was measured at 600 nm every day. The data represent the average of three technical replicates with the S.D. The microscopic observation of CLP1 localization was performed on a Leica TCS SP5 II laser scanning confocal microscope (Leica), and Leica Microsystems LAS AF-TCS MP Version 2.4.1, build 6384, and ImageJ software were used for image processing.
Shake Flask Experiment
All of the N. crassa strains were grown on slant tubes containing minimal medium with 2% sucrose (MM) for 10 days at 28 °C to obtain conidia. For liquid cultures, 100 ml of medium with Vogel's salt and 2% carbon source were inoculated with 106 conidia/ml. The 50× Vogel's salt was prepared as previously described (21). For enzyme activity measurements, all of the N. crassa strains were precultured in liquid MM for 48 h at 25 °C and then transferred into 2% cellobiose or 2% Avicel medium for an additional 1–7 days of cultivation as needed. For gene expression analysis, mycelia that were cultured for 16 h in MM were transferred into 2% cellobiose medium for an additional 4 h.
Biochemical Analysis
The total extracellular protein concentration was measured in all of the mutant and wild-type strains using the Quick Start Bradford Protein Assay kit (Bio-Rad). The endoglucanase activity was measured using an azo-CMC kit (S-ACMCL, Megazyme) according to the manufacturer's instructions. The amount of sugar remaining in the supernatants of different mutants was determined by the DNS method.
Transcriptome Analysis
The mycelia samples for RNA extraction were collected by filtration and immediately frozen in liquid nitrogen. Total RNA was isolated with TRIzol reagent (Invitrogen) by the previously described method (12) and further treated with DNase I (RNeasy Mini kit, Qiagen). The RNA concentration was measured by a Nanodrop, and the RNA integrity was checked by agarose gel electrophoresis. Then the RNA was subsequently used for either RNA-seq or quantitative reverse transcription (qRT)-PCR experiments.
RNA-seq was performed on the Illumina HiSeqTM 2000 platform of BGI (Shenzhen, China). To prepare reads for analysis, adaptors and low quality reads were removed based on the BGI standard process. Then qualified reads were mapped against the N. crassa OR74A genome (Version 12) (22) with fewer than two mismatches using Tophat (Version 2.0.8b) (23). The alignment results were stored in SAM format files for subsequent analysis. Read counts that uniquely mapped to exons of predicted transcripts (version 7) were calculated for each individual gene by HTSeq (24) using SAM files and genome annotation as input. The normalized expression values for each gene were calculated using the number of uniquely mapped reads per kilobase of exon model per million mapped reads (RPKM) (25). GFOLD (26) and DEGseq (27) software were used to identify the differentially expressed genes from different samples. Genes with GFOLD ≥ 1 (normalized -fold change of ≥2) and DEGseq p value <1e−4 as determined by Fisher's exact test and likelihood ratio test (27) were taken as significantly differential expression. All RNA-seq data generated in this study (Δ3βG, CPL4, and CPL7 exposed to 2% cellobiose for 4 h) are available in the Gene Expression Omnibus (GEO, www.ncbi.nlm.nih.gov) under accession number GSE60004. The RNA-seq data of Δ3βG exposed to sucrose for 4 h were downloaded from GEO (accession number GSE36719) (17).
qRT-PCR
qRT-PCR was performed using the iScript cDNA Synthesis kit and IQ SYBR Green Supermix according to the manufacturer's instructions (Bio-Rad). Each reaction was done in triplicate. Actin expression (accession number NCU04173) was used as an endogenous control for normalization. The primers for qRT-PCR were ActinRT-F (TGATCTTACCGACTACCT), ActinRT-R (CAGAGCTTCTCCTTGATG), 801RT-F (CGAGACTGAGGAGATGAG), 801RT-R (GTATTGAAGTAACCGAGACC), 8114RT-F (CTTTATCTGGGTGTTCGG), 8114RT-R (GTTCGCATAAGTATTGAGC), 5853RT-F (GCCCTGACCTACACCTAC), and 5853RT-R (GCCAAACGACCAAAGAGC).
Phylogenetic Analysis
Amino acid sequences of all the proteins were obtained from the National Center for Biotechnology Information (NCBI) database. The alignments were performed using ClustalW. The phylogenetic tree was constructed using the neighbor-joining method in MEGA 5.0 (28) with 500 bootstraps, and gaps were completely deleted during the tree construction.
Phylogenetic analysis of NCU05853 with other cellodextrin transporters or sugar sensors (Fig. 1) used the following NCBI accession numbers for tree construction: N. crassa NCU05853 (XP_959844.1), N. crassa CDT1 (XP_963801.1), N. crassa CDT2 (XP_963873.1), T. reesei Crt1 (ETS03552.1), T. reesei Stp1 (XP_006964877.1), P. oxalicum CdtC (EPS25673.1), P. oxalicum CdtG (EPS34431.1), P. oxalicum CdtD (EPS25817.1), N. crassa RCO3 (EAA36477.1), S. cerevisiae RGT2 (CAA65621.1), S. cerevisiae SNF3 (CAA98771.1), and S. cerevisiae HXT-1 (DAA06789.1). In the tree the bar indicates 0.2 substitutions per amino acid residue.
FIGURE 1.

Phylogenetic analysis of CLP1 (NCU05853) and other cellodextrin transporters and sugar sensors. The amino acid sequences of all the analyzed proteins were obtained from the NCBI database. The phylogenetic tree was constructed using MEGA5.0 software with the neighbor-joining method.
For the phylogenetic analysis of NCU05853 orthologs in other strains (supplemental Fig. S3), we first identified the top 50 hits in NCBI using the NCU05853 amino acid sequence as query. The redundant sequences within one species were removed, keeping the best hit for each species. This resulted in 24 sequences for NCU05853. Using these sequences as query to search the N. crassa genome, the best hits of these sequences were identified as NCU05853 orthologs. NCU05853 orthologs were subjected to further phylogenetic analyses. NCBI accession numbers are listed in the tree, and the bar represents 0.05 substitutions per amino acid residue.
RESULTS
NCU05853, Predicted as a CDT2 Homolog, Does Not Have a Cellodextrin Transport Function
Previously, the two cellodextrin transporters CDT1 and CDT2 had been shown to play an important role in cellulose degradation and cellulase induction (2, 3). However, we still know very little about the pathway that is responsible for cellulase induction by cellodextrin besides the major β-glucosidases and two cellodextrin transporters; for example, the other components in this pathway are unknown. In previous transcriptional profiling data, the ncu05853 gene, which was predicted as the closest homolog of CDT2 (Fig. 1), showed an expression pattern that was similar to that of two cellodextrin transporters in the wild-type strain under Avicel conditions and in Δ3βG, which is an N. crassa strain with three β-glucosidase genes deleted (17), under cellobiose conditions, indicating that the ncu05853 gene might play a role in the cellulase induction pathway. Based on the domain prediction, the protein NCU05853 has a typical 12-transmembrane structure. Together, the expression data and sequence homology to CDT2 suggest that NCU05853 might be a cellodextrin transporter. To examine this prediction, ncu05853 was co-expressed with an intracellular β-glucosidase gene, gh1-1 (NCU00130), from N. crassa in S. cerevisiae. Although NCU05853 expressed and localized in the plasma membrane correctly, a cellobiose fermentation assay showed that NCU05853 does not support the growth of the recombinant S. cerevisiae strain on cellobiose and cellotriose (data not shown). This contrasted with the engineered yeast strain with CDT2 and gh1-1, which grew well under the same conditions (Fig. 2). These data clearly showed that NCU05853 does not have the ability to transport cellobiose. It is not a cellodextrin transporter, which was named cellodextrin transporter like protein 1 (CLP1). Because CLP1 appears to be co-expressed with CDT1 and CDT2, alternatively, it might be involved in the cellulase induction pathway with CDT1 and CDT2, which have both been hypothesized to be signal transceptors of the cellulase induction pathway by cellodextrin (3). We will continue to characterize whether there are any roles played by this membrane protein during cellulase induction by cellodextrin using the Δ3βG background strain.
FIGURE 2.
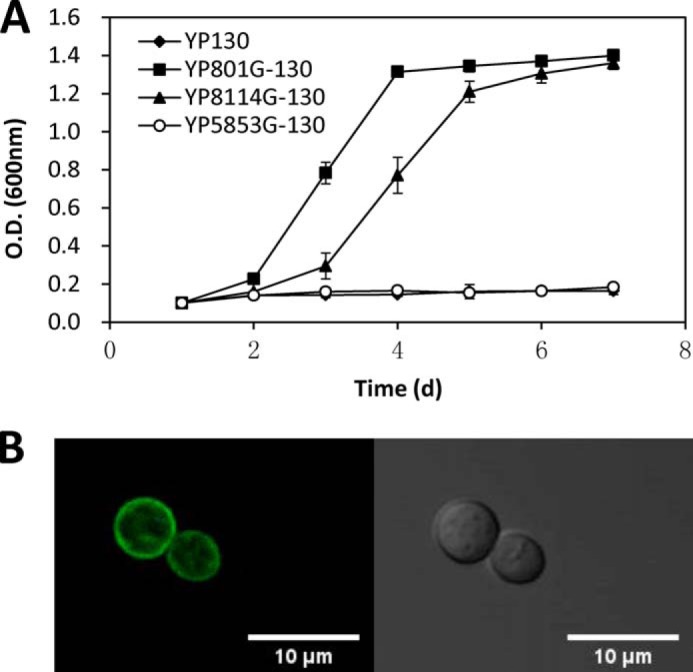
Cellobiose fermentation by a S. cerevisiae strain constructed with clp1 (ncu05853) and gh1–1 (ncu00130). The assay was performed in triplicate for each construct. The error bar indicates the S.D. of the triplicate measurements (A). CLP1 localization in S. cerevisiae. Microscopic observation was performed with a Leica TCS SP5 II laser scanning confocal microscope. Scale bar = 10 μm (B).
CLP1 Suppresses Cellulase Induction; Co-disruption of cdt2 and clp1 in Δ3βG Significantly Increases Cellulase Induction
Because cellobiose can efficiently induce cellulase production in the Δ3βG mutant, in which the three main β-glucosidase genes (gh1-1, gh3-4, and gh3-3) are deleted, it is a very good system to investigate the molecular basis of the cellulase induction pathway (3, 17). To test the alternative hypothesis that CLP1 might play a role in signaling transduction during cellulase induction by cellodextrin, we constructed seven series mutants with one to multiple genes disrupted in the Δ3βG strain background (Table 1). As expected, the multi-gene disruption mutants had serious defects in aerial hyphae, ascospore production, and biomass production in liquid culture with Avicel or cellobiose; these defects were similar or even worse than those of the Δ3βG strain (supplemental Fig. S1). Five of the engineered strains have short aerial hyphae and few ascospores; one quintuple mutant, CPL7 (Δ3βGΔcdt2Δclp1), and one sextuple mutant, CPL8 (Δ3βGΔcdt1Δcdt2Δclp1), had vigorous spore production (Fig. 3A). Not surprisingly, the quintuple mutant CPL5 (Δ3βGΔcdt1Δcdt2) cannot grow at all in 2% cellobiose medium (Fig. 3B), indicating that CLP1 cannot support fungus growth on cellobiose when cdt1 and cdt2 are deleted, consistent with the above result that this protein is not a cellodextrin transporter, even in the native host N. crassa.
FIGURE 3.
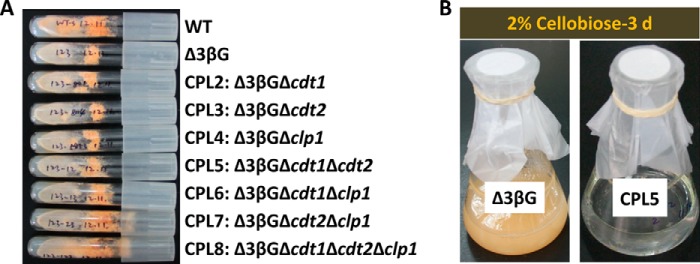
Mutant slants (A) and growth phenotypes of Δ3βG and CPL5 in 2% cellobiose medium after 3 days (B).
Cellulase production was our focus for the series of engineered mutants. To measure cellulase accumulation, we fermented the pre-grown mycelia on 2% cellobiose for a total of 7 days, a similar time that is used for cellulase production in industry and a different time than the previously reported condition of 4 h induction with 1 μm cellobiose (3), which was mainly used to investigate the initial induction mechanism. The secreted protein and enzyme activities of fermented cultures were measured daily (Fig. 4 and supplemental Fig. S2). Not surprisingly, the quintuple mutant of CPL5 (Δ3βGΔcdt1Δcdt2) had no cellulase accumulation even after fermentation for 7 days, which was consistent with the phenotypic analysis above. Most of the strains reached the maximum point at about 3–4 days except CPL3 (Δ3βGΔcdt2), in which cellulases continued to accumulate until 6 days, and the final cellulase production surprisingly increased to about 4-fold that of the reference strain Δ3βG (Fig. 4). We know that the fungus requires CDT2 for cellulose degradation and cellulase induction. The deletion of both CDTs results in zero cellulase induction, but the deletion of only cdt2 in the Δ3βG background results in a 4.3-fold increased cellulase production. This clearly suggested that the mechanism of cellulase induction by cellodextrin was much more complicated than previously thought. Although the quintuple mutant CPL5 (Δ3βGΔcdt1Δcdt2) has no cellulase production, the cellulase production in another two quintuple mutants, CPL6 (Δ3βGΔcdt1Δclp1) and CPL7 (Δ3βGΔcdt2Δclp1), was dramatically higher than that of the starting strain, Δ3βG. Particularly, the CPL7 strain had secreted protein and cellulase activity that was increased 5.8- and 6.9-fold over the levels of the Δ3βG strain, respectively. Another very interesting finding is that the speed of cellulase induction was faster in CPL7 than in any of the other strains tested; CPL7 is the highest cellulase-producing strain among the nine tested strains after 1 day, and it reached the peak point on the third day. The hypercellulase production of strains CPL6 and CPL7, particularly CPL7, clearly suggested that the membrane protein CLP1 is a novel component of the pathway that is deeply involved in the cellobiose induction of cellulases through a dedicated interaction with two cellodextrin transporters, CDT1 and CDT2.
FIGURE 4.

Protein production (A) and cellulase activity (B, CMCase activity) in a series of multi-gene disruption mutants on 2% cellobiose medium. Mycelia were pre-grown on Vogel's minimal medium with 2% sucrose (MM) and were transferred to 2% cellobiose-inducing medium for 7 days.
CLP1 Suppresses Cellulase Induction by Repressing Cellobiose Uptake in N. crassa
To further investigate the mechanism of CLP1 suppression of cellulase induction by cellobiose, we measured the cellobiose uptake rate of the mutants because this saccharide has been suggested to be the cellulase provoker in N. crassa. As expected, deletion of both of the cellodextrin transporters (CPL5: Δ3βGΔcdt1Δcdt2) results in no cellobiose uptake, whereas the mutants with a single deletion of either cdt1 or cdt2 in the Δ3βG background had a decreased cellobiose transport rate, especially in CPL3 (Δ3βGΔcdt2) (Fig. 5A). Interestingly, the CPL7 strain (Δ3βGΔcdt2Δclp1) showed a much higher cellobiose uptake rate than all other mutants. Combined with the cellulase production data of Fig. 4, this indicated that a uniform rule cannot be used to make conclusions about the cellobiose consumption rate and cellulase induction. For most of mutants except the CPL7 strain, the slower cellobiose consumption would result in more cellulase production; for example, the cellobiose consumption among the mutants was CPL3 < CPL6 ∼ CPL2 < CPL4 ∼ Δ3βG, and the inverse trend can be used for the cellulase production in Fig. 4. One consequence of the slower consumption is the relative higher cellobiose (putative inducer) in the medium, suggesting that the higher concentration of the cellulase inducer would benefit the total cellulase production. However, it is a different case for the CPL7 strain, which is the most efficient cellulase producer among the mutant strains tested, and it had a high cellobiose consumption. To explain why this strain has a high cellobiose consumption rate, we checked the cdt1 expression by qRT-PCR (Fig. 5B). The data clearly showed that the gene expression of CDT1, with more efficient cellobiose transport activity than CDT2 (2), was up-regulated >100-fold in the CPL7 strain compare with the Δ3βG strain (Fig. 5B). This could explain the higher cellobiose uptake rate of the CPL7 strain. Based on this, we infer that the faster cellobiose uptake rate might cause the higher intracellular concentration of the inducer, which resulted in faster cellulase induction and higher accumulation. Consistent with the cellobiose consumption, the cellulase production of CPL7 reached the highest level on the third day, and there was no further increase after 3 days when the cellobiose was consumed (Fig. 5A). Taken together, our data suggest that both the intracellular and extracellular inducer concentration would affect cellulase induction. Additionally, CLP1 is involved in cellulase induction by affecting the cellodextrin transporter expression and further influencing cellobiose uptake in N. crassa, which influences cellulase induction.
FIGURE 5.
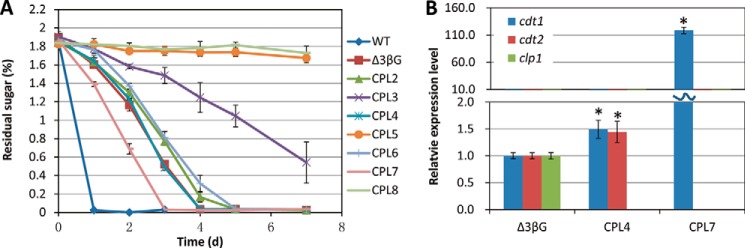
Cellobiose consumption of a series of multi-gene disruption mutants on 2% cellobiose medium (A) and gene expression levels of cdt1, cdt2, and clp1 in three mutants (Δ3βG; CPL4, Δ3βGΔclp1; CPL7, Δ3βGΔcdt2Δclp1) in 2% cellobiose medium (B). The expression levels of actin (NCU04173) were used as an endogenous control in all samples. Each reaction was done in triplicate. *, p < 0.05.
Transcriptional Profile Analysis of the CPL7 Hypercellulase-producing Mutant Strain
To gain a genome-wide understanding of the molecular basis of hypercellulase production in CPL7 (Δ3βGΔcdt2Δclp1) on cellobiose, transcriptional profile analysis was performed using the CPL7 strain on cellobiose with Δ3βG and CPL4 (Δ3βGΔclp1) as comparison strains (supplemental Table S1). There are 1309 genes that were up-regulated at least 2-fold in CPL4 and CPL7 relative to Δ3βG (Fig. 6, supplemental Table S2). Consistent with the cellulase production phenotype on 2% cellobiose, the gene expression profile of CPL7 is significantly different from that of Δ3βG and CPL4 (Fig. 6A). Hierarchical clustering of gene expression patterns for the 1309 genes revealed two clusters (Fig. 6A, supplemental Table S3).
FIGURE 6.

Transcriptome analysis of the hypercellulase-producing mutant CPL7. A, hierarchical clustering of gene expression patterns of 1309 genes. B, FunCat analysis of cluster 1 (804 genes). C, the RPKM value of the main cellulase-related genes. D, the RPKM value of cellulase- and hemicellulase-related transcriptional factors. E, the RPKM value of the cellodextrin transporter cdt1 (NCU00801).
Cluster 1 consisted of 804 genes that showed a strikingly high expression level in CPL7 and partially in CPL4 compared with Δ3βG. 225 genes were enriched in the category of C-compound and carbohydrate metabolism (polysaccharide metabolism and sugar, glucoside, polyol, and carboxylate catabolism) by FunCat analysis (29) (supplemental Table S4). These genes included the main cellulase genes (NCU07340, NCU09680, NCU00762, NCU07190, NCU05121, NCU05057, and NCU04854) and the main hemicellulase and LPMO (previously GH61) genes (NCU08760, NCU02916, NCU02240, NCU01050, and NCU00206). These cellulase genes and LPMO genes have significantly high expression levels in CPL7 (Fig. 6C). Noticeably, the gene expression of three major cellulase- and hemicellulase-related transcriptional factors, clr1, clr2, and xlr1, were up-regulated >100-fold (Fig. 6D). Besides these genes, consistent with the qRT-PCR analysis above, the cellodextrin transporter gene cdt1 (NCU00801) is also in this cluster. Compared with Δ3βG, the expression level of cdt1 in CPL7 is up-regulated 86-fold according to the RPKM value (Fig. 6E). NCU00809, an Major Facilitator Superfamily (MFS) transporter that also has a slight ability to transport cellodextrin (30), is also up-regulated, supporting the idea that the cellobiose uptake was de-repressed in CPL7 because of the deletion of clp1 (supplemental Table S4).
Most of cluster 2 (505 genes) shows up-regulation in Δ3βG on sucrose. Some of the genes were also up-regulated in the CPL7 strain on cellobiose. FunCat analysis showed that the functions of these 505 genes were related to vegetative growth and were enriched in the category of protein synthesis, protein with binding function or cofactor requirement (structural or catalytic), and energy and metabolism (supplemental Table S5).
Together with our genome-wide profiling data, we clearly saw that the whole machinery of cellulase induction and expression was stimulated in the CPL7 strain, including the cellobiose (putative cellulase inducer) uptake genes and major cellulase transcriptional regulators.
Cellulase Production of CPL7 on Avicel
The CPL7 strain we constructed has 6.9-fold more cellulase production than the Δ3βG strain on cellobiose. We then tested the cellulase production on Avicel. To obtain similar mycelia to start, mycelia were pre-grown on Vogel's MM and were inoculated into Vogel's medium with 2% Avicel as the sole carbon source. The secreted protein level and cellulase activity were measured daily for a total of 7 days (Fig. 7 and supplemental Fig. S2). Basically, the cellulase productivity of all mutants reflected the performance on 2% cellobiose. CPL7 (Δ3βGΔcdt2Δclp1) had the highest secreted protein and cellulase activity, which was 5.7-fold higher than the cellulase production of Δ3βG. Previously, the protein and cellulase production of Δ3βG was lower than that of the wild-type strain on Avicel (31), and the secreted cellulase level of CPL7 was ∼20% greater than that of the wild-type strain on Avicel (Fig. 7A). The speed of cellulase production in CPL7 was also much faster than that of any other strain on Avicel, including the wild-type strain (Fig. 7).
FIGURE 7.

Protein production (A) and cellulase activity (CMCase activity; B) in a series of multi-gene disruption mutants on 2% Avicel. Mycelia were pre-grown on MM and were transferred to 2% cellobiose-inducing medium for 7 days. *, p < 0.05.
DISCUSSION
Cellobiose and cellobiose derivatives are considered to be cellulase inducers (17). The wild-type N. crassa strain cannot produce cellulase on cellobiose. When the three main β-glucosidase genes were deleted (forming strain Δ3βG), cellobiose can induce cellulase production (17). This is due to the elimination of the main hydrolysis function of β-glucosidase, which can hydrolyze cellobiose into glucose. Besides the β-glucosidase, cellodextrin transporters are also involved in the cellulose degradation and cellulase induction pathway because of their ability to transport a putative inducer of cellulase in N. crassa, cellobiose (2). The roles of cellodextrin transporters in the cellulase induction pathway have become an interesting topic recently in N. crassa and other cellulolytic fungi (4, 5). Still, very little is known about the whole induction pathway, such as the detailed working roles of each cellodextrin transporter, how they interact with the other components (i.e. β-glucosidases), and whether there is any other novel components involved in the pathway.
In this paper we discovered a novel component of the cellulase induction pathway, CLP1, which is a membrane protein with sequence similarity to CDT2. The functional characterization of the gene was performed based on the construction of seven multiple-gene disruption mutants in the Δ3βG background strain. Although clp1 is co-expressed with cdt2 in N. crassa on Avicel and cellobiose (17), CLP1 is not involved in cellodextrin transport. To better understand the function of CLP1 and its interactions with the other components of the pathway, which includes at least six genes (clp1, cdt1, cdt2, and three β-glucosidase genes), from the Δ3βG strain, we constructed a series of seven mutants with the deletion of clp1 and/or two cellodextrin transporter genes (cdt1 and cdt2). The systematic phenotype analysis of cellulase production of seven quadruple, quintuple, and sextuple mutants revealed that clp1 serves as an inhibitor of cellulase induction by cellobiose. The co-disruption of clp1 and cdt2 combined with the deletion of three major β-glucosidases (CPL7 strain) resulted in cellulase production that was enhanced >6-fold compared with the control strain Δ3βG.
Transcriptome analysis of the hypercellulase-producing strain CPL7 (Δ3βGΔcdt2Δclp1) showed that a large number of enzyme genes from the Carbohydrate Activity Enzyme database, major lignocellulase regulator genes (clr1, clr2, and xlr1), and the cellodextrin transporter cdt1 were strikingly up-regulated. Thus, we hypothesized that CLP1 can repress the expression of cellodextrin transporters at certain level, which further controlled cellobiose transport and the downstream cellulase production in N. crassa. Although the mechanism is not clear, whether CDT synthesis might be regulated through forming the dimer with CLP1 will be interesting to investigate in the future. Similarly, the lactose permease Crt1 (Trire2:3405) has no cellobiose transport ability, but it affects cellulase induction by cellobiose in T. reesei. The absence of Crt1 abolishes the cellulase gene expression (11).
An interesting finding of this study concerns the engineered strain CPL3 (Δ3βGΔcdt2). Although the cellobiose transport activity of the strain strikingly decreased, which caused lower cellulase induction over the first 1–2 days, cellulase production increased quickly after 2 days of induction and was even higher after 7 days of fermentation. We hypothesized that keeping the extracellular inducer concentration high might benefit cellulase production during fermentation. In the hypercellulase-producing strain CPL7 (Δ3βGΔcdt2Δclp1), the deletion of clp1 resulted in the much faster cellobiose uptake rate and greater cellulase production than CPL3 (Δ3βGΔcdt2), suggesting that the higher intracellular concentration of inducer could also stimulate cellulase induction and production like the extracellular concentration.
A previous study suggested that both CDT1 and CDT2 could be the transceptors that are involved in the cellulase induction pathway and that both proteins not only transport cellobiose but also are involved in cellobiose sensing (3). When we co-disrupted clp1 and cdt2, the expression of cdt1 was up-regulated >100-fold. Super cellulases were produced by this strain. We did not observe as high cellobiose uptake and up-regulated cellulase expression in CPL6 (Δ3βGΔcdt1Δclp1) as in CPL7 (Δ3βGΔcdt2Δclp1). Combining the cellulase production and cellobiose uptake rate, we hypothesized that it is possible that CLP1 works with CDT2, not CDT1, to sense and transduce the cellobiose signal, which further controls the downstream components of the cellulase induction pathway. These results suggested that only CDT2 might serve as the cellobiose transceptor, which is consistent with the former result that only the cdt2 mutant has a cellulase induction defect in the wild-type background of N. crassa. Meanwhile, for transportation kinetics, CDT1 is much better than CDT2 (2), suggesting that CDT1 is mainly responsible for cellodextrin transport. The sensing and signal transduction roles were conducted by CLP1 and CDT2. During the preparation of this manuscript, CLP1 was mentioned in one publication about the carbon catabolic repression mechanism, which stated that this protein can somehow transport cellobiose acid (the details of this transport have not been reported because the author only mentioned this as unpublished data; Ref. 32). This observation does not necessarily conflict with our hypothesis that it is a novel component of the cellulase induction pathway, works with CDT2, and is involved in cellobiose sensing and signal transduction. Therefore, CLP1 might be a transceptor like CDT2, which has a dual function in oligosaccharide transport and sensing (3). Because homologs of CLP1 can be found in many other fungi (supplemental Fig. S3), the strategy that we used to show cellulase induction regulation in N. crassa might also work in other cellulase-producing organisms such as T. reesei.
Supplementary Material
This work was supported by Natural Science Foundation of China Grant 31171207, 973 Program of China Grant 2011CB707400, 863 Program of China Grants 2012AA022203 and SS2014AA021300, and Tianjin Zhuanxiang Grant 13ZCDZSY05000.

This article contains supplemental Tables S1–S5 and Figs. S1–S3.
All RNA-seq data generated in this study (D3βG, CPL4, and CPL7) are available in the Gene Expression Omnibus at www.ncbi.nlm.nih.gov under accession number GSE60004.
- CLP1
- cellodextrin transporter-like protein 1
- RPKM
- reads per kilobase per million mapped reads
- qRT
- quantitative reverse transcription.
REFERENCES
- 1. Suto M., Tomita F. (2001) Induction and catabolite repression mechanisms of cellulase in fungi. J. Biosci. Bioeng. 92, 305–311 [DOI] [PubMed] [Google Scholar]
- 2. Galazka J. M., Tian C., Beeson W. T., Martinez B., Glass N. L., Cate J. H. (2010) Cellodextrin transport in yeast for improved biofuel production. Science 330, 84–86 [DOI] [PubMed] [Google Scholar]
- 3. Znameroski E. A., Li X., Tsai J. C., Galazka J. M., Glass N. L., Cate J. H. (2014) Evidence for transceptor function of cellodextrin transporters in Neurospora crassa. J. Biol. Chem. 289, 2610–2619 [DOI] [PMC free article] [PubMed] [Google Scholar]
- 4. Zhang W., Kou Y., Xu J., Cao Y., Zhao G., Shao J., Wang H., Wang Z., Bao X., Chen G., Liu W. (2013) Two major facilitator superfamily sugar transporters from Trichoderma reesei and their roles in induction of cellulase biosynthesis. J. Biol. Chem. 288, 32861–32872 [DOI] [PMC free article] [PubMed] [Google Scholar]
- 5. Li J., Liu G., Chen M., Li Z., Qin Y., Qu Y. (2013) Cellodextrin transporters play important roles in cellulase induction in the cellulolytic fungus Penicillium oxalicum. Appl. Microbiol. Biotechnol. 97, 10479–10488 [DOI] [PubMed] [Google Scholar]
- 6. Cai P., Gu R., Wang B., Li J., Wan L., Tian C., Ma Y. (2014) Evidence of a critical role for cellodextrin transporte 2 (CDT-2) in both cellulose and hemicellulose degradation and utilization in Neurospora crassa. PLoS ONE 9, e89330. [DOI] [PMC free article] [PubMed] [Google Scholar]
- 7. Liang H., Gaber R. F. (1996) A novel signal transduction pathway in Saccharomyces cerevisiae defined by Snf3-regulated expression of HXT6. Mol. Biol. Cell 7, 1953–1966 [DOI] [PMC free article] [PubMed] [Google Scholar]
- 8. Ozcan S., Dover J., Rosenwald A. G., Wölfl S., Johnston M. (1996) Two glucose transporters in Saccharomyces cerevisiae are glucose sensors that generate a signal for induction of gene expression. Proc. Natl. Acad. Sci. U.S.A. 93, 12428–12432 [DOI] [PMC free article] [PubMed] [Google Scholar]
- 9. Madi L., McBride S. A., Bailey L. A., Ebbole D. J. (1997) rco-3, a gene involved in glucose transport and conidiation in Neurospora crassa. Genetics 146, 499–508 [DOI] [PMC free article] [PubMed] [Google Scholar]
- 10. Thevelein J. M., Voordeckers K. (2009) Functioning and evolutionary significance of nutrient transceptors. Mol. Biol. Evol. 26, 2407–2414 [DOI] [PubMed] [Google Scholar]
- 11. Ivanova C., Bååth J. A., Seiboth B., Kubicek C. P. (2013) Systems analysis of lactose metabolism in Trichoderma reesei identifies a lactose permease that is essential for cellulase induction. PLoS ONE 8, e62631. [DOI] [PMC free article] [PubMed] [Google Scholar]
- 12. Tian C., Beeson W. T., Iavarone A. T., Sun J., Marletta M. A., Cate J. H., Glass N. L. (2009) Systems analysis of plant cell wall degradation by the model filamentous fungus Neurospora crassa. Proc. Natl. Acad. Sci. U.S.A. 106, 22157–22162 [DOI] [PMC free article] [PubMed] [Google Scholar]
- 13. Benz J. P., Chau B. H., Zheng D., Bauer S., Glass N. L., Somerville C. R. (2014) A comparative systems analysis of polysaccharide-elicited responses in Neurospora crassa reveals carbon source-specific cellular adaptations. Mol. Microbiol. 91, 275–299 [DOI] [PMC free article] [PubMed] [Google Scholar]
- 14. Coradetti S. T., Craig J. P., Xiong Y., Shock T., Tian C., Glass N. L. (2012) Conserved and essential transcription factors for cellulase gene expression in ascomycete fungi. Proc. Natl. Acad. Sci. U.S.A. 109, 7397–7402 [DOI] [PMC free article] [PubMed] [Google Scholar]
- 15. Sun J., Tian C., Diamond S., Glass N. L. (2012) Deciphering transcriptional regulatory mechanisms associated with hemicellulose degradation in Neurospora crassa. Eukaryot. Cell 11, 482–493 [DOI] [PMC free article] [PubMed] [Google Scholar]
- 16. Li J., Lin L., Li H., Tian C., Ma Y. (2014) Transcriptional comparison of the filamentous fungus Neurospora crassa growing on three major monosaccharides d-glucose, d-xylose and l-arabinose. Biotechnol. Biofuels 7, 31. [DOI] [PMC free article] [PubMed] [Google Scholar]
- 17. Znameroski E. A., Coradetti S. T., Roche C. M., Tsai J. C., Iavarone A. T., Cate J. H., Glass N. L. (2012) Induction of lignocellulose-degrading enzymes in Neurospora crassa by cellodextrins. Proc. Natl. Acad. Sci. U.S.A. 109, 6012–6017 [DOI] [PMC free article] [PubMed] [Google Scholar]
- 18. McCluskey K. (2003) The fungal genetics stock center: from molds to molecules. In Adv Appl Microbiol, pp. 245–262, Academic Press, Inc., New York: [DOI] [PubMed] [Google Scholar]
- 19. Colot H. V. (2006) A high-throughput gene knockout procedure for Neurospora reveals functions for multiple transcription factors. Proc. Natl. Acad. Sci. U.S.A. 103, 10352–10357 [DOI] [PMC free article] [PubMed] [Google Scholar]
- 20. Davis R. H., De Serres F. J. (1970) Genetic and microbiological research techniques for Neurospora crassa. Methods Enzymol. 17A, 79–143 [Google Scholar]
- 21. Vogel H. J. (1956) A convenient growth medium for Neurospora (medium N). Microbiol. Genet. Bull. 13, 42–43 [Google Scholar]
- 22. Galagan J. E., Calvo S. E., Borkovich K. A., Selker E. U., Read N. D., Jaffe D., FitzHugh W., Ma L. J., Smirnov S., Purcell S., Rehman B., Elkins T., Engels R., Wang S., Nielsen C. B., Butler J., Endrizzi M., Qui D., Ianakiev P., Bell-Pedersen D., Nelson M. A., Werner-Washburne M., Selitrennikoff C. P., Kinsey J. A., Braun E. L., Zelter A., Schulte U., Kothe G. O., Jedd G., Mewes W., Staben C., Marcotte E., Greenberg D., Roy A., Foley K., Naylor J., Stange-Thomann N., Barrett R., Gnerre S., Kamal M., Kamvysselis M., Mauceli E., Bielke C., Rudd S., Frishman D., Krystofova S., Rasmussen C., Metzenberg R. L., Perkins D. D., Kroken S., Cogoni C., Macino G., Catcheside D., Li W., Pratt R. J., Osmani S. A., DeSouza C. P., Glass L., Orbach M. J., Berglund J. A., Voelker R., Yarden O., Plamann M., Seiler S., Dunlap J., Radford A., Aramayo R., Natvig D. O., Alex L. A., Mannhaupt G., Ebbole D. J., Freitag M., Paulsen I., Sachs M. S., Lander E. S., Nusbaum C., Birren B. (2003) The genome sequence of the filamentous fungus Neurospora crassa. Nature 422, 859–868 [DOI] [PubMed] [Google Scholar]
- 23. Trapnell C., Roberts A., Goff L., Pertea G., Kim D., Kelley D. R., Pimentel H., Salzberg S. L., Rinn J. L., Pachter L. (2012) Differential gene and transcript expression analysis of RNA-seq experiments with TopHat and Cufflinks. Nat. Protoc. 7, 562–578 [DOI] [PMC free article] [PubMed] [Google Scholar]
- 24. Anders S., Pyl P. T., Huber W. (2014) HTSeq: A Python framework to work with high-throughput sequencing data. Bioinformatics 10.1093/bioinformatics/btu638 [DOI] [PMC free article] [PubMed] [Google Scholar]
- 25. Mortazavi A., Williams B. A., McCue K., Schaeffer L., Wold B. (2008) Mapping and quantifying mammalian transcriptomes by RNA-Seq. Nat. Methods 5, 621–628 [DOI] [PubMed] [Google Scholar]
- 26. Feng J., Meyer C. A., Wang Q., Liu J. S., Shirley Liu X., Zhang Y. (2012) GFOLD: a generalized fold change for ranking differentially expressed genes from RNA-seq data. Bioinformatics 28, 2782–2788 [DOI] [PubMed] [Google Scholar]
- 27. Wang L., Feng Z., Wang X., Wang X., Zhang X. (2010) DEGseq: an R package for identifying differentially expressed genes from RNA-seq data. Bioinformatics 26, 136–138 [DOI] [PubMed] [Google Scholar]
- 28. Tamura K., Peterson D., Peterson N., Stecher G., Nei M., Kumar S. (2011) MEGA5: molecular evolutionary genetics analysis using maximum likelihood, evolutionary distance, and maximum parsimony methods. Mol. Biol. Evol. 28, 2731–2739 [DOI] [PMC free article] [PubMed] [Google Scholar]
- 29. Ruepp A. (2004) The FunCat, a functional annotation scheme for systematic classification of proteins from whole genomes. Nucleic Acids Res. 32, 5539–5545 [DOI] [PMC free article] [PubMed] [Google Scholar]
- 30. Ha S. J., Galazka J. M., Kim S. R., Choi J. H., Yang X., Seo J. H., Glass N. L., Cate J. H., Jin Y. S. (2011) Engineered Saccharomyces cerevisiae capable of simultaneous cellobiose and xylose fermentation. Proc. Natl. Acad. Sci. U.S.A. 108, 504–509 [DOI] [PMC free article] [PubMed] [Google Scholar]
- 31. Zhou Q., Xu J., Kou Y., Lv X., Zhang X., Zhao G., Zhang W., Chen G., Liu W. (2012) Differential involvement of beta-glucosidases from Hypocrea jecorina in rapid induction of cellulase genes by cellulose and cellobiose. Eukaryot. Cell 11, 1371–1381 [DOI] [PMC free article] [PubMed] [Google Scholar]
- 32. Yi X., Coradetti S. T., Li X., Gritsenko M. A., Clauss T., Petyuk V., Camp D., Smith R., Cate J. H., Yang F., Louise Glass N. (2014) The proteome and phosphoproteome of Neurospora crassa in response to cellulose, sucrose and carbon starvation. Fungal Genet. Biol. 72, 21–33 [DOI] [PMC free article] [PubMed] [Google Scholar]
Associated Data
This section collects any data citations, data availability statements, or supplementary materials included in this article.