

Background: Lafora disease is characterized by abnormal, hyperphosphorylated glycogen.
Results: 20% of the total phosphate is present as a C6 phosphomonoester of glucose residues; this proportion is unchanged in glycogen from mouse models of Lafora disease.
Conclusion: C6 phosphate is not the dominant phosphomonoester.
Significance: C2, C3, or C6 phosphate could all contribute to aberrant glycogen structure.
Keywords: Glycobiology, Glycogen, Glycogen Storage Disease, Phosphorylation, Polysaccharide, Epm2a, Epm2b, Lafora Disease, Laforin, Malin
Abstract
Glycogen is a branched polymer of glucose that acts as an energy reserve in many cell types. Glycogen contains trace amounts of covalent phosphate, in the range of 1 phosphate per 500–2000 glucose residues depending on the source. The function, if any, is unknown, but in at least one genetic disease, the progressive myoclonic epilepsy Lafora disease, excessive phosphorylation of glycogen has been implicated in the pathology by disturbing glycogen structure. Some 90% of Lafora cases are attributed to mutations of the EPM2A or EPM2B genes, and mice with either gene disrupted accumulate hyperphosphorylated glycogen. It is, therefore, of importance to understand the chemistry of glycogen phosphorylation. Rabbit skeletal muscle glycogen contained covalent phosphate as monoesters of C2, C3, and C6 carbons of glucose residues based on analyses of phospho-oligosaccharides by NMR. Furthermore, using a sensitive assay for glucose 6-P in hydrolysates of glycogen coupled with measurement of total phosphate, we determined the proportion of C6 phosphorylation in rabbit muscle glycogen to be ∼20%. C6 phosphorylation also accounted for ∼20% of the covalent phosphate in wild type mouse muscle glycogen. Glycogen phosphorylation in Epm2a−/− and Epm2b−/− mice was increased 8- and 4-fold compared with wild type mice, but the proportion of C6 phosphorylation remained unchanged at ∼20%. Therefore, our results suggest that C2, C3, and/or C6 phosphate could all contribute to abnormal glycogen structure or to Lafora disease.
Introduction
Glycogen, the widely distributed carbohydrate store, is a polymer of glucose formed of α-1,4-glycosidic linkages with branch points introduced by α-1,6-glycosidic linkages, on average 1 per 12 glucose residues (1). A common model for glycogen structure envisages successive layers of glucose chains, average length 13 residues, up to a maximum of 12 tiers, so that a fully formed molecule would contain ∼55,000 glucose residues (2–4). Glycogen also contains trace amounts of covalent phosphate (5–7), which from more recent analyses normally occurs in the range of 1 phosphate per 500–2000 glucose residues depending on the source of the glycogen (1). The early work from Whelan and co-workers (6, 7) suggested that the phosphate was present as a C6 phosphomonoester or a C1-C6 phosphodiester, the latter introduced by a putative glucose-1-phosphotransferase enzyme.
The phosphorylation of glycogen has attracted recent attention because of its implication in Lafora disease, a juvenile-onset genetic disease characterized by progressive myoclonic epilepsy and a gradual deterioration of neurological function culminating in death usually within 10 years of diagnosis (8–12). A characteristic of the disease is the occurrence of deposits, called Lafora bodies, in neurons, muscle, heart, skin, and other tissues. Lafora bodies contain a poorly branched glycogen-like substance, termed polyglucosan, that is hyper-phosphorylated. Some 90% of the instances of Lafora disease can be traced to mutations in either of two genes, EPM2A and EPM2B/NHLRC1, which encode proteins called laforin (13, 14) and malin (15), respectively. Disruption of either gene in mice results in the formation of Lafora bodies and reproduces a number of the neurological defects of the human disease (16–21). The connection with glycogen phosphorylation came with the recognition that laforin, by sequence a member of the atypical dual specificity protein phosphatase family (22), was able to dephosphorylate amylopectin (23, 24) and glycogen (24) in vitro. Furthermore, glycogen from laforin knock-out mice had elevated levels of phosphorylation (24) that could be linked to abnormalities in glycogen structure conducive to the generation of Lafora bodies (25).
The recent interest in glycogen phosphorylation led to renewed investigation of the chemical linkage and the origin of the phosphate in glycogen. Tagliabracci et al. (26) purified phospho-oligosaccharides from rabbit muscle glycogen by anion exchange chromatography and, from NMR analysis, identified the presence of both C2 and C3 phosphomonoesters. A subsequent study by Nitschke et al. (27) confirmed the presence of C2 and C3 monoesters and additionally presented evidence for C6 phosphomonoester by NMR analyses. Neither study found evidence for the C1-C6 phosphodiester proposed by Lomako et al. (6). In addition, Nitschke et al. (27) utilized an enzymatic assay to measure glucose 6-P in hydrosylates of glycogen in the presence of the resulting high glucose background. Using this protocol, they detected increased C6 phosphorylation of glycogen in laforin and malin knock-out mice but did not report what proportion it was of the total covalent phosphate. They concluded that elevated C6 phosphorylation interfered with branching, resulting in the malformed glycogen responsible for the neurodegeneration of Lafora disease.
In the present study we undertook further analysis of the phosphorylation of muscle glycogen. We confirmed the presence of C6 phosphate by NMR and by enzymatic glucose 6-P determination in mouse and rabbit skeletal muscle glycogen. In wild type mouse muscle glycogen, C6 phosphorylation accounted for ∼20% of the total phosphate, and as the total glycogen phosphate was elevated 4–8-fold in laforin or malin knock-out mice, the proportion of C6 phosphate remained constant at ∼20%. Therefore, from our results we cannot determine which, if any, phosphorylation is most important for causing abnormal glycogen structure and hence Lafora disease.
EXPERIMENTAL PROCEDURES
Animals
Epm2a−/− mice in a mixed C57BL/6 X 129Svj background (16) originated with Dr. Delgado-Escueta and were backcrossed five times with C57BL/6 mice. Heterozygotes from this generation were crossed to generate Emp2a−/− and Epm2a+/+ mice (28). Intercrossing of these mice (Epm2a−/− x Epm2a−/− and Epm2a+/+ x Epm2a+/+) produced the experimental mice used in this study. Epm2b−/− mice were generated as described by DePaoli-Roach et al. (17). Briefly, C57BL/6N ES cells disrupted for Epm2b were injected into C57BL/6J blastocysts that resulted in a male chimeric mouse that gave germ-line transmission after crossing with C57BL/6 females. The resulting Epm2b−/+ mice were intercrossed, and the resulting progeny used for Epm2b−/− x Epm2b−/− and Epm2b+/+ x Epm2b+/+ crosses to generate the experimental animals. All mice were maintained in temperature- and humidity-controlled conditions with a 12:12 h light-dark cycle at the Indiana University School of Medicine Laboratory Animal Resource Center, were fed a standard chow (Harlan Teklad global diet 2018SX), and allowed food and water ad libitum. New Zealand White rabbits were purchased from Harlan and housed temporarily in the Indiana University School of Medicine Laboratory Animal Resource Center until they were sacrificed. Liver and skeletal muscle were harvested and frozen in liquid nitrogen, and the majority of the skeletal muscle was used fresh for purification of glycogen by Method 1 below. All studies were conducted in accordance with federal guidelines and were approved by the Institutional Animal Care and Use Committee of Indiana University School of Medicine.
Purification of Glycogen
Rabbit muscle glycogen was purified by either of two procedures, one involving treatment of muscle extracts with 10% TCA (w/v) at 4 °C to remove protein before precipitation with ethanol (Method 1) and the other involving direct KOH digestion of muscle (Method 2). Two male New Zealand White rabbits, ∼ 2 kg each, were sacrificed by lethal injection with pentobarbital (150 mg/kg body weight) followed by exsanguination. Back and hind limb muscles were removed, and ∼75% of the harvested muscle was placed immediately under ice and used for glycogen purification by Method 1. The remaining tissue was flash-frozen in liquid N2 and stored at −80 °C for glycogen purification by Method 2.
Method 1 (TCA)
Freshly harvested rabbit skeletal muscle, ∼1.45 kg, was cut into small pieces and homogenized with three volumes of 4 mm EDTA in a large Waring blender, 60 s at low speed and 30 s at high speed. All procedures, homogenizations, centrifugations, and other steps were conducted at 4 °C. The homogenate was centrifuged for 45 min at 7000 × g. The supernatant was then passed through two layers of Miracloth to remove floating fat. The recovered supernatant (2.8 liter) was transferred to a 4-liter glass beaker placed in an ice bath, and 100% (w/v) TCA was slowly added under constant stirring to a final concentration of 10% TCA. The suspension was then centrifuged for 30 min at 7000 × g, the supernatant (2.7 liters) was transferred to a 4-liter glass beaker placed in a salt-ice bath, and glycogen was precipitated by slowly adding 1 volume of −80 °C 100% ethanol. After stirring in the salt-ice bath for an additional 20 min, the sample was centrifuged at 7000 × g for 60 min, the supernatant was decanted, and the precipitate was redissolved in water using a motor-driven pestle of a Dounce homogenizer. The solution (80 ml) was transferred to a glass Corex tube, and lipids and other nonpolar contaminants were extracted with an equal volume of a 3:1 chloroform:octanol solution by vigorous mixing followed by centrifugation at 6000 × g for 10 min. The aqueous layer was collected and re-extracted with an equal volume of 3:1 chloroform:octanol. Ten ml of water were added to the organic phase of the first extraction, mixed, and centrifuged. The process was repeated once more, and all aqueous phases were combined, 90 ml total. Glycogen was then precipitated from the aqueous phase by slow addition under stirring of an equal volume of −20 °C 100% ethanol, and the suspension was kept overnight at −20 °C. The precipitated glycogen was collected by centrifugation, 7,000 × g for 30 min, and the pellet was redissolved with 45 ml of 1% SDS and then subjected to ultracentrifugation in a Ti45 rotor for 3 h at 196,000 × g at 4 °C. After ultracentrifugation the supernatant was decanted, and 30 ml of water were added to the translucent glycogen pellet, which was redissolved by rocking on a nutator overnight at 4 °C. The solution was then placed on ice for 1 h to precipitate any remaining SDS, which was removed by centrifugation at 12,000 × g for 20 min. The glycogen in the supernatant (45 ml) was precipitated with 2 volumes of −20 °C 100% ethanol and kept at −20 °C for 2.5 h followed by centrifugation at 15,300 × g for 30 min. The precipitated glycogen was washed with −20 °C 100% ethanol, centrifuged at 15,300 × g, and then dissolved in 30 ml of water. The glycogen solution was dialyzed using Spectra/Por (Spectrum) 16-mm diameter, 12,000–14,000 Mr cutoff dialysis tubing at 4 °C against 4 liters of water, which was changed after 4.5 h, and dialysis was continued overnight. The dialyzed glycogen solution was centrifuged at 23,000 × g for 20 min to remove insoluble material. Glycogen in the supernatant (53 ml) was then precipitated with 2 volumes of −20 °C 100% ethanol with stirring and then kept at −20 °C for 2 h. After centrifugation at 23,000 × g for 20 min, the precipitated glycogen was washed with −20 °C 100% ethanol and re-centrifuged. The pellet was kept at room temperature to evaporate all residual ethanol. After the glycogen was completely dried, it was pulverized using a ceramic mortar and pestle. From the 1.45 kg of muscle 4.0 g of glycogen was recovered and kept at −20 °C until use.
Method 2 (KOH)
Flash-frozen rabbit skeletal muscle (∼105 g) stored at −80 °C was rapidly broken into small pieces and added to 10 volumes of boiling 30% (w/v) KOH and maintained in a 100 °C water bath for 1 h with mixing about every 10–15 min. The digested tissue was then placed on ice to cool and centrifuged at 10,000 × g for 10 min. All centrifugations were done at 4 °C. The supernatant, 1 liter, was filtered through 2 layers of Miracloth to remove floating fat and transferred to a 4-liter glass beaker placed in a salt-ice bath, and glycogen was precipitated by the slow addition of two volumes of −80 °C 100% ethanol with constant stirring in the presence of 10 mm LiCl and 0.02% Na2SO4 to aid precipitation. After an additional 5–10 min stirring, the suspension was placed overnight at −20 °C. All subsequent ethanol precipitations included 6 mm LiCl. The precipitated glycogen was collected by centrifugation, 7000 × g for 45 min, and the pellet was redissolved in 30 ml of water and centrifuged at 10,000 × g for 25 min to remove insoluble material. The supernatant (36 ml) was precipitated by adding 2 volumes of −20 °C 100% ethanol with the addition of LiCl and kept at −20 °C for 2 h. The sample was then heated in a boiling water bath for 3 min, which causes glycogen flocculation, then cooled on ice followed by centrifugation at 10,000 × g for 30 min. The pellet was redissolved in 20 ml of water, and 13 ml of the solution was added to each of two glass Corex tubes. Ten volumes of 4:1 methanol:chloroform solution was added to each tube, vigorously mixed, and incubated at 80 °C for 5 min. The tubes were then cooled on ice and centrifuged at 5500 × g for 30 min to pellet the glycogen. The pellets were dried in a SpeedVac concentrator for 10 min to remove residual solvents, redissolved with ∼25 ml of water, heated to aid solubilization, and centrifuged at 10,000 × g for 25 min to remove insoluble material. The supernatant was precipitated again with 2 volumes of 100% ethanol and kept at −20 °C overnight. After heating for 2 min in a boiling water bath and cooling on ice, the sample was centrifuged at 15,000 × g for 30 min. The glycogen pellet was dried in a SpeedVac for 5 min. The pellet was then redissolved with 20 ml of water, and TCA was added under stirring to a final concentration of 10% (w/v) followed by centrifugation at 15,000 × g for 30 min. The glycogen in the supernatant, 27 ml, was precipitated with ethanol and centrifuged at 15,000 × g for 30 min. The pellet was redissolved in 20 ml of water and filtered by passing through one layer of Miracloth that had been extensively washed with water. The filtered solution was then transferred to dialysis tubing, Spectra/Por, 16-mm diameter, 12–14,000 Mr cutoff, and dialyzed against 4 liters of water that was changed after 2.5 h, and dialysis was continued overnight at 4 °C. After dialysis the glycogen solution (19 ml) was precipitated with ethanol, and the pellet was dried in a SpeedVac. The dried pellet was minced and weighed, yielding 0.48 g of glycogen. Glycogen from individual mice was purified from ∼0.5-g samples of hind limb muscle, flash-frozen in liquid N2, and stored at −80 °C until use following a protocol similar to the KOH method above (24).
Potato amylopectin (Sigma #A8515), to be analyzed for phosphate content and as a positive control for the presence of glucose 6-P, was also subjected to the KOH purification procedure. Four aliquots of ∼3 mg of amylopectin were treated with 10 volumes of boiling 30% KOH as described for the glycogen. After boiling, the samples were cooled on ice, precipitated with 2 volumes of −20 °C 100% ethanol and LiCl and Na2SO4 to final concentrations of 10 mm and 0.02% (w/v), respectively, and kept overnight at −20 °C. The samples were then heated in a boiling water bath for 2 min, cooled on ice, and centrifuged at 15,000 × g for 20 min at 4 °C. The pellets were redissolved in 300 μl of water. The precipitation was repeated 2 more times with LiCl at a final concentration of 6 mm. After the last precipitation, the amylopectin pellets were dried in a SpeedVac for 10 min, redissolved in 500 μl of H2O, and dialyzed in Spectra/Por tubing of 10-mm diameter and 12–14,000 Mr cutoff. The samples were dialyzed against 4 liters of water overnight at 4 °C. The dialysates were ethanol-precipitated again. The pellets were dried in a SpeedVac to completely remove any residual liquid, weighed, dissolved in water at a final concentration of ∼5 mg/ml, and stored at −20 °C until use.
Glycogen and Inorganic Phosphate Determination
The concentration of purified mouse and rabbit skeletal muscle glycogen and amylopectin was determined as described in Suzuki et al. (29) by the method of Bergmeyer (30). Approximately 50–150 μg of purified polysaccharide was digested in 50 μl of 0.2 m sodium acetate, pH 4.8, containing 0.3 mg/ml amyloglucosidase (Aspergillus niger; Sigma) at 40 °C overnight. The digest was diluted 2–4-fold with H2O, and 10 μl was added to 0.3 ml of the glucose assay reaction consisting of 0.3 m triethanolamine, pH 7.6, 4 mm MgCl2, 0.9 mm NADP+, and 2 μg/ml glucose 6-P dehydrogenase (Roche Applied Science). Background absorbance was determined at 340 nm. Samples were then incubated with 5 μg of hexokinase (Roche Applied Science) at room temperature for 30 min, and absorbance was measured again. Background absorbance was subtracted from sample absorbance, and glucose equivalents were determined based on a molar extinction coefficient for NADPH of 6.22 × 10³.
Polysaccharide phosphate content of mouse or rabbit skeletal muscle glycogen and potato amylopectin was determined using the sensitive malachite green assay as described previously (24, 31). Briefly, triplicate samples of ∼200 μg of purified polysaccharide were taken, one as a non-hydrolyzed control for free phosphate determination and two for hydrolysis. Samples were hydrolyzed in 40 μl of a 3:1 solution of 60% HClO4, 10 n H2SO4 at 190 °C for 2 h. After hydrolysis, samples were dissolved in 100 μl of water, 400 μl of malachite green solution (31) were added, and absorbance at 620 nm was determined. Phosphate content was quantitated based on a KH2PO4 standard curve, which was linear up to 7 nmol/assay. No phosphate was detected in the non-hydrolyzed controls.
Enzymatic Determination of C6 Phosphorylation of Glycogen
To measure the C6 phosphorylation of glycogen, we developed a procedure to quantitate the glucose 6-P present in hydrolysates of glycogen or amylopectin. The method is an adaptation of that of Zhu et al. (32). Highly purified glycogen was prepared from rabbit skeletal muscle and from wild type, Epm2a and Epm2b knock-out mice as described for the determination of phosphate. Glycogen or amylopectin (0.5 mg) was hydrolyzed in 75 μl of 1 n HCL for 3 h in a boiling water bath followed by neutralization with 37.5 μl of 2 N NaOH. For all glycogen hydrolysates, 10 μl of sample was pipetted in triplicate into a black wall and clear bottom 96-well plate (Costar 3603, Corning). Amylopectin samples were diluted 1:10, and 10 μl was used. To each well, 90 μl of reaction mixture containing 50 mm triethanolamine, pH 7.6, 1 mm MgCl2, 100 μm NADP+, 10 μm high purity resazurin (Acros Organics #18990), and 0.2 units/ml Clostridium kluyveri diaphorase (Sigma #D2322) was added. Samples were centrifuged at 2000 rpm for 30 s in a Fisher Marathon 8K centrifuge and then mixed at 700 rpm for 45 s in an Eppendorf Mixmate. Background fluorescence was measured from the bottom on a FlexStation II plate reader (Molecular Devices) with excitation at 530 nm and emission at 590 nm. Then, 0.1 units/ml Leuconostoc mesenteroides glucose 6-P dehydrogenase (Roche Applied Science #10165875001) was added to each well followed by centrifugation, mixing, 30 min of incubation at room temperature in the dark, and determination of fluorescence, also measured from the bottom. Background fluorescence was subtracted from all sample readings. Each assay included standards of 0, 3.12, 6.25, 12.5, 25, 50, 100, and 150 pmol of glucose 6-P, which were processed in parallel with the samples (Fig. 1A) and which demonstrate the linearity of the assay over this concentration range. Glycogen was also quantitated as described above by measuring glucose in the hydrolysates so that glucose 6-P could be directly related to the glucose content of the same sample.
FIGURE 1.
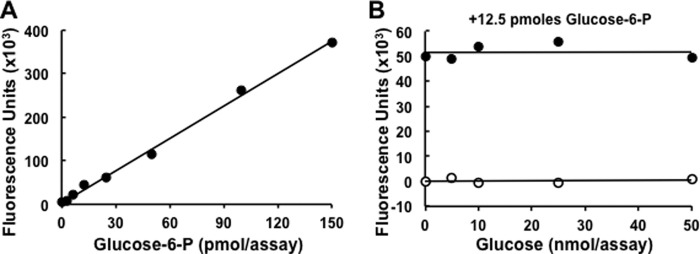
Assay of glucose 6-P. A, standard curve for the measurement of glucose 6-P using the assay described under “ Experimental Procedures.” B, analysis of a fixed amount of glucose 6-P (12.5 pmol/assay) in the presence of 0–50 nmol/assay of glucose, mimicking the background of free glucose that could result from the hydrolysis of glycogen or starch.
Because C6 phosphorylation of glycogen is rare, it was important to establish that the relatively high concentrations of glucose generated by the hydrolysis of glycogen or starch did not interfere with the detection of glucose 6-P. Therefore, an assay was performed in the presence of increasing amounts of glucose, up to 50 nmol/assay, with or without a fixed amount of glucose 6-P (12.5 pmol/assay). As shown in Fig. 1B, glucose by itself, even at the highest concentration, did not yield significant fluorescence, indicating that the glucose 6-P dehydrogenase used had undetectable glucose dehydrogenase activity. Most importantly, glucose did not interfere with the measurement of glucose 6-P, even when present at a 4000-fold molar excess.
Purification of Phospho-oligosaccharides
Phospho-oligosaccharides from glycogen and amylopectin were purified essentially as described previously (26). Approximately 250 mg of rabbit skeletal muscle glycogen, purified by either the TCA or KOH method, or potato amylopectin were digested overnight at 40 °C in 3 ml of 10 mm sodium acetate, pH 4.8, containing 1 mm CaCl2, 0.3 mg/ml α-amylase (Bacillus sp.; Sigma), and 0.3 mg/ml amyloglucosidase (A. niger; Sigma). For amylopectin digestion, 1.25% (v/v) DMSO was also included. After digestion, samples were centrifuged at 10,000 × g for 5 min to remove insoluble material, and the supernatants were transferred to 2-ml screw cap tubes and heated for 5 min in a boiling water bath followed by cooling on ice and further centrifugation for 10 min at 15,000 × g at 4 °C. The individual supernatants were added to 2 ml (bed volume) of DEAE-Sepharose that had been extensively washed with H2O and equilibrated with 10 mm sodium acetate, pH 4.8. The slurry was then placed on a nutator at 4 °C overnight. The DEAE-Sepharose resin was transferred to a 3-ml column, washed with 40 ml of H2O, and the flow rate was adjusted to 0.5 min. Phosphorylated species were eluted stepwise with 4 ml each of 10 mm, 50 mm, 100 mm, 500 mm, and 1 m NH4HCO3, and 1-ml fractions were collected. From each fraction 25–30 μl were transferred to 10 × 75-mm borosilicate tubes in triplicate, one as a non-hydrolyzed control for free phosphate and two for hydrolysis, and were dried in a SpeedVac for phosphate determination, as described above. The remainder of the fractions containing phosphate were dried in a SpeedVac, redissolved in water at a final concentration of 1 mm phosphate and combined for NMR and high performance anion exchange chromatography (HPAEC)3 analyses. The total recovery of phosphate from DEAE chromatography was ∼70%.
HPAEC Analysis of Phospho-Oligosaccharides
Phosphorylated oligosaccharides from rabbit skeletal muscle glycogen and amylopectin, 2.5 nmol each based on phosphate concentration, were analyzed by HPAEC using a Dionex ICS3000 with a PA200 column and detected by PAD. All samples were filtered through a spin filter before loading into a 25-μl injection loop. Eluent A consisted of 100 mm NaOH, and eluent B consisted of 100 mm NaOH and 1 m sodium acetate. Phospho-oligosaccharides and standards were eluted from the PA200 column using a continuous gradient of eluent B from 0-to 50% over 60 min at a flow rate of 0.35 ml/min. Polyglucose standards from glucose (G1) up to maltooctaose (G8), 0.25 nmol each, were also analyzed.
Analysis of Phospho-oligosaccharides by Mass Spectrometry
MS analysis of glycogen phospho-oligosaccharides was performed as described previously (26). Briefly, 1 μl of each sample, 1 mm with respect to phosphate, was mixed with the same volume of matrix solution containing 2,4,6-trihydroxyacetophenone and spotted onto a MALDI plate. The analysis was performed in reflector negative ion mode. All spectra were obtained by using a Microflex LRF (Bruker).
Analysis of Phospho-oligosaccharides by NMR Spectroscopy
Phospho-oligosaccharides from glycogen and from amylopectin were lyophilized and deuterium-exchanged by lyophilization from D2O (99.9% deuterium; Sigma), dissolved in D2O (99.96% deuterium, Cambridge Isotope), and transferred to a 5-mm NMR tube with magnetic susceptibility plugs matched to D2O (Shigemi). Proton-proton (gCOSY, zTOCSY, ROESY) and proton-carbon (gHSQC) correlated spectra were acquired on a Varian Inova 600-MHz spectrometer equipped with a 5-mm cryoprobe, and proton-phosphorus-correlated spectra were acquired on a Varian Inova 500 MHz spectrometer equipped with an 8-mm XH room temperature probe. All spectra were taken at 25 °C. Proton chemical shifts were referenced to internal acetone (δ = 2.218 ppm) (33). Carbon and phosphorus chemical shifts were referenced using the absolute chemical shift scale with Ξ values of 0.25144953 (13C) and 0.40480742 (31P) in MNova. All experiments except the 1H,31P-correlated spectra were acquired with standard Varian pulse sequences. For 1H,31P-correlated experiments, the regular HMQC and HMQC-TOCSY experiments were modified for 31P in the X channel, with a π pulse of 13.5 μs at a level of 60 db and a 3JH-P coupling constant of 7 Hz. The spectral width was 2000 Hz in f2 and 8000 Hz in f1. 24 increments were acquired with 512 transients each. Acquisition time was 300 ms, and the mixing time in the 1H,31P-HMQC-TOCSY experiment was 60 ms. The gCOSY experiment was acquired in 8 transients and 400 increments, with an acquisition time of 150 ms. The zTOCSY experiment was acquired in 16 transients and 128 increments, with an acquisition time of 150 ms and a mixing time of 80 ms. The ROESY experiment was acquired in 16 transients and 128 increments, with an acquisition time of 150 ms and a mixing time of 200 ms. For the 13C,1H gHSQC with adiabatic 180-degree carbon pulses experiment, the spectral width was 3378 Hz in f2 and 10555 Hz in f1. 64 increments were acquired with 200 transients each. The acquisition time was 150 ms, and the 1-bond C-H coupling constant was set to 140 Hz. The sample was 280 ml of a solution 2 mm with respect to phosphate. The raw data were processed in MNova using a 7-Hz gaussian function in f2 and a 90°-sine2 function in f1 (1H,31P spectra) and 7- and 80-Hz Gaussian functions in f2 and f1 (13C,1H spectra), respectively, as well as linear prediction in f1.
RESULTS
Rabbit Muscle Glycogen Phosphorylation
We previously analyzed the phosphorylation of rabbit skeletal muscle glycogen purified by a relatively mild procedure in which the most extreme treatment is exposure to 10% TCA at 4 °C (26). However, glycogen is commonly extracted from tissue using much harsher conditions such as boiling with KOH to digest protein and other cellular components before precipitating glycogen with ethanol. We were interested in testing whether such extreme treatment affected the distribution of the phosphate within glucose residues. Phosphate (34) and other ester (35) migrations are well established phenomena in the chemistry of sugar esters. Phosphate migration under acidic conditions has been described most often, although it has also been observed at high pH (36). Therefore, phospho-oligosaccharides were generated from rabbit muscle glycogen, isolated by the “TCA” or the “KOH” methods, by exposure to α-amylase and amyloglucosidase and separated from neutral sugars by anion exchange chromatography (for details, see “Experimental Procedures”). Amylopectin from potato was processed similarly as a known source of C6 phosphorylation (37–39). Analysis of the phospho-glucans by HPAEC-PAD (Fig. 2, B and C) gave a similar complex pattern to what we observed previously (26) whether the TCA or KOH method was used to purify the glycogen. The amylopectin phospho-oligosaccharides presented a distinct and much simpler elution profile (Fig. 2D). Analysis of the glycogen oligosaccharides by mass spectrometry gave spectra that were dominated by signals corresponding to masses of one phosphate plus n hexoses, up to about n = 12 (Fig. 3). Therefore, although the mixture was complex, as judged by HPAEC and mass spectrometry, the constituents were of similar chemical form, namely glucose polymers of different lengths and likely different branching structures, and were amenable to analysis by NMR.
FIGURE 2.
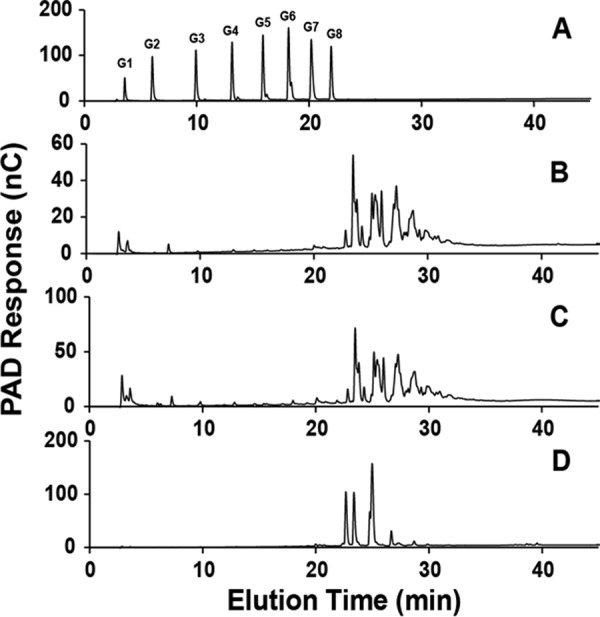
Analysis of phospho-oligosaccharides purified from glycogen and amylopectin by HPAEC. Oligosaccharides were separated by HPAEC with PAD using a PA200 column as detailed under “ Experimental Procedures.” For phospho-oligosaccharides, 2.5 nmol based on phosphate content were analyzed. A, polyglucose standards (0.25 nmol) from glucose (G1) up to maltooctaose (G8). B, phospho-oligosaccharides purified from rabbit muscle glycogen prepared by the TCA protocol. C, phospho-oligosaccharides purified from rabbit muscle glycogen prepared by the KOH protocol. D, phospho-oligosaccharides purified from amylopectin. nC, nanoCoulomb.
FIGURE 3.

Analysis of phospho-oligosaccharides purified from glycogen by MALDI-TOF mass spectrometry. A 1-μl aliquot of phospho-oligosaccharide solution (1 mm in phosphate ester), prepared by the TCA (A) or KOH (B) protocol was analyzed using 2,4,6-trihydroxyacetophenone matrix in negative ion mode. MALDI spectra are shown in which a series of glycogen phosphate peaks from both preparations was detected. The main signals observed are series of glucose oligomers with one mole of phosphate, starting with three hexose units. a.u., absorbance units.
Phospho-oligosaccharides from glycogen and from amylopectin were thus analyzed by two-dimensional homonuclear 1H NMR (COSY, TOCSY, and ROESY), heteronuclear 13C,1H NMR (HSQC), and heteronuclear 1H,31P NMR (HMQC and HMQC-TOCSY). The analysis produced a chemical shift assignment of the residues found in these oligosaccharide mixtures (Table 1). Most of the residues were present in both phospho-oligosaccharides from glycogen and from amylopectin. However, differences in the phosphorylation pattern were detected. The glycogen sample showed the presence of C2, C3, and C6 phosphomonoesters, whereas amylopectin oligosaccharides had signals only for C3 and C6 phosphate (Fig. 4). Panels A and D in Fig. 4 show the 13C,1H HSQC spectra of glycogen and amylopectin phospho-oligosaccharides, respectively. For comparison, we circled the areas in both spectra where the signals coming from carbon/hydrogen pairs of phosphorylated positions could be found in the glycogen spectrum. Two different Glc-6-P residues were present in both samples, one terminal (residue e), i.e. from the non-reducing end, and one 4-linked (residue f), i.e. from inside the oligosaccharide chain. The Glc-6-P residues gave minor signals in the spectrum of glycogen phospho-oligosaccharides but were the predominant signals in that of amylopectin phospho-oligosaccharides. Glc-3-P (residue g) was present in both spectra, and Glc-2-P (residue a) could only be detected in the spectrum of glycogen phospho-oligosaccharides. To ascertain that these residues were indeed phosphorylated, we acquired 1H,31P HMQC (Fig. 4, C and F) and HMQC-TOCSY (Fig. 4, B and E) spectra of both samples. The 1H,31P HMQC spectra, which show only peaks of protons that are at most three bonds distant from phosphorus atoms, confirmed the previous assignment and provided the 31P chemical shift of the different phosphate groups. The spectrum of amylopectin phospho-oligosaccharides (Fig. 4F) was dominated by the two Glc-6-P signals of residues e and f with only a small contribution from Glc-3-P and no detectable Glc-2-P. Conversely, the glycogen phospho-oligosaccharide spectrum (Fig. 4C) showed strong Glc-2-P (residue a) and Glc-3-P (residue g) signals and only small peaks from Glc6-P (residues e and f). The 1H,31P HMQC-TOCSY spectra were acquired to provide a reliable assignment of the signals found in the 1H,31P HMQC spectra. The HMQC-TOCSY experiments (Fig. 4, B and E) showed protons that were up to four bonds distant from phosphorus atoms. Accordingly, Glc-2-P (residue a) gave cross-peaks between 31P and H-1 and H-2, Glc-3-P (residue g) showed correlations between 31P and H-2, H-3, and H-4, and Glc-6-P showed correlations between 31P and H-5 and H-6. All these assignments were in agreement with those derived from the COSY, TOCSY, and 13C,1H HSQC spectra (see Table 1). Quantitation of the NMR signals for the glycogen oligosaccharides (Table 2) revealed an approximately equal proportion of C2, C3, and C6 phosphate except in the previous TCA sample (26) where the C6 phosphate was lower. Thus, use of KOH treatment to prepare glycogen appeared not to influence the phosphate distribution as measured by NMR. In amylopectin, C6 phosphate was dominant, ∼85% of the total, as would be expected from previous reports.
TABLE 1.
Proton, carbon, and phosphorus chemical shifts (in ppm) of phosphorylated amylopectin and glycogen oligosaccharides
| Residue | 1 | 2 | 3 | 4 | 5 | 6 | ||
|---|---|---|---|---|---|---|---|---|
| aa | t-α-Glc-2-P- (1→) | 1H | 5.67 | 3.98 | 3.76 | 3.49 | 3.70 | 3.83/3.77 |
| 13C | 100.0 | 77.3 | 74.7 | 71.8 | 75.3 | 63.3 | ||
| 31P | 1.12 | |||||||
| b | t-α-Glc- (1→4) | 1H | 5.60 | 3.57 | 3.66 | 3.43 | 3.66 | 3.83/3.77 |
| 13C | 101.1 | 74.0 | 75.4 | 72.1 | 75.4 | 63.3 | ||
| cb | t-α-Glc- (1→4-Glc-6-P) | 1H | 5.48 | 3.56 | 3.70 | 3.35 | NDc | 3.92/3.80 |
| 13C | 101.6 | 74.1 | 75.4 | 72.4 | ND | 63.5 | ||
| d | 4-α-Glc- (1→4) | 1H | 5.39 | 3.59 | 3.97 | 3.64 | 3.84 | 3.83/3.77 |
| 13C | 102.2 | 74.1 | 76.0 | 79.7 | 73.8 | 63.3 | ||
| e | t-α-Glc-6-P | 1H | 5.38 | 3.61 | 3.68 | 3.51 | 3.81 | 4.05/4.05 |
| 13C | 102.4 | 74.1 | 75.4 | 71.5 | 74.5 | 66.2 | ||
| 31P | 2.07 | |||||||
| f | 4-α-Glc-6-P | 1H | 5.37 | 3.63 | ND | 3.71 | 3.98 | 4.12/4.03 |
| 13C | 102.2 | 74.1 | ND | 78.1 | 73.0 | 66.6 | ||
| 31P | 1.02 | |||||||
| g | 4-α-Glc-3-P | 1H | 5.35 | 3.75 | 4.46 | 3.81 | 3.87 | ND |
| 13C | 102.4 | 74.6 | 79.9 | 76.4 | 73.8 | ND | ||
| 31P | 2.81 | |||||||
| h | 4-α-Glcred | 1H | 5.21 | 3.56 | 3.95 | 3.64 | ND | ND |
| 13C | 94.5 | 74.0 | 76.0 | 79.7 | ND | ND | ||
| i | 4-β-Glcred | 1H | 4.64 | 3.27 | 3.75 | 3.64 | ND | ND |
| 13C | 98.5 | 76.6 | 78.8 | 79.7 | ND | ND | ||
| ja | 4,6-α-Glcred | 1H | 5.22 | 3.55 | 3.96 | 3.64 | 3.93 | 3.98/3.83 |
| 13C | 94.6 | 74.2 | 76.0 | 79.7 | 72.7 | 69.7 | ||
| ka | t-α-Glc- (1→6) | 1H | 4.99 | 3.54 | 3.74 | 3.44 | 3.86 | ND |
| 13C | 101.5 | 74.7 | 74.2 | 72.1 | 73.8 | ND | ||
| la | 4-α-Glc- (1→6) | 1H | 4.95 | 3.59 | 4.01 | 3.63 | 3.85 | ND |
| 13C | 100.7 | 74.1 | 73.0 | 80.6 | 74.0 | ND | ||
| ma | 4,6-β-Glcred | 1H | 4.65 | 3.25 | 3.77 | 3.62 | 3.60 | 3.97/3.73 |
| 13C | 98.5 | 76.7 | 78.9 | 80.6 | 77.3 | 68.8 |
a Only observed in glycogen phospho-oligosaccharides.
b Only observed in amylopectin phospho-oligosaccharides.
c ND = not determined.
FIGURE 4.

Analysis of phospho-oligosaccharides purified from glycogen and amylopectin by NMR. Two-dimensional heteronuclear NMR spectra were acquired as described under “Experimental Procedures” with D2O as solvent from samples 2 mm with respect to phosphate. A, 13C,1H gHSQC spectrum of purified glycogen phospho-oligosaccharides, prepared by the KOH protocol. The signals from hydrogen/carbon pairs of phosphorylated positions are circled and labeled. The contribution of each isomer was estimated by measuring the peak volumes of the labeled signals. B, 1H,31P HMQC-TOCSY spectrum of purified glycogen phospho-oligosaccharides showing phosphorus correlations to H-1 and H-2 of Glc-2-P and to H-2, H-3, and H-4 of Glc-3-P. C, 1H,31P HMQC spectrum of purified glycogen phospho-oligosaccharides showing phosphorus correlations to H-2 of Glc-2-P, H-3 of Glc-3-P, and H-6 of Glc-6-P. D, gHSQC spectrum of purified amylopectin phospho-oligosaccharides. The same areas as in panel A are circled, although no C2 phosphate was detected in amylopectin. The contribution of each isomer was estimated by measuring the peak volumes of the labeled signals. E, 1H,31P-HMQC-TOCSY spectrum of purified amylopectin phospho-oligosaccharides showing phosphorus correlations to H-5 and H-6 of 4-Glc-6-P, to H-4, H-5, and H-6 of t-Glc-6-P, and to H-2, H-3, and H-4 of Glc-3-P. F. 1H,31P HMQC spectrum of purified glycogen phospho-oligosaccharides showing phosphorus correlations to H-3 of Glc-3-P and H-6 of Glc-6-P. The lines connecting the signals are coded to the different phosphorylated glucose residues. Solid, e and f; dashed, g; dash-dot, a.
TABLE 2.
Phosphomonoester distribution in phospho-oligosaccharides from glycogen and amylopectin based on NMR analyses
The relative proportions of C2, C3, and C6 phosphorylation were estimated by integrating the corresponding signals in NMR experiments such as shown in Fig. 4. Samples were oligosaccharides prepared from the indicated source as described under “Experimental Procedures.” In the case of the glycogen TCA samples, the data refer to reevaluation of a previous sample (Ref. 26) as well as a new sample analyzed in the present study.
| Sample | C2 phosphate | C3 phosphate | C6 phosphate |
|---|---|---|---|
| % | % | % | |
| Glycogen | |||
| TCA (2010) | 28 | 53 | 19 |
| TCA (2013) | 30 | 39 | 31 |
| KOH | 29 | 37 | 34 |
| Amylopectin | 0 | 13 | 87 |
Determination of C6 Phosphorylation in Mouse and Rabbit Muscle Glycogen
Although NMR is a powerful means to demonstrate phosphorylation of specific glucose carbons in oligosaccharides, it requires significant amounts of material and has limitations with regard to quantitation. Therefore, we developed a sensitive enzymatic fluorescence-based assay for glucose 6-P in hydrolysates of purified glycogen samples. The method is a modification of the protocol of Zhu et al. (32) as described under “Experimental Procedures.” Coupled with the measurement of total phosphate present in glycogen, we are able to quantitate the proportion of C6 phosphorylation in relatively small samples of glycogen such as can be obtained from the muscle of individual mice. As has been observed previously (24, 25), the total phosphate content of mouse muscle glycogen, as measured by a malachite green protocol (24, 31), is significantly lower than that of rabbit muscle glycogen (Fig. 5; Table 3); note that phosphate is undetectable unless the polysaccharide is hydrolyzed, indicating the lack of inorganic phosphate contamination. Mouse and rabbit skeletal muscle glycogen contained similar proportions of C6 phosphate, ∼20% (Fig. 5). For rabbit glycogen, this is in reasonable agreement with the values obtained from NMR (Table 2). In absolute terms, the levels of glucose 6-P detected were similar to what was reported by Nitschke et al. (27). Analysis of potato amylopectin indicated that C6 phosphate is, as expected, the predominant phosphomonoester, at ∼75% of the total, again in reasonable agreement with the value from NMR.
FIGURE 5.
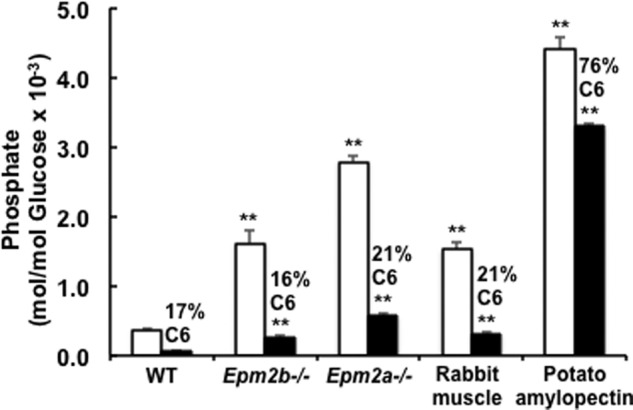
Total phosphate and C6 phosphate content of rabbit and mouse glycogen and amylopectin. The total inorganic phosphate (open bars) and glucose 6-P (filled bars) in hydrolysates of glycogen or amylopectin were measured as described under “Experimental Procedures.” Shown are analyses of glycogen purified from wild type (4), Epm2b−/− (5), and Epm2a−/− (4) mouse muscle, where the numbers in parentheses denote the number of animals analyzed. For rabbit muscle glycogen (5–11) and potato amylopectin (4), the number of replicate analyses is indicated. The percentage of C6 phosphorylation is shown above the filled bars. The error bars indicate the S.E. of the mean; asterisks denote p ≤ 0.01 with respect to wild type mouse glycogen phosphate.
TABLE 3.
Determination of total phosphate and glucose-6-P in glycogen and amylopectin
| Sourcea | Glycogen phosphate (mol/mol) × 10−3 |
% C6 phosphate | Glucose residues per |
Fold increase over WT |
|||
|---|---|---|---|---|---|---|---|
| Total | C6 | Total P | C6 P | Total P | C6 P | ||
| WT (4) | 0.371 ± 0.03 | 0.063 ± 0.007 | 17 | 2700 | 15800 | 1 | 1 |
| Epm2b−/− (5) | 1.612 ± 0.19 | 0.263 ± 0.015 | 16 | 620 | 3800 | 4.3 | 4.0 |
| Epm2a−/− (4) | 2.785 ± 0.09 | 0.582 ± 0.021 | 21 | 360 | 1720 | 7.5 | 9.2 |
| Rabbit (5–11) | 1.525 ± 0.10 | 0.324 ± 0.001 | 21 | 650 | 3090 | NAb | NA |
| Amylo-pectin (4) | 4.403 ± 0.18 | 3.307 ± 0.034 | 76 | 227 | 300 | NA | NA |
a For the analyses of muscle glycogen from wild type (WT), Epm2b−/−, and Epm2a−/− mice, the numbers in parentheses refer to the number of samples, each from a separate mouse, that were analyzed. For the analyses of rabbit muscle glycogen and amylopectin, the numbers in parentheses refer to the number of independent, replicate analyses made from the same starting material.
b NA, not applicable.
C6 Phosphorylation of Glycogen from Laforin and Malin Knock-out Mice
Several reports have documented that total glycogen phosphorylation is elevated in mouse models of Lafora disease (18, 24) and increases with the age of the mice (25). It was, therefore, of interest to assess whether increases in C6 or in C2/C3 phosphate contributed more to the increased glycogen phosphate seen in laforin and malin knock-out mice. In the present study the mice analyzed were 9–10 months old and exhibited 4.3- and 7.5-fold increases in total muscle glycogen phosphate over wild type controls in malin and laforin knock-out animals, respectively (Fig. 5; Table 3). The lesser elevation of glycogen phosphorylation in malin knock-out animals as compared with laforin knockouts is consistent with other studies (18). The absolute levels of glycogen C6 phosphate were also increased in the knock-out mice, but in strict proportion, ∼20%, to the total phosphate. Therefore, we are unable to distinguish whether C6 or C2/C3 phosphate correlates more closely with loss of laforin or malin function.
DISCUSSION
An important outcome from the present study is the confirmation of the presence of C6 phosphate in glycogen from rabbit and mouse skeletal muscle. In our previous study (26), the first to address the disposition of the phosphate in glycogen since the 1990s, we reported the presence of C2 and C3 phosphomonoesters in rabbit muscle glycogen but failed to recognize the C6 phosphate. Re-evaluation of our earlier NMR data, analyses of new samples, comparison with oligosaccharides derived from amylopectin as a positive control, and direct analysis of glucose 6-P in hydrolysates of glycogen have enabled us to conclude that C6 phosphate is indeed present in glycogen, consistent with the recent report (27).
The locations of phosphate esters in glycogen has obvious relevance to understanding the mechanisms of glycogen phosphorylation. Tagliabracci et al. (26) proposed that C2 phosphate might arise from the action of the synthetic enzyme, glycogen synthase, via the formation of a glucose-1,2-cyclic phosphodiester intermediate, the “fast ester” of Leloir (40), in the active site of the enzyme and its subsequent transfer to the growing polyglucose chain. This mechanism has been challenged (27), but it is supported by other independent experiments. Glycogen synthase can catalyze the formation of the fast ester from UDP-glucose in vitro (41), and by x-ray crystallography, the active site of glycogen synthase can accommodate fast ester and its cognate reaction product UMP (41). A similar pathway might account for phosphorylation at C3, but there is no supporting evidence (26). However, it is hard to envisage an analogous mechanism for the introduction of C6 phosphate, and future investigations of glycogen phosphorylation will have to address the mechanism for introduction of the C6 phosphate.
The abnormal glycogen present in Lafora bodies is characterized both by increased glycogen phosphorylation and reduced branching frequency. From comparison of muscle glycogen in young and old laforin knock-out mice, it was evident that elevation of phosphate preceded the alterations in branching structure (25), but the mechanistic relationship between phosphorylation and branching remains one of the major outstanding questions regarding the formation of Lafora bodies. It is easy to envisage how phosphorylation of a glucose residue in glycogen could locally affect the action of the branching enzyme, and in the case of C6 phosphorylation actually chemically blocking the ability to form an α-1,6-glycosidic linkage. Nitschke et al. (27) proposed that C6 phosphorylation might in some way affect branching. If so, we think that it is unlikely to be at a local structural level by chemically blocking a branch point. If one considers a full-sized glycogen molecule of 55,000 glucose residues on the model described in the Introduction there would be ∼4000 branch points. Using the phosphorylation values of the present study, there would be on average 3–4 C6 phosphates per molecule and 17 C2/C3 phosphates in normal glycogen. C6 phosphorylation could, therefore, block no more than 0.1% of the potential branch points. Even in hyperphosphorylated glycogen from laforin or malin knock-out mice, this value increases no more than 10-fold. We favor the idea that glucose phosphorylation has wider ranging effects on overall glycogen structure (1, 25) by disrupting the complex hydrogen bonding and other interactions that stabilize polyglucose helices (42). This idea has been extensively discussed in relation to amylopectin where phosphorylation functions to disrupt the organized structure of semi-crystalline regions of the polysaccharide as part of the degradative process (37, 39, 43, 44). C3 phosphates induce strain in the helix, and C6 phosphate, although more tolerated, can affect helix packing (43). In this way the gross changes in Lafora glycogen physical chemical properties can be explained, but the exact mechanism by which branching is impaired still needs to be worked out.
In their recent study Nitschke et al. (27) portrayed C6 phosphorylation of glycogen as being especially important for Lafora body formation. However, they did not measure total glycogen phosphate content so that the proportion of C6 phosphate was not determined. With our protocol, we were able to establish that C6 phosphorylation represents ∼20% of the total phosphate. This proportion was unchanged, as the total glycogen phosphorylation increased 4–8-fold in malin and laforin knock-out mice, respectively. Thus, the relative importance of C6 phosphorylation as compared with C2 or C3 phosphorylation in promoting the aberrant glycogen structure associated with the formation of Lafora bodies in mouse models of Lafora disease is, in our opinion, an open question.
This work was supported, in whole or in part, by National Institutes of Health Grants DK27221 (to P. J. R.), NS56454 (to P. J. R.), and the 1 P41 RR018502-01 (Integrated Technology Resource for Biomedical Glycomics; to the Complex Carbohydrate Research Center).
- HPAEC
- high performance anion exchange chromatography
- PAD
- pulse amperometric detection
- TOCSY
- two-dimensional total correlation spectroscopy
- HSQC
- heteronuclear single quantum correlation
- HMQC
- heteronuclear multiple quantum coherence
- ROESY
- rotating frame nuclear Overhauser effect spectroscopy
- g
- gradient enhanced
- z
- zero-quantum filtered.
REFERENCES
- 1. Roach P. J., Depaoli-Roach A. A., Hurley T. D., Tagliabracci V. S. (2012) Glycogen and its metabolism: some new developments and old themes. Biochem. J. 441, 763–787 [DOI] [PMC free article] [PubMed] [Google Scholar]
- 2. Gunja-Smith Z., Marshall J. J., Mercier C., Smith E. E., Whelan W. J. (1970) A revision of the Meyer-Bernfeld model of glycogen and amylopectin. FEBS Lett. 12, 101–104 [DOI] [PubMed] [Google Scholar]
- 3. Meléndez R., Meléndez-Hevia E., Cascante M. (1997) How did glycogen structure evolve to satisfy the requirement for rapid mobilization of glucose? A problem of physical constraints in structure building. J. Mol. Evol. 45, 446–455 [DOI] [PubMed] [Google Scholar]
- 4. Meléndez-Hevia E., Waddell T. G., Shelton E. D. (1993) Optimization of molecular design in the evolution of metabolism: the glycogen molecule. Biochem. J. 295, 477–483 [DOI] [PMC free article] [PubMed] [Google Scholar]
- 5. Fontana J. D. (1980) The presence of phosphate in glycogen. FEBS Lett. 109, 85–92 [DOI] [PubMed] [Google Scholar]
- 6. Lomako J., Lomako W. M., Kirkman B. R., Whelan W. J. (1994) The role of phosphate in muscle glycogen. Biofactors 4, 167–171 [PubMed] [Google Scholar]
- 7. Lomako J., Lomako W. M., Whelan W. J., Marchase R. B. (1993) Glycogen contains phosphodiester groups that can be introduced by UDPglucose: glycogen glucose 1-phosphotransferase. FEBS Lett. 329, 263–267 [DOI] [PubMed] [Google Scholar]
- 8. Delgado-Escueta A. V. (2007) Advances in lafora progressive myoclonus epilepsy. Curr Neurol. Neurosci. Rep. 7, 428–433 [DOI] [PubMed] [Google Scholar]
- 9. Andrade D. M., Turnbull J., Minassian B. A. (2007) Lafora disease, seizures, and sugars. Acta Myol. 26, 83–86 [PMC free article] [PubMed] [Google Scholar]
- 10. Gentry M. S., Dixon J. E., Worby C. A. (2009) Lafora disease: insights into neurodegeneration from plant metabolism. Trends Biochem. Sci 34, 628–639 [DOI] [PMC free article] [PubMed] [Google Scholar]
- 11. Ganesh S., Puri R., Singh S., Mittal S., Dubey D. (2006) Recent advances in the molecular basis of Lafora's progressive myoclonus epilepsy. J. Hum. Genet. 51, 1–8 [DOI] [PubMed] [Google Scholar]
- 12. Roach P. J., DePaoli-Roach A. A. (2013) Glycogen metabolism and lafora disease. In Protein Tyrosine Phosphatase Control of Metabolism (Bence K. K. ed.) pp. 239–262, Springer Science + Business Media, New York [Google Scholar]
- 13. Minassian B. A., Lee J. R., Herbrick J. A., Huizenga J., Soder S., Mungall A. J., Dunham I., Gardner R., Fong C. Y., Carpenter S., Jardim L., Satishchandra P., Andermann E., Snead O. C., 3rd, Lopes-Cendes I., Tsui L. C., Delgado-Escueta A. V., Rouleau G. A., Scherer S. W. (1998) Mutations in a gene encoding a novel protein tyrosine phosphatase cause progressive myoclonus epilepsy. Nat. Genet. 20, 171–174 [DOI] [PubMed] [Google Scholar]
- 14. Serratosa J. M., Gómez-Garre P., Gallardo M. E., Anta B., de Bernabé D. B., Lindhout D., Augustijn P. B., Tassinari C. A., Malafosse R. M., Topcu M., Grid D., Dravet C., Berkovic S. F., de Córdoba S. R. (1999) A novel protein tyrosine phosphatase gene is mutated in progressive myoclonus epilepsy of the Lafora type (EPM2). Hum. Mol. Genet. 8, 345–352 [DOI] [PubMed] [Google Scholar]
- 15. Chan E. M., Young E. J., Ianzano L., Munteanu I., Zhao X., Christopoulos C. C., Avanzini G., Elia M., Ackerley C. A., Jovic N. J., Bohlega S., Andermann E., Rouleau G. A., Delgado-Escueta A. V., Minassian B. A., Scherer S. W. (2003) Mutations in NHLRC1 cause progressive myoclonus epilepsy. Nat. Genet. 35, 125–127 [DOI] [PubMed] [Google Scholar]
- 16. Ganesh S., Delgado-Escueta A. V., Sakamoto T., Avila M. R., Machado-Salas J., Hoshii Y., Akagi T., Gomi H., Suzuki T., Amano K., Agarwala K. L., Hasegawa Y., Bai D. S., Ishihara T., Hashikawa T., Itohara S., Cornford E. M., Niki H., Yamakawa K. (2002) Targeted disruption of the Epm2a gene causes formation of Lafora inclusion bodies, neurodegeneration, ataxia, myoclonus epilepsy and impaired behavioral response in mice. Hum. Mol. Genet. 11, 1251–1262 [DOI] [PubMed] [Google Scholar]
- 17. DePaoli-Roach A. A., Tagliabracci V. S., Segvich D. M., Meyer C. M., Irimia J. M., Roach P. J. (2010) Genetic depletion of the malin E3 ubiquitin ligase in mice leads to Lafora bodies and the accumulation of insoluble laforin. J. Biol. Chem. 285, 25372–25381 [DOI] [PMC free article] [PubMed] [Google Scholar]
- 18. Turnbull J., Wang P., Girard J. M., Ruggieri A., Wang T. J., Draginov A. G., Kameka A. P., Pencea N., Zhao X., Ackerley C. A., Minassian B. A. (2010) Glycogen hyperphosphorylation underlies lafora body formation. Ann. Neurol. 68, 925–933 [DOI] [PubMed] [Google Scholar]
- 19. Valles-Ortega J., Duran J., Garcia-Rocha M., Bosch C., Saez I., Pujadas L., Serafin A., Cañas X., Soriano E., Delgado-García J. M., Gruart A., Guinovart J. J. (2011) Neurodegeneration and functional impairments associated with glycogen synthase accumulation in a mouse model of Lafora disease. EMBO Mol. Med. 3, 667–681 [DOI] [PMC free article] [PubMed] [Google Scholar]
- 20. Criado O., Aguado C., Gayarre J., Duran-Trio L., Garcia-Cabrero A. M., Vernia S., San Millán B., Heredia M., Romá-Mateo C., Mouron S., Juana-López L., Domínguez M., Navarro C., Serratosa J. M., Sanchez M., Sanz P., Bovolenta P., Knecht E., Rodriguez de Cordoba S. (2012) Lafora bodies and neurological defects in malin-deficient mice correlate with impaired autophagy. Hum. Mol. Genet. 21, 1521–1533 [DOI] [PubMed] [Google Scholar]
- 21. Tiberia E., Turnbull J., Wang T., Ruggieri A., Zhao X. C., Pencea N., Israelian J., Wang Y., Ackerley C. A., Wang P., Liu Y., Minassian B. A. (2012) Increased laforin and laforin binding to glycogen underlie Lafora body formation in malin-deficient Lafora disease. J. Biol. Chem. 287, 25650–25659 [DOI] [PMC free article] [PubMed] [Google Scholar]
- 22. Alonso A., Sasin J., Bottini N., Friedberg I., Friedberg I., Osterman A., Godzik A., Hunter T., Dixon J., Mustelin T. (2004) Protein tyrosine phosphatases in the human genome. Cell 117, 699–711 [DOI] [PubMed] [Google Scholar]
- 23. Worby C. A., Gentry M. S., Dixon J. E. (2006) Laforin: a dual specificity phosphatase that dephosphorylates complex carbohydrates. J. Biol. Chem. 281, 30412–30418 [DOI] [PMC free article] [PubMed] [Google Scholar]
- 24. Tagliabracci V. S., Turnbull J., Wang W., Girard J. M., Zhao X., Skurat A. V., Delgado-Escueta A. V., Minassian B. A., Depaoli-Roach A. A., Roach P. J. (2007) Laforin is a glycogen phosphatase, deficiency of which leads to elevated phosphorylation of glycogen in vivo. Proc. Natl. Acad. Sci. U.S.A. 104, 19262–19266 [DOI] [PMC free article] [PubMed] [Google Scholar]
- 25. Tagliabracci V. S., Girard J. M., Segvich D., Meyer C., Turnbull J., Zhao X., Minassian B. A., Depaoli-Roach A. A., Roach P. J. (2008) Abnormal metabolism of glycogen phosphate as a cause for Lafora disease. J. Biol. Chem. 283, 33816–33825 [DOI] [PMC free article] [PubMed] [Google Scholar]
- 26. Tagliabracci V. S., Heiss C., Karthik C., Contreras C. J., Glushka J., Ishihara M., Azadi P., Hurley T. D., DePaoli-Roach A. A., Roach P. J. (2011) Phosphate incorporation during glycogen synthesis and Lafora disease. Cell Metab. 13, 274–282 [DOI] [PMC free article] [PubMed] [Google Scholar]
- 27. Nitschke F., Wang P., Schmieder P., Girard J. M., Awrey D. E., Wang T., Israelian J., Zhao X., Turnbull J., Heydenreich M., Kleinpeter E., Steup M., Minassian B. A. (2013) Hyperphosphorylation of glucosyl C6 carbons and altered structure of glycogen in the neurodegenerative epilepsy Lafora disease. Cell Metab. 17, 756–767 [DOI] [PubMed] [Google Scholar]
- 28. DePaoli-Roach A. A., Segvich D. M., Meyer C. M., Rahimi Y., Worby C. A., Gentry M. S., Roach P. J. (2012) Laforin and malin knockout mice have normal glucose disposal and insulin sensitivity. Hum. Mol. Genet. 21, 1604–1610 [DOI] [PMC free article] [PubMed] [Google Scholar]
- 29. Suzuki Y., Lanner C., Kim J. H., Vilardo P. G., Zhang H., Yang J., Cooper L. D., Steele M., Kennedy A., Bock C. B., Scrimgeour A., Lawrence J. C., Jr., DePaoli-Roach A. A. (2001) Insulin control of glycogen metabolism in knockout mice lacking the muscle-specific protein phosphatase PP1G/RGL. Mol. Cell. Biol. 21, 2683–2694 [DOI] [PMC free article] [PubMed] [Google Scholar]
- 30. Bergmeyer H. U., Berndt E., Schmidt F., Stork H. (1974) d-Glucose: determination with hexokinase and glucose-6-phosphate dehydrogenase. In Methods of enzymatic analysis (Bergmeyer H. U., ed.) 2nd Ed., pp. 1196–1201, Academic Press, Inc., New York [Google Scholar]
- 31. Hess H. H., Derr J. E. (1975) Assay of inorganic and organic phosphorus in the 0.1–5 nanomole range. Anal. Biochem. 63, 607–613 [DOI] [PubMed] [Google Scholar]
- 32. Zhu A., Romero R., Petty H. R. (2009) An enzymatic fluorimetric assay for glucose-6-phosphate: application in an in vitro Warburg-like effect. Anal. Biochem. 388, 97–101 [DOI] [PMC free article] [PubMed] [Google Scholar]
- 33. Wishart D. S., Bigam C. G., Yao J., Abildgaard F., Dyson H. J., Oldfield E., Markley J. L., Sykes B. D. (1995) 1H, 13C, and 15N chemical shift referencing in biomolecular NMR. J. Biomol. NMR 6, 135–140 [DOI] [PubMed] [Google Scholar]
- 34. MacDonald D. L. (1972) Phosphates and other inorganic esters. In The Carbohydrates 2E V1A, pp. 253–278, Elsevier, New York [Google Scholar]
- 35. Teranishi K., Ueno F. (2003) Mechanism of 2-O–3-O silyl migration in cyclomaltosehexaose (a-cyclodextrin). Tetrahedron Lett. 44, 4843–4848 [Google Scholar]
- 36. Patel M. K., Davis B. G. (2013) Control of phosphoryl migratory transesterifications allows regioselective access to sugar phosphates. Org. Lett. 15, 346–349 [DOI] [PubMed] [Google Scholar]
- 37. Blennow A., Nielsen T. H., Baunsgaard L., Mikkelsen R., Engelsen S. B. (2002) Starch phosphorylation: a new front line in starch research. Trends Plant Sci. 7, 445–450 [DOI] [PubMed] [Google Scholar]
- 38. Ritte G., Heydenreich M., Mahlow S., Haebel S., Kötting O., Steup M. (2006) Phosphorylation of C6- and C3-positions of glucosyl residues in starch is catalysed by distinct dikinases. FEBS Lett. 580, 4872–4876 [DOI] [PubMed] [Google Scholar]
- 39. Zeeman S. C., Kossmann J., Smith A. M. (2010) Starch: its metabolism, evolution, and biotechnological modification in plants. Annu. Rev. Plant Biol. 61, 209–234 [DOI] [PubMed] [Google Scholar]
- 40. Paladini A. C., Leloir L. F. (1952) Studies on uridine-diphosphate-glucose. Biochem. J. 51, 426–430 [DOI] [PMC free article] [PubMed] [Google Scholar]
- 41. Chikwana V. M., Khanna M., Baskaran S., Tagliabracci V. S., Contreras C. J., DePaoli-Roach A., Roach P. J., Hurley T. D. (2013) The structural basis of 2-phosphoglucose incorporation into glycogen by glycogen synthase. Proc. Natl. Acad. Sci. U.S.A. 110, 20976–20981 [DOI] [PMC free article] [PubMed] [Google Scholar]
- 42. Gessler K., Usón I., Takaha T., Krauss N., Smith S. M., Okada S., Sheldrick G. M., Saenger W. (1999) V-Amylose at atomic resolution: x-ray structure of a cycloamylose with 26 glucose residues (cyclomaltohexaicosaose). Proc. Natl. Acad. Sci. U.S.A. 96, 4246–4251 [DOI] [PMC free article] [PubMed] [Google Scholar]
- 43. Blennow A., Engelsen S. B. (2010) Helix-breaking news: fighting crystalline starch energy deposits in the cell. Trends Plant Sci. 15, 236–240 [DOI] [PubMed] [Google Scholar]
- 44. Fettke J., Hejazi M., Smirnova J., Höchel E., Stage M., Steup M. (2009) Eukaryotic starch degradation: integration of plastidial and cytosolic pathways. J. Exp. Bot. 60, 2907–2922 [DOI] [PubMed] [Google Scholar]