

Abstract
Eukaryotic cells can synthesize the non-essential amino acid arginine from aspartate and citrulline using the enzyme argininosuccinate synthetase (ASS). It has been observed that ASS is under-expressed in various types of cancers ASS, for which arginine become auxotrophic. Arginine deiminase (ADI) is a prokaryotic enzyme that metabolizes arginine to citrulline and has been found to inhibit melanoma and hepatoma cancer cells deficient of ASS. We tested the hypothesis that pancreatic cancers have low ASS expression and therefore arginine deprivation by ADI will inhibit cell growth. ASS expression was examined in 47 malignant and 20 non-neoplastic pancreatic tissues as well as a panel of human pancreatic cancer cell lines. Arginine deprivation was achieved by treatment with a recombinant form of ADI formulated with polyethylene glycol (PEG-ADI). Effects on caspase activation, cell growth and cell death were examined. Furthermore, the effect of PEG-ADI on the in vivo growth of pancreatic xenografts was examined. Eighty-seven percent of the tumors lacked ASS expression; 5 of 7 cell lines similarly lacked ASS expression. PEG-ADI specifically inhibited growth of those cell lines lacking ASS. PEG-ADI treatment induced caspase activation and induction of apoptosis. PEG-ADI was well tolerated in mice despite complete elimination of plasma arginine; tumor growth was inhibited by ∼50%. Reduced expression of ASS occurs in pancreatic cancer and predicts sensitivity to arginine deprivation achieved by PEG-ADI treatment. Therefore, these findings suggest that arginine deprivation by ADI could provide a beneficial strategy for the treatment of pancreatic cancer, a malignancy in which new therapy is desperately needed.
Keywords: pancreatic cancer, arginine, arginine deiminase
Amino acid deprivation is an effective treatment strategy for some cancers that are auxotrophic for nonessential amino acids.1–3 It has long been recognized that the growth of solid tumors is dependent on the presence of arginine.4–6 Arginine is a semi-essential amino acid as it can be synthesized from citrulline in 2 steps via the urea cycle enzymes argininosuccinate synthetase (ASS) and argininosuccinate lyase (ASL).7 ASS, the rate-limiting step for production of arginine, catalyzes the conversion of citrulline and aspartate to argininosuccinate, which is then converted to arginine and fumarate by ASL.8–10 Arginine is a precursor for a variety of other biosynthetic pathways including urea excretion following degradation by arginase, as a nitric oxide source following degradation by nitric oxide synthase, as a second messenger following metabolism to agmatine, or to be used as a precursor for protein synthesis.
Arginine deiminase (ADI) is an enzyme isolated from Mycoplasma that degrades arginine into its citrulline precursor.11 ADI has an ∼1,000-fold greater affinity for arginine (Km ∼30 μM) compared to arginase (∼45 mM). Therefore, when eukaryotic cells are exposed to ADI, arginine is effectively shunted away from normal physiologic processes and the cell suffers arginine depletion. Unfortunately, ADI is rapidly degraded in the serum of patients, though modification by pegylation (PEG) dramatically increases the half-life of ADI as well as decrease its antigenicity.12 Early preclinical work has shown that PEG-ADI inhibits the growth of hepatocellular carcinoma and melanoma cells in vitro.13 The efficacy of PEG-ADI appears related to the expression of ASS; treatment of those cells deficient in ASS with PEG-ADI induces cell death, whereas treatment of those cells with normal ASS levels with PEG-ADI does not affect cell viability.14–17 Thus, ASS deficiency may be a prerequisite for PEG-ADI sensitivity. Indeed, in vitro studies of melanoma, hepatocellular and renal cell carcinoma demonstrate that absence of ASS expression is correlated with cytotoxic response to PEG-ADI.13,18 These preclinical data have prompted early clinical trials: a Phase I/II clinical trial in patients with hepatocellular carcinomas showed a 47% response rate2,19 and another Phase I/II clinical trial in melanoma yielded a 25% response rate1 with a mild side effect profile.
In the current study, we sought to evaluate the level of ASS expression in pancreatic cancer and the effect of arginine deprivation by PEG-ADI on cell growth. We hypothesized that pancreatic cancer cells have low levels of ASS expression and arginine deprivation by PEG-ADI would inhibit pancreatic cancer cell growth.
Material and methods
Cell lines and reagents
All chemical reagents were purchased from Sigma Chemical Company (St. Louis, MO) unless otherwise specified. Cell culture supplies and media were purchased from Becton Dickinson (San Diego, CA) and Gibco/BRL Life Technologies (Gaithersburg, MD), respectively. PEG-ADI (81 IU/mL = 11.3 μg/mL) was generously provided by DesigneRx Pharmacologics (Vacaville, CA).20 The stock solution was stored in aliquots at −20°C. Working concentrations were freshly prepared by dilution of the stock in sterile phosphate-buffered saline (PBS). Antibodies included a mouse monocolonal antibody to ASS generously provided by DesigneRx Pharmacologics (Vacaville, CA) and a polyclonal antibody to (β-actin (Santa Cruz Biotechnology, Santa Cruz, CA). BxPC-3, Capan-I, HPAC, HFAF-II, L3.3, MIA-PaCa-2 and Panc-1 cell lines were obtained from the American Type Culture Collection (Rockville, MD) and cultured in the recommended medium (Gibco/BRL, Gaithersburg, MD) supplemented with 10% fetal calf serum (Hyclone, Logan, UT). Cells were maintained in a humidified incubator containing 10% CO2 at 37°C.
RT-PCR andPCR
Total RNA and genomic DNA were isolated from control and PEG-ADI treated cells (0.3 μg/mL; 5 days) using the Promega SV Total RNA Isolation system and Qiagen DNEasy Tissue Kit, respectively, as suggested by the manufacturer (Promega, Madison, WI; Qiagen, Valencia, CA). The ASS primers used for RT-PCR and PCR were as follows: Forward primer 5′-cag acg cta tgt cca gca aa-3′; and reverse primer 5′-tgc ttt gcg tac tcc atc ag-3′. The human (β-actin primer pair was purchased from R&D Systems: Forward primer 5′ cta caa tga gct gcg tgt gg-3′; and reverse primer 5′-aag gaa ggc tgg aag agt gc-3′ (Minneapolis, MN). RT-PCR for ASS and actin was performed using the Access RT-PCR kit (Promega, Madison, WI) with 200 ng of RNA per reaction and the following parameters: 48°C for 45 min, 94°C for 2 min, 60°C for 1 min, 68°C for 2 min, 25 amplification cycles, 68°C for 7 min. Amplication of genomic DNA for ASS and actin was performed using Taq polymerase (Promega) with 500 ng of DNA per reaction and the following parameters: 94°C for 45 min, 55°C for 45 min, 72°C for 45 min, 25 amplification cycles, 72°C for 10 min. The RT-PCR and PCR products were analyzed using a 1.5% agarose gel stained with ethidium bromide.
Western blotting
Levels of ASS and actin were determined by the Western blot technique with and without PEG-ADI treatment (0.3 μg/mL) for 5 days. In brief, cells were harvested by trypsinization (trypsin 0.25%, w/v, 1 mM ethylenediaminetetraacetic acid) and lysed in a buffer containing 150 mM NaCl, 1% Triton X-100 and 25 mM Tris (pH 7.5). Debris was sedimented by centrifugation for 5 min at 12,000g, and the supernatants were solubilized for 5 min at 100°C in Laemmlis sodium dodecyl sulfate-polyacrylamide gel electrophoresis (SDS-PAGE) sample buffer containing 100 mM dithiothreitol. Protein concentrations of the lysates were determined with a protein quantitation kit (Bio-Rad Laboratories, Hercules, CA), and 75 μg of each sample was separated on a 10% SDS-PAGE gel. Separated polypeptides were then electrophoretically transferred to 0.2-mm nitrocellulose membranes (Schleicher & Schuell, Keene, NH). Membranes were blocked for 1 hr in Tris-buffered saline-Tween (TBS-T; 25 mM Tris, pH 8.0, 150 mM NaCl, and 0.05% Tween-20) containing 5% (w/v) nonfat dried milk. Blots were then probed overnight with primary antibodies and developed using species-specific secondary and tertiary antisera. Immunoreactive material was detected by the enhanced chemiluminescence technique (ECL Amersham).
Cell counting
Cells were plated in a 6-well plate at 1 × 10⁵ cells/well. After 24 hr to allow for cell adherence, the culture medium was removed and replaced with fresh medium with or without PEG-ADI (0.3 μg/mL). At serial time points, viable adherent cell were harvested by trypsinization (trypsin 0.25%, w/v, 1 mM EDTA) and counted with a Coulter electronic particle counter. In each experiment, 3 samples were counted at each time point and the mean value calculated. The entire experiment was repeated at 3 times.
Tetrazolium dye methylthiotetrazole (MTT) cytotoxic assay
For cytotoxicity assays, cells were seeded onto 96-well micro-culture plates at 1 × 10⁴ cells/well and allowed to adhere for 24 hr. After the medium was removed and replaced with fresh medium with or without increasing concentrations of PEG-ADI, the cells were incubated for an additional 7 days. The culture medium was replaced every 3 days with fresh medium including the appropriate dose of PEG-ADI. Cell survival was then quantified using the tetrazolium dye methylthiotetrazole (MTT) as described previously.21 Each experimental data point represents the average value obtained from 8 replicates, and each experiment was repeated at least 3 times. Values are normalized to the untreated (Control) samples. The IC50 is the drug concentration at which 50% of cell growth is inhibited.
FACS analysis
Cell cycle analysis and quantification of apoptosis were carried out as described previously using propidium iodide (PI) staining and fluorescence-activated cell sorting (FACS).19 In brief, cells were plated in 100-mm dishes; after 24 hr, cells were treated for 5 days with PEG-ADI at 0.3 μg/mL. Cells were collected by gentle trypsinization, washed in phosphate-buffered saline (PBS), and pelleted by centrifugation. Cells were fixed in 70% ethanol, washed twice in PBS and resuspended in PBS containing RNAse A (20 μg/mL). Cells were stained with propidium iodide (final concentration 10 μg/mL) for 10 min at room temperature. Samples were analyzed by FACS (FL-3 channel) using a Beckman Coulter Counter Epics XL flow cytometer (Beckman Coulter, Miami, FL). For each sample, 10,000 events were collected and stored for subsequent analysis using EXPO software (version 2.0; Applied Cytometry Systems, Sheffield, UK). Data were elaborated using the Autofit feature of the Multicycle for Windows software (version 3.0, University of Washington, WA) and expressed as fraction of cells in the different cycle phases. The percentage of cells in the sub-G0 phase was quantitated as an estimate of cells under-going apoptosis.
Quantitation of activated caspase-3
MIA-PaCa-2 cells were plated in 6-well culture dishes. After 48 hr, cells were treated with PEG-ADI (0.3 μg/mL) for 24 hr. Active caspases in cells were labeled by adding 10 μM biotin-ZVKD-fmk to the culture medium. Cell extracts were prepared and an ELISA for caspase-3 performed ELISA using the manufacturer's protocol (R&D Systems, Minneapolis, MN). A standard curve of caspase-3 activity was simultaneously prepared for specific determination of active caspase-3 activity.
Immunohistochemistry
Tissue microarrays (TMAs) were evaluated immunohistochemistry for expression of ASS using a primary anti-ASS mouse monoclonal antibody at 2.2 μg/mL. Normal liver, known to express ASS, was used as an additional internal positive control. Slides were deparaffinized and rehydrated through graded alcohols and rinsed with phosphate-buffered saline solution. Antigen retrieval was performed using the microwave technique in 10 mmol/L citrate buffer, pH 6. Visualization was performed using a biotin-ylated horse antimouse, streptoviridin-HRP system (Vector Labs, Burlingame, CA) followed by diaminobenzidine. Sections were counterstained with Gill's hematoxylin.
Animal study
Six- to eight-week old athymic mice were maintained in a dedicated Animal Care Facility according to institutional guidelines. Subcutaneous xenograft tumors were established in the flank bilaterally of mice by the injection of a cell suspension (1 × 10⁶ MIA-PaCa-2 cells were suspended in 100 μL of sterile culture medium). Six mice per treatment group were used yielding twelve tumors per treatment. Thirty days following injection of MIA-PaCa-2 cell suspensions, tumors became palpable (∼5 mm in diameter) and mice were randomly assigned to 1 of 2 treatment regimens: Control (0.5 mL PBS, administered intraperitoneally biweekly) or PEG-ADI (5 IU in 0.5 mL PBS, administered intraperitoneally biweekly). Tumor diameters were measured in 2 dimensions and tumor area estimated as the product of the tumor diameter measurements. A terminal blood draw was obtained 24 hr after the last treatment for plasma measurement of amino acids. At the time of euthanasia, 100 μL of whole blood was obtained and centrifuged (15,000 rpm × 15 min, 4°C) to obtain 50 μL of plasma, to which 12.5 μL of sulfosalicylic acid was added to precipitate intact proteins. Samples were then analyzed on a Beckman 6300 Li-citrate-based amino acid analyzer.22,23
Statistical analysis
Analysis of the effect of the various treatments on cell numbers (cell counting, MTT cytotoxic assays and the DAPI apoptosis assays) was performed using the two-tailed Student's t-test assuming unequal variance. Analysis of ASS expression in pancreatic biopsies was performed using the two-tailed Fisher's exact test.
Results
Human pancreatic cancers have low levels of ASS expression
A tissue microarray was used to evaluate the level of ASS expression in 47 human pancreatic adenocarcinoma specimens and 20 normal pancreas biopsies. ASS expression was not detected in 41 of the 47 (87%) pancreatic adenocarcinoma specimens (Fig. 1a), though present in 6 of the 47 (13%) (Fig. 1b). ASS expression was observed to varying degrees in the non-neoplastic pancreatic ductal cells (Fig. 1c). To specifically demonstrate absence of detectable ASS expression in the pancreatic ductal adenocarcinoma, we examined a biopsy from a focus of metastatic pancreatic adenocarcinoma to the liver, which allows the use of the normal hepatocytes as an internal positive control. In this specimen, the hepatocytes were noted to have detectable ASS expression, while ASS was undetectable in the metastatic pancreatic ductal adenocarcinoma (Fig. 1d).
Figure 1.
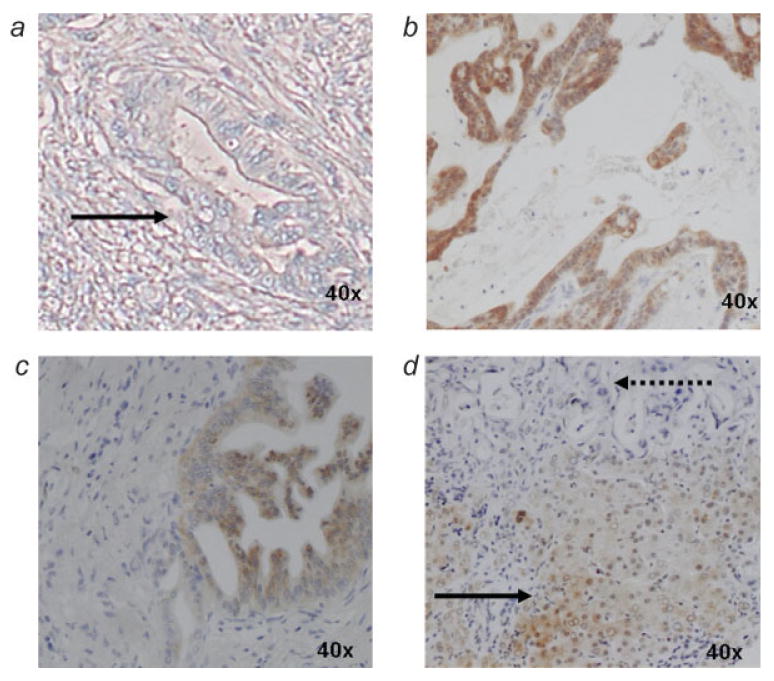
Immunohistochemical analysis of ASS expression in human pancreatic tumors. (a) pancreatic adenocarcinoma lacking ASS expression (solid arrow), (b) pancreatic adenocarcinoma expressing ASS, (c) benign pancreatic ductal cells expressing ASS, (d) metastatic pancreatic adenocarcinoma lacking ASS expression (dotted arrow) with adjacent hepatocytes demonstrating ASS expression (solid arrow). In panels a–c, only neoplastic glandular tissue of pancreatic adenocarcinoma is observed within a dense field of fibroblasts typical of the dense desmoplastic reaction and chronic pancreatitis of pancreatic adenocarcinoma.
ASS expression is variable among pancreatic cancer cell lines
ASS mRNA expression was observed at varying levels among the 4 pancreatic cancer cell lines analyzed by RT-PCR (Fig. 2a). L3.3 has the highest level of expression while MIA-PaCa-2 and PANC-1 have very low levels. Immunoblotting showed expression of ASS protein in 2 (L3.3 and BxPC-3) of the 7 cell lines examined; ASS protein was undetectable in MIA-PaCa-2, PANC-1 and 4 other pancreatic cancer cell lines (Fig. 2b). To investigate the possibility of gene deletion as a cause of absent mRNA expression in MIA-PaCa-2, PCR for the ASS gene was performed. Expression of ASS DNA in MIA-PaCa-2 and PANC-1 was present at a level comparable to L3.3 (Fig. 2c). A potential barrier to PEG-ADI therapy in ASS deficient tumors may be upregulation of ASS promoter activity, which occurs in non-neoplastic cells in situations of depleted intracellular arginine. In normal cells, arginine depletion induces transcriptional activation of ASS and subsequent upregulation of the protein levels.23–26 To test the possibility of ASS induction in human pancreatic adenocarcinoma cell lines following arginine depletion, RT-PCR and Western Blotting for ASS were performed after PEG-ADI treatment in L3.3, MIA-PaCa-2 and PANC-1. There was no increase in ASS mRNA levels in any of the cell lines after 96 hr of PEG-ADI treatment (Fig. 2d). Similarly no change in ASS protein levels was observed after treatment of MIA-PaCa-2 and PANC-1 (Fig. 2e). ASS protein level was increased in L3.3, a cell line with abundant baseline levels of ASS protein and mRNA (Fig. 2e). These data suggest a promoter dysregulation in some pancreatic cancer cells such that the feedback induction by depletion of intracellular arginine is absent.
Figure 2.

Expression of argininosuccinate synthetase (ASS) in pancreatic cancer cell lines. (a) RT-PCR for ASS mRNA (b) Immunoblotting for ASS protein (c) PCR for ASS DNA, (d) Effect of PEG-ADI on ASS mRNA and protein expression in pancreatic cancer cell lines; RT-PCR for ASS mRNA expression in the absence (−) or presence (+) of PEG-ADI(0.3 μg/mL; 5 days), and (e) Western blotting for ASS protein in the absence (−) or presence (+) of PEG-ADI(0.3 μg/mL; 5 days). Actin is shown to demonstrate loading equivalency.
Arginine deprivation by PEG-ADI inhibits human pancreatic cancer cell growth in vitro and induces apoptosis in cells with reduced ASS expression
Having shown that pancreatic cancer cell lines have variable expression of ASS, we next tested the possibility that PEG-ADI would inhibit growth in cells with low ASS expression. MIA-PaCa-2, L3.3 and PANC-1 cells were subjected to increasing doses of PEG-ADI (Fig. 3a). Cell growth was inhibited by PEG-ADI treatment in MIA-PaCa-2 cells, with a concentration of 0.3 μg/mL inhibiting growth by ∼50% (IC50); L3.3 cells were unaffected by a broad dose-range of PEG-ADI. The cytotoxic response of PANC-1 to PEG-ADI was very similar to that of MIA-PaCa-2, with a dose 0.3 μg/mL inhibiting growth by ∼50% (data not shown); therefore, this dose was then used for further studies of the biochemical and cellular effect. The growth kinetics of the 3 pancreatic cancer cell lines was then examined after ADI treatment (0.3 /mL). L3.3 was resistant to growth inhibition by PEG-ADI treatment (Fig. 3b), while MIA-PaCa-2 (Fig. 3c) and PANC-1 cells (data not shown), showed a significant decrease in cell number after PEG-ADI treatment. Although MIA-PaCa-2 is a faster growing cell line than PANC-1, the relative degree of growth inhibition between the cell lines after 4 days of treatment was similar, with an 83 and 67% reduction in cell number, respectively (Fig. 3d).
Figure 3.

Cytoxicity and cellular effects of arginine deprivation by ADI in human pancreatic cancer cell lines. (a) Dose response of PEG-ADI (in μg/mL) in MIA-PaCa-2 cells (solid line) and L3.3 cells (dotted line) determined by MTT assay (as described in the Materials and Methods), (b) Cell growth curve of L3.3 cells treated with PEG-ADI (0.3 μg/mL), (c) Cell growth curve of MIA-PaCa-2 cells treated with PEG-ADI (0.3 μg/mL), (d) Cell number of L3.3, MIA-PaCa-2 and PANC-1 after treatment with PBS compared to PEG-ADI (0.3 μg/mL) (* = p < 0.05 vs. control), (e) Induction of apoptosis determined by quantitation of the percentage of cells in the sub-G0 fraction on FACS analysis after 4 days of PEG-ADI (0.3 μg/mL) in L3.3, MIA-PaCa-2 and PANC-1 cells, (f) Quantitation of active caspase-3 by ELISA in MIA-PaCa-2 and L3.3 after 24 hr of PEG-ADI (0.3 μg/mL).
To determine whether this inhibition of cell growth was due to induction of apoptosis or cell cycle arrest, FACS analysis was performed 4 days after PEG-ADI treatment. PEG-ADI treatment had no effect on the cell cycle distribution of L3.3 (data not shown). Although the fraction of cells in the various cell cycle fractions was unchanged by PEG-ADI in MIA-PaCa-2 and PANC-1, the fraction of cells in the sub-G0 fraction greatly increased after treatment with PEG-ADI (Fig. 3e). In MIA-PaCa-2, this apoptotic fraction increased from 3.0% in untreated cells to 39.9% in treated samples, and from 2.7% in untreated PANC-1 cells to 31.1% in treated samples. Caspase-3 activation is a traditional marker of induction of apoptosis; we determined whether the cell death following PEG-ADI treatment was associated with activation of caspase-3. An ELISA was used to evaluate the level of activated caspase-3 following PEG-ADI treatment in L3.3 (ASS positive) and MIA-PaCa-2 (ASS negative). Only in MIA-PaCa-2 was an increase in activated caspase-3 observed following PEG-ADI treatment (Fig. 3f).
Inhibition of MIA-PaCa-2 xenograft growth by PEG-ADI is associated with arginine depletion in vivo
We then evaluated the effect of PEG-ADI on established MIA-PaCa-2 xenografts. Once tumors had developed to ∼5 mm in size, treatment was initiated with either PBS or PEG-ADI at 5 IU administered biweekly. For a 35 g mouse, this corresponds to ∼140 IU/kg; current therapy in human clinical trials is between 80 and 160 IU/kg. Over 5 weeks of therapy, we noted a greater than 50% reduction in tumor growth following PEG-ADI treatment (Fig. 4a). Mouse body weight was unchanged during treatment, and no overt side-effects of PEG-ADI were observed (data not shown). Twenty four hours following the last dose of PEG-ADI or PBS, 3 mice were euthanized and whole blood obtained for plasma amino acid level determination. In mice treated with PEG-ADI, there was no detectable serum arginine, while PBS-treated mice had significant plasma levels of arginine (Fig. 4b). We specifically examined levels of arginine as well as other amino acids or metabolites involved in arginine biosynthesis and metabolism. PEG-ADI treated mice not only had undetectable arginine, but the level of citrulline was elevated, consistent with the function of PEG-ADI to convert arginine to citrulline (Fig. 4c). Arginine provides diverse biochemical functions beyond the involvement in protein biosynthesis including ammonia excretion, polyamine biosynthesis, and nitric oxide metabolism. Through diverse feedback mechanisms, enzymes involved in precursor metabolism are often upregulated in an effort to overcome arginine depletion.24–26 This leads to much higher precursor levels compared to the absolute deficiency of arginine. Furthermore, the enzymatic efficiencies of the precursor enzymes in arginine biosynthesis are diverse; when normal human volunteers were administered exogenous citrulline that caused a nearly 6-fold increase, plasma arginine levels barely increased 2-fold and urea levels were unchanged.27 Following PEG-ADI therapy in mice, arginine metabolites (urea, ornithine or glutamine) were unchanged.
Figure 4.

Effect of PEG-ADI on MIA-PaCa-2 xenografts and plasma arginine levels. (a) Growth of established MIA-PaCa-2 xenografts in nude mice after treatment with PBS (Control) or PEG-ADI (5 IU) administered biweekly by intraperitoneal injections, (b) HPLC for plasma amino acid levels 24 hr after PBS or PEG-ADI (5 IU) with notation for location of arginine elution at 110.767 min (note that the entire HPLC data including peaks for arginine metabolites including citrulline has been cropped out), and (c) plasma arginine and related precursors or metabolites from 3 mice 24 hr after PBS or PEG-ADI (5 IU). [Color figure can be viewed in the online issue, which is available at www.interscience.wiley.com.]
Discussion
Arginine deprivation has long been established as a method to induce cancer cell death in those tumor for which arginine is an auxotrophic growth factor due to dysregulation of the enzymes required for biosynthesis.15 After a series of negative investigations using arginase in the 1980s, enthusiasm for this approach significantly dropped off. Recently, however, the limitations of therapy using administration of enzymes has been overcome by increasing plasma stability by pegylation.12 In fact, pegylated arginase has been similarly shown to inhibit the growth of hepatocellular carcinoma both in vitro and in vivo.28 There are 2 primary differences between arginase and ADI as therapeutic approaches to arginine deprivation: (i) ADI is a mycoplasma-derived enzyme and therefore may have different antigenic properties, and (ii) arginase depletes arginine by increase metabolism to urea, which may be associated with systemic toxicity. It remains unclear, however, which approach will lead to increased efficacy with a more tolerable toxicity profile as pegylated arginase has not been tested in human clinical trials.
We found that the majority of human pancreatic tumors and pancreatic cancer cell lines have low expression of ASS. Depletion of cellular arginine by PEG-ADI suppressed pancreatic cancer growth in vitro and in vivo and induced apoptosis in those cell lines with low expression of ASS. Despite its central role in multiple metabolic processes, arginine deprivation is well tolerated by humans presumably because many different cells can synthesize arginine from citrulline and aspartate through ASS and ASL. Normal human subjects deprived of dietary arginine for 2 weeks showed no change in overall nitrogen balance.29 In clinical trials of PEG-ADItreatment of hepatocellular carcinoma and melanoma, side effects were minimal despite elimination of essentially all plasma arginine for as long as 3 months.1,2 Coupling the early clinical experience with PEG-ADI and our preclinical data, arginine deprivation by PEG-ADI may be a potential therapeutic approach in pancreatic cancer, a disease characterized by extremely few effective treatment options.
The mechanism by which ASS expression is altered in pancreatic cancer is unclear. In normal tissues, the activity of the ASS promoter is regulated by various mechanisms triggered by both arginine precursors and metabolites. Glutamine, a precursor of citrulline, regulates ASS levels through O-glycosylation of the transcription factor Sp1, facilitating nuclear translocation and transactivation of the ASS promoter.30–32 Alternatively, under pro-inflammatory stimuli driving iNOS mediated utilization of arginine to generate NO, transactivation of the ASS promoter occurs through increased NF-κB activity.33–35 However, in our study of pancreatic cancer cell lines, arginine deprivation did not appear to increase ASS mRNA or protein in those cell lines with low or absent ASS. These data suggest a relatively permanent silencing of the promoter; recently Szlosarek et al. observed methylation of the promoter in mesothelioma cell lines as a potential mechanism for ASS gene silencing.36
The mechanism of cell death induced by metabolic stress may involve autophagy, a lysosomal-driven process of cellular destruction.37–41 It is unclear whether autophagy is a necessary precursor of apoptotic cell death following metabolic stress, or whether it is a protective mechanism that inhibits apoptosis.38 Cui et al. noted that autophagy facilitated oridonin-mediated apoptosis in breast cancer, while Abedin et al. noted that autophagy prevents chemotherapy-mediated apoptosis.42,43 The differential involvement of autophagy may be related to the severity of the metabolic stress; bulk protein recycling may prevent apoptosis in situations of relatively minor insults while more severe disruptions of cellular energy homeostasis trigger apoptosis. Although we observed assembly of the autophago-some (data not shown) following PEG-ADI treatment, further studies are ongoing to determine whether autophagy triggers the caspase activation we observed with induction of apoptosis. Yet the observation of cell death in association with autophagy suggests a coupling of these events which may be exploited, given the traditional resistance of pancreatic cancer to genotoxic-mediated apoptosis.
In conclusion, pancreatic cancers frequently have low expression of ASS, which predicts sensitivity to the growth inhibition by arginine deprivation through PEG-ADI treatment. The mechanism of cell growth inhibition may include induction of autophagy as well as the traditional apoptotic pathways. Arginine deprivation by PEG-ADI may prove to be a novel treatment for pancreatic cancer.
Acknowledgments
The authors thank Ms. Maggie Chou for performing the immunohistochemistry and Ms. Katie Bell for guidance in tissue microarray construction.
Grant sponsor: DesigneRx Pharmacologics (Vacaville, California).
References
- 1.Ascierto PA, Scala S, Castello G, Daponte A, Simeone E, Ottaiano A, Beneduce G, De Rosa V, Izzo F, Melucci MT, Ensor CM, Prestayko AW, et al. Pegylated arginine deiminase treatment of patients with metastatic melanoma: results from phase I and II studies. J Clin Oncol. 2005;23:7660–8. doi: 10.1200/JCO.2005.02.0933. [DOI] [PubMed] [Google Scholar]
- 2.Izzo F, Marra P, Beneduce G, Castello G, Vallone P, De Rosa V, Cremona F, Ensor CM, Holtsberg FW, Bomalaski JS, Clark MA, Ng C, et al. Pegylated arginine deiminase treatment of patients with unresectable hepatocellular carcinoma: results from phase I/II studies. J Clin Oncol. 2004;22:1815–22. doi: 10.1200/JCO.2004.11.120. [DOI] [PubMed] [Google Scholar]
- 3.Viera Pinheiro JP, Boos J. The best way to use asparaginase in childhood acute lymphocytic leukemia: still to be defined? Br J Haematol. 2004;125:117–27. doi: 10.1111/j.1365-2141.2004.04863.x. [DOI] [PubMed] [Google Scholar]
- 4.Gilroy E. The influence of arginine upon the growth rate of a transplantable tumour in the mouse. Biochem J. 1930;24:589–95. doi: 10.1042/bj0240589. [DOI] [PMC free article] [PubMed] [Google Scholar]
- 5.Gonzalez GG, Byus CV. Effect of dietary arginine restriction upon ornithine and polyamine metabolism during two-stage epidermal carcinogenesis in the mouse. Cancer Res. 1991;51:2932–9. [PubMed] [Google Scholar]
- 6.Yeatman TJ, Risley GL, Brunson ME. Depletion of dietary arginine inhibits growth of metastatic tumor. Arch Surg. 1991;126:1376–32. doi: 10.1001/archsurg.1991.01410350066010. [DOI] [PubMed] [Google Scholar]
- 7.Morris SM. Arginine metabolism: enzymology, nutrition, and clinical significance. J Nutr. 2004;134:2743S–7S. [PubMed] [Google Scholar]
- 8.Curis E, Nicolis I, Moinard C, Osowska S, Zerrouk N, Bénazeth S, Cynober L. Almost all about citrulline in mammals. Amino Acids. 2005;29:177–205. doi: 10.1007/s00726-005-0235-4. [DOI] [PubMed] [Google Scholar]
- 9.O'Brien WE. Isolation and characterization of argininosuccinate synthetase from human liver. Biochemistry. 1979;18:5353–6. doi: 10.1021/bi00591a015. [DOI] [PubMed] [Google Scholar]
- 10.Husson A, Brasse-Lagnel C, Fairand A, Renouf S, Lavoinne A. Argininosuccinate synthetase from the urea cycle to the citrulline-NO cycle. Eur J Biochem. 2003;270:1887–99. doi: 10.1046/j.1432-1033.2003.03559.x. [DOI] [PubMed] [Google Scholar]
- 11.Noh EJ, Kang SW, Shin YJ, Kim DC, Park IS, Kim MY, Chun BG, Min BH. Characterization of mycoplasma arginine deiminase expressed in E. coli and its inhibitory regulation of nitric oxide synthesis. Mol Cells. 2002;13:137–43. [PubMed] [Google Scholar]
- 12.Holtsberg FW, Ensor CM, Steiner MR, Bomalaski JS, Clark MA. Poly(ethylene glycol) (PEG) conjugated arginine deiminase: effects of PEG formulations on its pharmacological properties. J Control Release. 2002;80:259–71. doi: 10.1016/s0168-3659(02)00042-1. [DOI] [PubMed] [Google Scholar]
- 13.Ensor CM, Holtsberg FW, Bomalaski JS, Clark MA. Pegylated arginine deiminase (ADI-SS PEG20,000 mw) inhibits human melanomas and hepatocellular carcinomas in vitro and in vivo. Cancer Res. 2002;62:5443–50. [PubMed] [Google Scholar]
- 14.Gong H, Zölzer F, von Recklinghausen G, Rössler J, Breit S, Havers W, Fotsis T, Schweigerer L. Arginine deiminase inhibits cell proliferation by arresting cell cycle and inducing apoptosis. Biochem Biophys Res Commun. 1999;261:10–14. doi: 10.1006/bbrc.1999.1004. [DOI] [PubMed] [Google Scholar]
- 15.Wheatley DN, Campbell E. Arginine deprivation, growth inhibition and tumour cell death: deficient utilization of citrulline by malignant cells. Br J Cancer. 2003;89:573–6. doi: 10.1038/sj.bjc.6601134. [DOI] [PMC free article] [PubMed] [Google Scholar]
- 16.Shen LJ, Lin WC, Belloussow K, Shen WC. Resistance to the antiproliferative activity of recombinant arginine deiminase in cell culture correlates with the endogenous enzyme, argininosuccinate synthetase. Cancer Lett. 2003;191:165–70. doi: 10.1016/s030-43835(02)00693-6. [DOI] [PubMed] [Google Scholar]
- 17.Shen LJ, Belloussow K, Shen WC. Modulation of arginine metabolic pathways as the potential anti-tumor mechanism of recombinant arginine deiminase. Cancer Lett. 2006;231:30–5. doi: 10.1016/j.canlet.2005.01.007. [DOI] [PubMed] [Google Scholar]
- 18.Yoon CY, Shim YJ, Kim EH, Lee JH, Won NH, Kim JH, Park IS, Yoon DK, Min BH. Renal cell carcinoma does not express argininosuccinate synthetase and is highly sensitive to arginine deprivation via arginine deiminase. Int J Cancer. 2007;120:897–905. doi: 10.1002/ijc.22322. [DOI] [PubMed] [Google Scholar]
- 19.Curley SA, Bomalaski JS, Ensor CM, Holtsberg FW, Clark MA. Regression of hepatocellular cancer in a patient treated with arginine deiminase. Hepatogastroenterology. 2003;50:1214–16. [PubMed] [Google Scholar]
- 20.Dillon BJ, Holtsberg FW, Ensor CM, Bomalaski JS, Clark MA. Biochemical characterization of the arginine degrading enzymes arginase and arginine deiminase and their effect on nitric oxide production. Med Sci Monit. 2002;8:BR248–53. [PubMed] [Google Scholar]
- 21.Fahy BN, Schlieman MG, Mortenson MM, Virudachalam S, Bold RJ. Targeting BCL-2 overexpression in various human malignancies through NF-κB inhibition by the proteasome inhibitor bortezomib. Cancer Chemother Pharmacol. 2005;56:46–54. doi: 10.1007/s00280-004-0944-5. [DOI] [PubMed] [Google Scholar]
- 22.Cooper C, Packer N, Williams K. Amino acid analysis protocols, methods in molecular biology. Vol. 159. Totawa, NJ: Humana Press; 2000. [Google Scholar]
- 23.Ozols J. Amino acid analysis. In: Deutscher MP, editor. Guide to protein purification, methods in enzymology. Vol. 182. San Diego, CA: Academic Press; 1990. pp. 587–601. [DOI] [PubMed] [Google Scholar]
- 24.Jackson MJ, Allen SJ, Beaudet AL, O'Brien WE. Metabolite regulation of argininosuccinate synthetase in cultured human cells. J Biol Chem. 1988;263:16388–94. [PubMed] [Google Scholar]
- 25.Schimke RT. Enzymes of arginine metabolism in mammalian cell culture. J Biol Chem. 1964;239:136–145. [PubMed] [Google Scholar]
- 26.Wheatley DN. Arginine deprivation and metabolomics: important aspects of intermediary metabolism in relation to the differential sensitivity of normal and tumour cells. Sem Cancer Biol. 2005;15:247–53. doi: 10.1016/j.semcancer.2005.04.002. [DOI] [PubMed] [Google Scholar]
- 27.Rougé C, Des Robert C, Robins A, Le Bacquer O, Volteau C, De La Cochetière MF, Darmaun D. Manipulation of citrulline availability in humans. Am J Physiol Gastrointest Liver Physiol. 2007;293:G1061–7. doi: 10.1152/ajpgi.00289.2007. [DOI] [PubMed] [Google Scholar]
- 28.Cheng PN, Lam TL, Lam WM, Tsui SM, Cheng AS, Lo WH, Leung YC. Pegylated recombinant human arginase (rhArg-peg5000mw) inhibits the in vitro and in vivo proliferation of human hepatocellular carcinoma through arginine depletion. Cancer Res. 2007;67:309–17. doi: 10.1158/0008-5472.CAN-06-1945. [DOI] [PubMed] [Google Scholar]
- 29.Rose WC, Haines WJ, Warner DT. The amino acid requirements of man: the role of lysine, arginine, and tryptophan. J Biol Chem. 1954;106:421–30. [PubMed] [Google Scholar]
- 30.Brasse-Lagnel C, Fairand A, Lavoinne A, Husson A. Glutamine stimulates argininosuccinate synthetase gene expression through cytosolic O-glycosylation of Sp1 in Caco-2 cells. J Biol Chem. 2002;278:52504–10. doi: 10.1074/jbc.M306752200. [DOI] [PubMed] [Google Scholar]
- 31.Quillard M, Husson A, Lavoinne A. Glutamine increase argininosuccinate synthetase mRNA levels in rat hepatocytes. The involvement of cell swelling. Eur J Biochem. 1996;236:56–59. doi: 10.1111/j.1432-1033.1996.00056.x. [DOI] [PubMed] [Google Scholar]
- 32.Anderson GM, Freytag SO. Synergistic activation of a human promoter in vivo by transcription factor Sp1. Mol Cell Biol. 1991;11:1935–43. doi: 10.1128/mcb.11.4.1935. [DOI] [PMC free article] [PubMed] [Google Scholar]
- 33.Hattori Y, Campbell EB, Gross SS. Argininosuccinate synthetase mRNA and activity are induced by immunostimulants in vascular smooth muscle. Role in the regeneration of arginine for nitric oxide synthesis. J Biol Chem. 1994;269:9405–8. [PubMed] [Google Scholar]
- 34.Brasse-Lagnel C, Lavoinne A, Fairand A, Vavasseur K, Husson A. IL-1beta stimulates argininosuccinate synthetase gene expression through NF-kappaB in Caco-2 cells. Biochim. 2005;87:403–9. doi: 10.1016/j.biochi.2005.01.009. [DOI] [PubMed] [Google Scholar]
- 35.Nagasaki A, Gotoh T, Takeya M, Yu Y, Takiguchi M, Matsuzaki H, Takatsuki K, Mori M. Coinduction of nitric oxide synthase, argininosuccinate synthetase, and arginiosuccinate lyase in lipopolysaccharide-treated rats. RNA blot, immunoblot, and immunohistochemical analysis. J Biol Chem. 1996;271:2658–62. doi: 10.1074/jbc.271.5.2658. [DOI] [PubMed] [Google Scholar]
- 36.Szlosarek PW, Klabatsa A, Pallaska A, Sheaff M, Smith P, Crook T, Grimshaw MJ, Steele JP, Rudd RM, Balkwill FR, Fennell DA. In vivo loss of expression of argininosuccinate synthetase in malignant pleural mesothelioma is a biomarker for susceptibility to arginine depletion. Clin Cancer Res. 2006;12:7126–31. doi: 10.1158/1078-0432.CCR-06-1101. [DOI] [PubMed] [Google Scholar]
- 37.Tsujimoto Y, Shimizu S. Another way to die: autophagic programmed cell death. Cell Death Differ. 2005;12(Suppl 2):1528–34. doi: 10.1038/sj.cdd.4401777. [DOI] [PubMed] [Google Scholar]
- 38.Gozuacik D, Kimchi A. Autophagy as a cell death and tumor suppressor mechanism. Oncogene. 2004;23:2891–906. doi: 10.1038/sj.onc.1207521. [DOI] [PubMed] [Google Scholar]
- 39.Klionsky DJ, Emr SD. Autophagy as a regulated pathway of cellular degradation. Science. 2000;290:1717–21. doi: 10.1126/science.290.5497.1717. [DOI] [PMC free article] [PubMed] [Google Scholar]
- 40.Klionsky DJ. Autophagy: from phenomenology to molecular understanding in less than a decade. Nature Rev Mol Cel Biol. 2007;8:931–7. doi: 10.1038/nrm2245. [DOI] [PubMed] [Google Scholar]
- 41.Amaravadi RK, Thompson CB. The roles of therapy-induced autophagy and necrosis in cancer treatment. Clin Cancer Res. 2007;13:7271–9. doi: 10.1158/1078-0432.CCR-07-1595. [DOI] [PubMed] [Google Scholar]
- 42.Cui Q, Tashiro S, Onodera S, Minami M, Ikejima T. Autophagy preceded apoptosis in oridonin-treated human breast cancer MCF-7 cells. Biol Pharm Bull. 2007;30:859–64. doi: 10.1248/bpb.30.859. [DOI] [PubMed] [Google Scholar]
- 43.Abedin MJ, Wang D, McDonnell MA, Lehmann U, Kelekar A. Autophagy delays apoptotic death in breast cancer cells following DNA damage. Cell Death Differ. 2007;14:500–10. doi: 10.1038/sj.cdd.4402039. [DOI] [PubMed] [Google Scholar]