Abstract
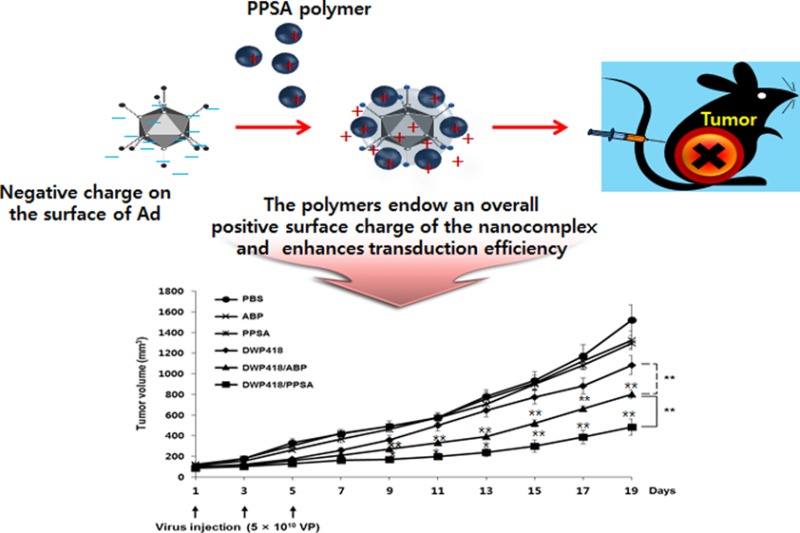
Adenovirus (Ad) vectors show promise as cancer gene therapy delivery vehicles, but immunogenic safety concerns and coxsackie and adenovirus receptor (CAR)-dependency have limited their use. Alternately, biocompatible and bioreducible nonviral vectors, including arginine-grafted cationic polymers, have been shown to deliver nucleic acids through a cell penetration peptide (CPP) and protein transduction domain (PTD) effect. We utilized the advantages of both viral and nonviral vectors to develop a hybrid gene delivery vehicle by coating Ad with mPEG-PEI-g-Arg-S-S-Arg-g-PEI-mPEG (Ad/PPSA). Characterization of Ad/PPSA particle size and zeta potential showed an overall size and cationic charge increase in a polymer concentration-dependent manner. Ad/PPSA also showed a marked transduction efficiency increase in both CAR-negative and -positive cells compared to naked Ad. Competition assays demonstrated that Ad/PPSA produced higher transgene expression levels than naked Ad and achieved CAR-independent transduction. Oncolytic Ad (DWP418)/PPSA was able to overcome the nonspecificity of polymer-only therapies by demonstrating cancer-specific killing effects. Furthermore, the DWP418/PPSA nanocomplex elicited a 2.24-fold greater antitumor efficacy than naked Ad in vivo. This was supported by immunohistochemical confirmation of Ad E1As accumulation in MCF7 xenografted tumors. Lastly, intravenous injection of DWP418/PPSA elicited less innate immune response compared to naked Ad, evaluated by interleukin-6 cytokine release into the serum. The increased antitumor effect and improved vector targeting to both CAR-negative and -positive cells make DWP418/PPSA a promising tool for cancer gene therapy.
1. Introduction
Over the past two decades, both viral and nonviral vectors have emerged as potential delivery systems for cancer gene therapies.1−4 However, each system has disadvantages that limit their biomedical applications. Various viral gene delivery systems have been studied for gene therapy such as adenoviruses (Ads), lentiviruses, retroviruses, and adeno-associated viruses.5−7 Ads have several unique features including efficient infection, high loading capacity, and a lack of insertional mutagenesis. As a result, it has gained widespread popularity as a potential anticancer therapy. However, Ad gene delivery is limited by its dependence on the coxsackievirus and adenovirus receptor (CAR) for transduction.8
Nonviral vectors have several advantages over viral vectors. They elicit low immune response, have good reproducibility, and have a relatively simple quality control process. Cationic polymers have been extensively explored as potential, nonviral gene carriers. These include polyethylenimine,9−11 poly(amidoamine)s,12−16 poly(amino esters),17 and poly(l-lysine).18−20 However, cationic polymer-based gene delivery systems have poor transduction efficiencies when compared with viral ones. Recently, numerous investigations have been conducted on the cell-penetrating characteristics of cationic arginine (Arg) and Tat peptides containing Arg residues. Arg residues are capable of delivering nucleic acids efficiently through intracellular translocation,21−24 which may be due to the membrane permeability of Arg moieties.25−27 Accordingly, various cationic polymers, such as chitosan,27 poly(amidoamides), and dendrimers,28−31 have been modified with arginine residues, which produced significantly enhanced transduction efficiency compared to unmodified polymers.
In our previous study, we sought to confer nonviral advantages to a viral vector. We produced an arginine-grafted, bioreducible, poly(disulfide amine) (ABP) polymer-modified Ad (Ad/ABP). We showed that Ad/ABP elicited enhanced transduction efficiency and reduced innate immune response when compared to naked Ad.32 However, the complex vector size was over 500 nm, larger than ideal for efficient cellular uptake.32 The maximum dimension for efficient cellular uptake through a nonspecific, clathrin-dependent process is less than 200 nm. In addition, there is a major concern that the positive surface charge of polymer-modified Ads may produce nonspecific binding and uptake into normal cells. Therefore, further experimentation is necessary to develop a bioreducible/bioresponsive Ad/polymer complex for efficient in vivo gene therapy applications.
In this study, we designed and synthesized cationic polymers containing arginine moieties capable of facilitating cell entry and enhancing cancer cell transduction efficacy. We developed mPEG-PEI-g-Arg-S-S-Arg-g-PEI-mPEG (PPSA). This contains both bioreducible disulfide bonds and arginine functional moieties, to reduce cytotoxicity and enhance transduction efficacy, respectively. The PPSA chemical structure and Ad/PPSA nanocomplex size and zeta potentials were characterized. We also explored the polymer concentration effect of Ad/PPSA nanocomplex on transduction efficiency and selective cancer cell killing in vitro. Furthermore, we demonstrated that the Ad/PPSA nanocomplex increased antitumor efficacy and reduced toxicity/ immunogenicity in vivo using an MCF7 xenograft tumor model and Balb/C immune-competent mice, respectively.
2. Experimental Section
2.1. Materials
Methoxyl PEG succinimidyl carbonate NHS was purchased from Nanocs (New York, NY). Arginine, N,N-diisoproylethylamine (DIPEA), trifluoroacetic acid (TFA), triisopropyl silane (TIPS), polyethylenimine 1.8 kDa (50 wt % in water), branched polyethylenimine (25 kDa), N-hydroxysuccinimide, 2-imidothiolane hydrochloride (Traut’s reagent), dl-dithiothreitol, and dimethylformaldehyde (DMF) were purchased from Sigma (St Louis, MO). 2-(1-H-Benzotriazole-1-yl)-1,1,3,3-tetramethyluronium hexafluorophosphate (HBTU) was purchased from Novabiochem (San Diego, CA). Fmoc-l-Arg(Pbf)-OH was purchased from Anaspec, Inc. (San Jose, CA). Ellman’s reagent was purchased from Thermo scientific (Rockford, IL). Deuterium oxide was purchased from Cambridge Isotope Laboratories, Inc. (Andover, MA). All other reagents used were of analytical purity and obtained commercially.
2.2. Synthesis of Methoxy Poly(ethylene glycol)–Polyethylenimine (mPEG-PEI)
PEG-PEI was synthesized as described previously.33 Polyethylenimine was dissolved in phosphate buffered saline (PBS) pH 7.4 (3.0 mL). One molar equivalent of methoxyl PEG succinimidyl carbonate NHS (mPEG-NHS, 2.0 kDa) was subsequently added. The reaction mixture was stirred at room temperature overnight. The product was dialyzed against double distilled (DD) water at room temperature in a Slide-A-Lyzer dialysis cassette (2.0 kDa MWCO, Pierce, Rockford, IL, USA) for 24 h and lyophilized, to give a pale white substance (75% yield). The chemical structure was confirmed by 1H NMR observing D2O solubilized sample at 300 MHz (Mercury Plus 300 MHz Spectrometer, Varian, Inc. Vernon Hills, IL, USA). Characteristic PEG (3.6 ppm, -(CH2CH2O)−) and PEI (2.0 to 3.0 ppm) peaks were observed.
2.3. Synthesis of Methoxy Poly(ethylene glycol)–Polyethylenimine Grafted Arginine (mPEG-PEI-g-Arg)
Arginine was grafted on to mPEG-PEI as described previously.28 The grafting occurred by combining 9 equiv of both Fmoc-Arg(Pbf)-OH and HBTU with 12 equiv of DIPEA in DMF (1.0 mL) at room temperature for 48 h. The resulting product was precipitated in excess diethyl ether twice to remove any unreacted reagents. The precipitant was mixed with an equal volume of 30% piperidine (Sigma, St Louis, MO, USA) solution in DMF at room temperature for 1 h to remove the Fmoc moiety from Fmoc-Arg(Pbf)–OH. The precipitation procedure was repeated twice. Reagent solution (TFA: TIPS: H20, 95/2.5/2.5 v/v) was added to the precipitate to deprotect the arginine residue Pbf groups. The reaction was carried out at room temperature for 30 min. The polymer was precipitated with ether. The final product, mPEG-PEI-g-Arg, was dialyzed (2.0 kDa MWCO) against DD water overnight and lyophilized, to yield a white product (60% yield). The chemical structure was confirmed using 1H NMR as described in section 2.2. Characteristic peaks for PEG (3.6 ppm, −(CH2CH2O)−), PEI (2.0 to 3.0 ppm), and arginine (1.66 ppm −(−HCCH2CH2CH2NH−); 1.86 ppm (−HCCH2CH2CH2NH−); 3.24 ppm (−HCCH2CH2CH2NH−); and 3.86 ppm (−HCCH2CH2CH2NH−) were observed.
2.4. Synthesis of mPEG-PEI-g-Arg-S-S-Arg-g-PEI-mPEG (PPSA)
mPEG-PEI-g-Arg was dissolved in PBS (2.0 mL, pH 7.4, 4 mg/mL EDTA). Eight equivalents of 2-imidothiolane hydrochloride (Traut’s reagent) per surface amine in mPEG-PEI-g-Arg were added and stirred continuously at room temperature for 3 h. The product was dialyzed against DD water (2.0 kDa MWCO) to remove unreacted reagents and the product, mPEG-PEI-g-Arg-SH, was lyophilized. Lyophylized mPEG-PEI-Arg-SH was dissolved in 1× PBS and 500 μL DMSO was added to oxidize the SH groups. The reaction mixture was stirred at room temperature for 48 h. The product was dialyzed against DD water (2 kDa MWCO) for 24 h. Lastly, the product, mPEG-PEI-g-Arg-S-S-Arg-g-PEI-mPEG (PPSA), was lyophilized, to give a white product (80% yield). The disulfide cross-linking was confirmed by the Ellman test as described previously.34
2.5. Cell Lines and Cell Culture
The following cell lines were purchased from the American Type Culture Collection (ATCC, Manassas, VA): HEK293, a human embryonic kidney cell line expressing the Ad E1 replication protein; A549, a nonsmall cell lung carcinoma cell line; and MCF7, a breast carcinoma cell line. All cell lines were cultured in Dulbecco’s Modified Eagle’s Medium (DMEM; Gibco BRL, Grand Island, NY) containing 10% fetal bovine serum (Gibco BRL) and penicillin/streptomycin (Gibco BRL) at 37 °C in a humidified 5% CO2 atmosphere.
2.6. Ad Preparation
Replication-incompetent Ad expressing green fluorescent protein (GFP) under cytomegalovirus (CMV) promoter control in the E1 region (dE1/GFP) and oncolytic Ad (DWP418) were used, as described in our previous study.35−38 All Ads were propagated in HEK293 cells, followed by CsCl (Sigma, St Louis, MI) density purification. Viral particle (VP) number was calculated from OD260 nm measurements with an absorbance value of 1 equiv to 1012 VP per mL. Infectious titers (plaque forming unit per milliliter (PFU/mL)) were determined using a limiting dilution assay on HEK293 cells. The viral particle/PFU ratios for dE1/GFP and DWP418 were 29:1 and 81:1, respectively. The MOI was calculated from the infectious titers.
2.7. PPSA Cytotoxicity
Various cationic polymers were analyzed for cytotoxicity, including 25 kDa branched polyethylenimine (25K PEI), the previous Ad polymer ABP, and PPSA. Quantitative cell viability determination was performed by measuring conversion of MTT to formazan as a function of time.39,40 A549 and MCF7 cells were grown to 50% confluence in 96 well plates and were then treated with varying polymer concentrations, up to 10 μg/mL. Three days following polymer treatment, 100 μL of 2 mg/mL MTT in PBS was added to each well and incubated for 4 h at 37 °C. The supernatant was discarded, and the precipitate was dissolved in 100 μL dimethyl sulfoxide (DMSO). Plates were read on a microplate reader (Bio-Rad, Hercules, CA) at 540 nm.
2.8. Ad/PPSA Complex Preparation
To make the Ad/PPSA complex, Ad particles (2 × 10¹⁰ VP) in PBS (pH 7.4) were mixed with varying concentrations of PPSA polymer. This resulted in ratios of 2 × 10⁴, 1 × 10⁵, 4 × 10⁵, and 1 × 10⁶ PPSAs per Ad particle. The solution was incubated at room temperature for 30 min prior to use.
2.9. Particle Size and Surface Charge Measurements
The average particle sizes and surface charges of naked Ad and Ad/PPSA were determined with dynamic laser scattering (DLS) at 488 nm and zeta particle analysis (90° fixed angle scattering) at 633 nm, respectively, using the Zetasizer 3000HS (Malvern Instrument Inc., Worcestershire, UK) with a He–Ne laser at room temperature. The sizes and charges presented were the average of five independent runs.
2.10. Gel Retardation
Gel retardation was performed to examine the encapsulation profile of the Ad/PPSA complex. After Ad/PPSA complex generation, a virus lysis buffer (0.1% sodium dodecyl sulfate, 1 mM Tris-HCl (pH7.4), and 0.1 mM EDTA) was added to the Ad/PPSA complex and incubated at 56 °C for 30 min. The Ad/PPSA complex sample was loaded on a 1% (w/v) agarose gel in 1× TAE buffer (10 mM Tris-HCl, 1% (v/v) acetic acid, and 1 mM EDTA) containing ethidium bromide. Electrophoresis was performed at 100 V for 30 min in the same buffer. The DNA band locations were visualized using a ChemiDoc gel documentation system (Syngene, Cambridge, UK).
2.11. Transduction Efficiency
Cancer cells (A549 or MCF7) were seeded into a 24-well plate and cultured to 60% confluence 1 day prior to the transduction assay. Cells were treated with naked Ad (dE1/GFP) or Ad (dE1/GFP)/polymer complex (Ad/25K PEI, Ad/ABP, or Ad/PPSA). The complexes with 4 × 10⁵ and 1 × 10⁶ PPSA:Ad molar ratios were used for these experiments. Different MOIs were applied to A549 and MCF7 (30 and 500 MOI, respectively) due to the differing Ad susceptibility of each cell line. The transduced cells were incubated for an additional 48 h. Cells were imaged using fluorescence microscopy (Olympus IX81; Olympus Optical, Tokyo, Japan), and the GFP expression levels were quantified using FACS analysis BD FACScan analyzer (Becton–Dickinson, San Jose, CA) and the CellQuest software (Becton-Dickinson). Data from 10 000 events were collected and the mean ± standard deviations of three independent experiments were presented.
2.12. Competition Assay
A549 cells (5 × 10⁴ cells per well) were seeded into a 24-well plate. Following 24 h incubation, the cells were pretreated with PBS or purified Ad fiber knob protein (2 and 10 mg/mL in serum-free medium) for 30 min.41 The cells were washed 3 times with PBS and then treated with 30 MOI of naked Ad or Ad/PPSA complex (1 × 10⁶ PPSA:Ad molar ratio) in DMEM medium with 5% FBS. The cells were incubated for 2 days, imaged using fluorescence microscopy (Olympus IX81; Olympus Optical), and analyzed by the BD FACScan analyzer (Beckton-Dickinson) and CellQuest software (Beckton-Dickinson).
2.13. In Vivo Antitumor Effects and Histological Analysis
MCF7 cells (5 × 10⁶) were injected subcutaneously into 6 week-old female nude mice (Orientbio Inc., Gyeonggi-do, Korea). When the tumor volume reached approximately 100 mm3, the mice were injected intratumorally with PBS, naked Ad, ABP, PPSA, Ad/ABP, or Ad/PPSA (5 × 10¹⁰ VP per injection, 1 × 10⁶ PPSA:Ad molar ratio) every other day for 5 days (three injections total). Tumor growth was assessed every 2 days by caliper measurements and a volume calculation of volume (mm3) = 0.523 × length (mm) × width (mm)2. For histological analysis, tumors were harvested 3 days following the final treatment, fixed in 10% formalin, and embedded in paraffin. Tumor sections (5 μm thickness) were stained with hematoxylin and eosin (H&E) and examined by light microscopy at 100× magnification.
For immunohistochemical analyses, paraffin-embedded tumor tissues were first deparaffinized by incubation in xylene for 10 min, and then sequentially with 100%, 90% and 70% ethanol for 5 min each. The tissues were then blocked with 3% bovine serum albumin for 2 h at room temperature and stained with an Ad E1A-specific antibody (SC-430; Santa Cruz Biotechnology, Santa Cruz, CA) or a proliferating cell nuclear antigen (PCNA)-specific antibody (Neomarkers, Freemont, CA). Sections were counterstained with Mayer’s hematoxylin. Apoptosis detection by terminal deoxynucleotidyltransferase-mediated dUTP-biotin nick end labeling (TUNEL) analysis was performed using the Apoptag detection kit (Serologicals Corp., Norcross, GA) according to the manufacturer’s instructions.
2.14. Assay for Innate Immune Response
To determine the effects of naked DWP418, DWP418/ABP, or DWP418/PPSA complex on the innate immune response, Balb/C mice were systemically injected with naked DWP418, DWP418/ABP, or DWP418/PPSA complex (2 × 10¹⁰ VP/mouse, 1 × 10⁶ PPSA:Ad molar ratio). Serum samples were collected 6 h postinjection. IL-6 serum levels were quantified using an IL-6 ELISA kit (R&D Systems, Minneapolis, MN) according to the manufacturer’s instructions.
2.15. Assay for Adaptive Immune Response
For assessing adaptive immune response against Ad, Balb/c mouse was first treated with naked Ad (dE1/GFP) at a single dose of 1 × 10¹⁰ viral particles (VP) intravenously, and 14 days later, Ad was readministered to generate neurtralizing Ab against Ad. Mouse serum immunized with or without naked Ad was harvested at 14 days after second injection and incubated at 56 °C for 45 min to inactivate blood complement and stored at −20 °C. Naked dE1/GFP (30 MOI) or dE1/GFP coated with PPSA polymer (1× 10⁶ molecules/VP) (30 MOI) was exposed to PBS or serum with or without Ad-specific neutralizing Ab for 30 min at 37 °C, and then added to human cancer cells (A549). After 2 days of incubation, GFP expression level was observed by fluorescence microscopy (Olympus BX51) and FACScan flow cytometer (Beckton-Dickinson).
2.16. In Vivo Toxicity Assessment
To determine potential in vivo toxicity, naked DWP418, DWP418/ABP, or DWP418/PPSA (2 × 10¹⁰ VP/mouse, 1 × 10⁶ PPSA:Ad molar ratio) was injected intravenously into Balb/C mice. Aspartate aminotransferase (AST) and alanine transaminase (ALT) serum levels were measured 3 days postinjection.
2.17. Statistical Analysis
The data were expressed as the mean ± standard deviation (SD). Statistical analyses were performed with the two-tailed Student t test (SPSS 13.0 software; SPSS, Chicago, IL); Groups with P values less than 0.05 were considered statistically significant.
3. Results and Discussion
3.1. Synthesis and Characterization of Bioreducible Polymer
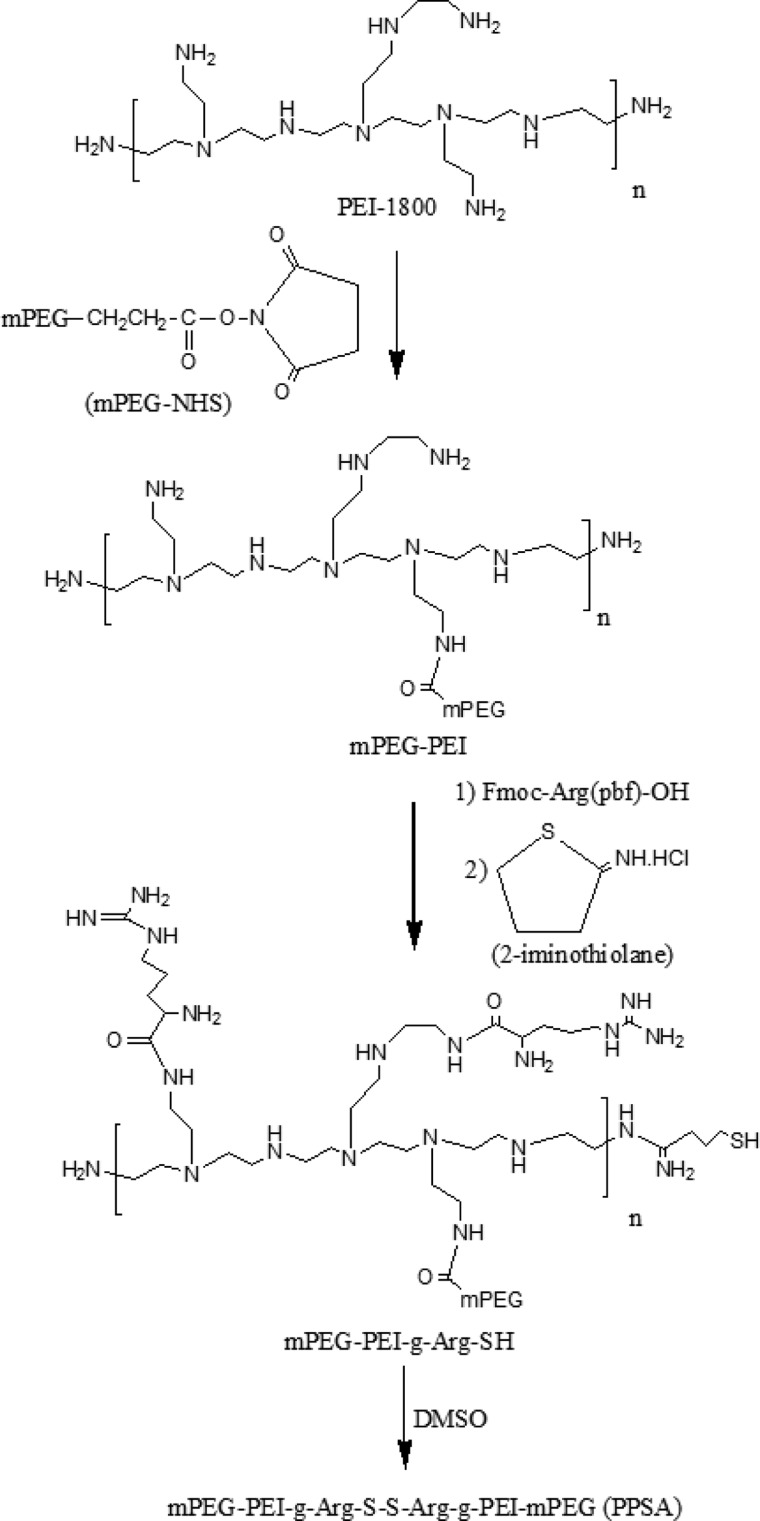
High molecular weight branched polyethylenimine (25K PEI) was used as the benchmark for nonviral gene delivery due to its high in vitro and in vivo transduction efficacy.42 However, this polymer has significant cytotoxicity and nonbiodegradability, which limits its clinical application. To address this problem, we designed and synthesized a novel low cytotoxicity, bioreducible cationic polymer using low molecular weight (1.8 kDa) PEI. PEI complexed with PEG reduced cytotoxicity compared with PEI alone.43 Cross-linking PEI with bioreducible linkages also showed decreased cytoxicity.44 Furthermore, cell-penetrating peptides containing arginine residues transfer nucleic acids efficiently through intracellular translocation.26,45 Based on these previous findings, we have generated an improved biopolymer. First, we reacted PEI 1.8 kDa with succinimidyl ester methoxy polyethylene glycol (mPEG-NHS) to form mPEG-PEI.33 Arginine was grafted onto the polymer using Fmoc-Arg(Pbf)-OH in the presence of HTBU/DIPEA28 to form mPEG-PEI-g-Arg. Subsequently, mPEG-PEI-g-Arg was treated with imidothiolane to add terminal thiol groups, creating mPEG-PEI-g-Arg-SH. Finally, the terminal thiols were cross-linked by DMSO, resulting in a novel bioreducible polymer (mPEG-PEI-g-Arg-S-S-Arg-PEI-mPEG; PPSA). The main synthetic route is shown in Scheme 1.
Scheme 1. Synthetic Scheme of PPSA.
The synthesis of PPSA was confirmed by 1H NMR (Figure S1). The occurrence of spectra peaks at 3.64 and 3.36 ppm indicated the presence of methylene protons corresponding to −CH2CH2O– and −OCH3 PEG end groups. Three peaks, observed at 2.2–3.0 ppm, were assigned to the −CH2 NH– methane protons of PEI (Supporting Information Figure S1 A). These results are consistent with previous reports.33 Following arginine group addition, characteristic arginine peaks appeared at 1.44, 1.70, 3.2, and 3.86 ppm and were assigned to the methylene and methyne protons of (−HCCH2CH2CH2NH−), (−HCCH2CH2CH2NH−), (−HCCH2CH2CH2NH−), and (−HCCH2CH2CH2NH−), respectively (Supporting Information Figure S1 B). The amount of arginine grafting was calculated by integrating the area under the 2.3–3.0 ppm PEI methylene peaks (−CH2CH2N– of PEI) and the 1.7 ppm arginine methylene peaks (−HCCH2CH2CH2NH– of arginine). These calculations indicated that approximately seven arginines were grafted per mPEG-PEI. In addition, new characteristic peaks at 1.8–2.2 ppm were observed. These peaks correspond to cross-linker imithiolane methylene protons (−NH–CH(NH2)–CH2–CH2–CH2–S–S−) (Supporting Information Figure S1 C), confirming the synthesis of the (mPEG-PEI-g-Arg-S-S-Arg-g-PEI-mPEG; PPSA). Further, the molecular weight was analyzed by MALDI-TOF-Mass. The data showed that the final polymer molecular weight is approximately 10.6 kDa (Supporting Information Figure S2).
3.2. Cytotoxicity Assay of PPSA Polymer
To assess the potential cytotoxicity of PPSA, MTT assays were performed on A549 and MCF7 cells treated with PPSA, 25K PEI, or ABP. Cells were treated with varying concentrations of polymer, from 0.5 to 10 μg/mL, and incubated for 24 h (Supporting Information Figure S3) and 72 h. 25K PEI decreased cell viability across all concentration ranges tested (Figure 1). No toxic effects were seen with ABP or PPSA, up to 10 μg/mL. When treated with 10 μg/mL polymer, A549 cell viability was approximately 46%, 92%, and 97% with 25K PEI, ABP, and PPSA, respectively. Similarly, at the same dosage MCF7, cell viability was approximately 36%, 94%, and 97% with 25K PEI, ABP, and PPSA, respectively (p < 0.001 versus 25K PEI). These results are consistent with previous reports demonstrating that ABP has no apparent toxicity in mammalian cells.32 More importantly, PPSA also showed no cytotoxicity, likely due to the low PEI molecular weight (1.8 kDa) and PEG conjugation.46
Figure 1.
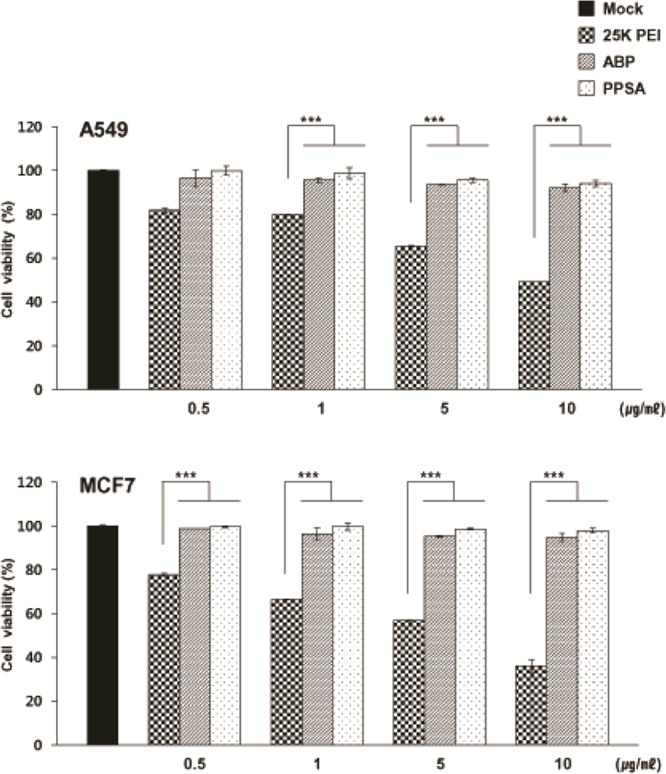
Effect of polymers on A549 and MCF7 cell viability. Cells were treated with PBS, 25K PEI, ABP, or PPSA, followed by an MTT cell viability assay 72 h post treatment. Results were normalized against the control (PBS). Each value represents mean ± SD of three separate experiments (n = 3 per experiment). ***P < 0.001 versus 25K PEI.
3.3. Characterization of Ad/PPSA Nanocomplex
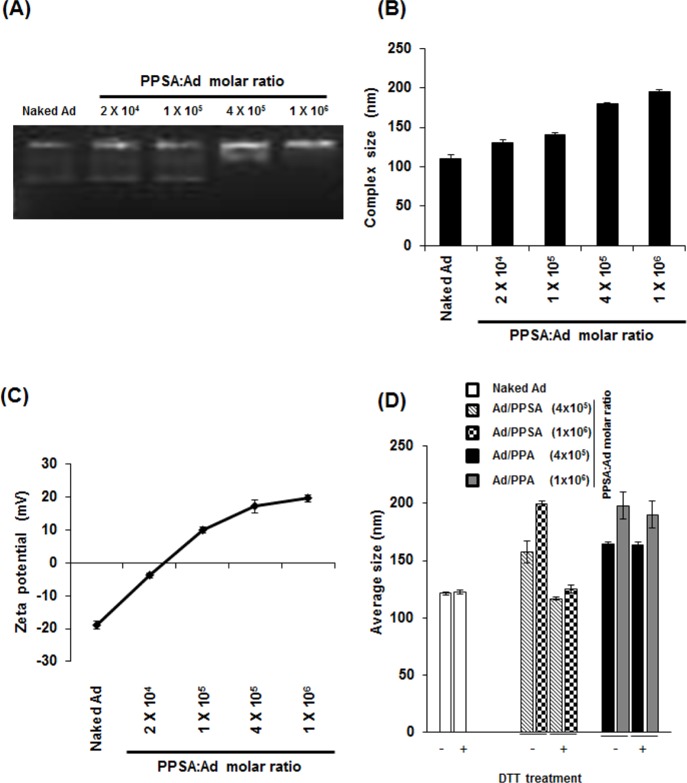
To evaluate the capacity of PPSA to complex with Ad, comparative agarose gel retardation electrophoresis assays were performed at various molar ratios ranging from 0 to 1 × 10⁶ polymers per Ad particle. The Ad migration was progressively retarded with increasing PPSA:Ad molar ratios. Ad migration was completely retarded at the 1 × 10⁶ ratio, indicating that the Ad surface was saturated with PPSA polymer (Figure 2A).
Figure 2.
Characterization of Ad/PPSA nanocomplex. (A) Optimal Ad/PPSA complex formation conditions were determined by gel retardation assay. (B) Average size distribution of naked Ad or Ad/PPSA at various molar ratios. (C) Zeta-potential value of naked Ad or Ad/PPSA at various molar ratios. The sizes and charges are the average of five independent experiments. (D) Average size distribution of Ad/PPSA and Ad/PPA complexes by DLS before and after treatment with DTT (5 mM) at 37 °C for 2 h.
It is important for gene-delivery vectors to be an appropriate size (<200 nm) for efficient cellular uptake through a nonspecific clathrin-dependent process.47,48 Additionally, the complex also requires an overall positive charge to enhance adhesion to negatively charged cellular membranes. To assess the biophysical properties of the Ad/PPSA nanoparticle, the hydrated size and surface charge were determined by DLS and zeta potential analyzer, respectively. We observed that the average naked Ad particle size in solution was 110.8 nm in diameter and increased proportionally with increasing PPSA:Ad molar ratio to 200 nm (1 × 10⁶ ratio) (Figure 2B).
In agreement with the DLS data, the surface charge also increased proportionately with increasing PPSA:Ad molar ratios, from −19.7 ± 1.2 mV (naked Ad) to 19.6 ± 0.9 mV (1 × 10⁶ molar ratio) (Figure 2C). This suggests that PPSA successfully coated the surface of Ad through electrostatic interactions and has shielded the negative charges, resulting in a net positive charge at ratios above 1 × 10⁵. Furthermore, we measured the colloidal stability of Ad/PPSA nanocomplex in PBS buffer at room temperature up to 72 h. As shown in Supporting Information Figure S4, the average size and surface charge of Ad/PPSA nanocomplex was not significantly changed over 72 h, implying that that PPSA cationic polymer-coated Ad shows good colloidal stability. We also examined the reducibility of the PPSA and nonreducible mPEG-PEI-g-Arg (PPA) by treatment with reducing agent dithiothreitol (DTT). The particle size of naked Ad, Ad/PPSA, and Ad/PPA complex after treatment with and without DTT was measured by DLS analyzer. As shown in Figure 2D, the size of naked Ad or Ad/PPA complex was not changed by treatment with DTT. However, the mean average size of PPSA-coated Ad complex was significantly reduced following DTT treatment, approaching the size of naked Ad. These results clearly confirm that PPSA can be biodegraded under reducible microenvironment. Taken together, these data suggest that Ad/PPSA successfully complexed, producing a particle diameter less than 200 nm, and generated a positively charged surface, suggesting that Ad/PPSA could be efficiently transduced into cells.
3.4. Enhanced Transduction Efficiency of Ad/PPSA
Ad-mediated gene transfer is dependent on the CAR expression level on the target cell membrane. However, malignant cancers often downregulate CAR expression, resulting in poor Ad tumor infectivity.49,50 Therefore, it is vital to develop a CAR pathway-independent delivery method to ensure efficient gene therapy transfer. To evaluate Ad/PPSA’s ability to bypass CAR-mediated transduction, CAR-positive A549 cells and CAR-negative MCF7 cells were transduced with Ad/PPSA, with 25K PEI- and ABP-complexed Ad as controls. In our previous study, ABP-complexed Ad entered cells using a CAR-independent cell entry pathway and facilitated gene transfer to Ad infection-resistant and low CAR expressing cells.32
The transduction efficiency of Ad/PPSA was markedly increased compared to naked Ad in both A549 and MCF7 cells (Figure 3). This suggests that Ad/PPSA can efficiently transduce cancer cells independent of CAR expression. Importantly, the beneficial effect of PPSA complexation was particularly pronounced in CAR-negative MCF7 cells where the transduction efficiency increased 107-fold (4 × 10⁵ PPSA:Ad molar ratio) and 110-fold (1 × 10⁶ PPSA:Ad molar ratio) compared to naked Ad (P < 0.001). More importantly, at the 4 × 10⁵ polymer:Ad molar ratio, GFP expression was 2-fold higher in A549 cells and 2-fold higher in MCF7 cells treated with Ad/PPSA when compared to Ad/ABP (P < 0.001), demonstrating the superiority of PPSA-enhanced Ad in regards to transduction efficiency. Notably, GFP expression in Ad/25K PEI-treated cells was lower than those treated with naked Ad. This may be due to the significant cytotoxicity of 25K PEI.
Figure 3.
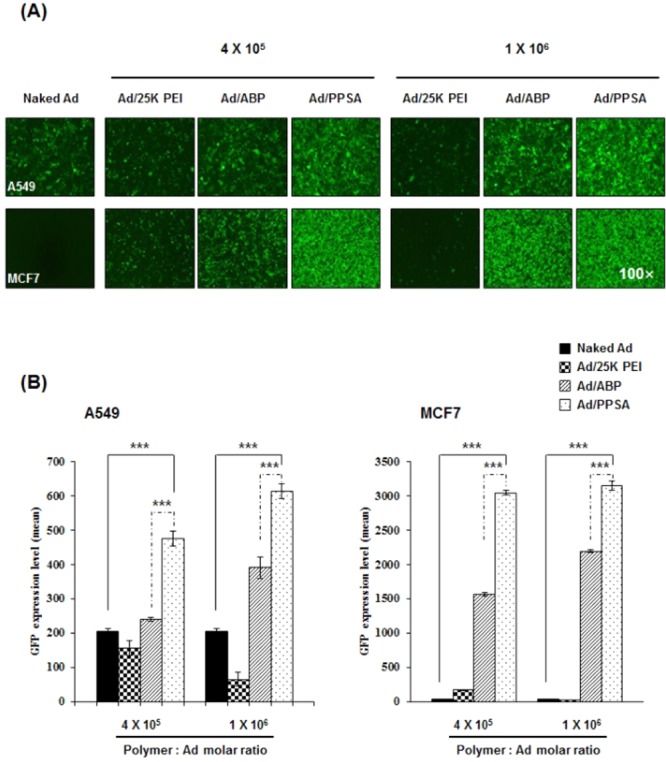
Transduction efficiency of naked Ad, Ad/25K PEI, Ad/ABP, or Ad/PPSA in A549 and MCF7 cancer cells. Cells were transduced at an MOI of 30 and 500 for A549 and MCF7, respectively. (A) Representative fluorescence microscopy images of transduced cells. (B) Transduction efficiency measured by flow cytometry. The polymer:Ad molars ratio used are 4 × 10⁵ and 1 × 10⁶. Results represent the mean ± SD of triplicate experiments. ***P < 0.001 versus naked Ad, Ad/25K PEI, or Ad/ABP.
To further confirm CAR-independent cell entry of Ad/PPSA, we performed a competition assay using Ad5 knob protein, which binds to CAR (Figure 4). Pretreatment of A549 cells with knob protein significantly reduced the GFP expression of naked Ad-treated cells in a dose-dependent manner, decreasing 56.1% and 81.1% with 2 and 10 mg/mL knob protein, respectively. In contrast, Ad/ABP and Ad/PPSA-mediated GFP expression was reduced by the effects of Ad5 knob protein pretreatment, showing a 27.2% (2 mg/mL) and 53.8% (10 mg/mL) decrease for Ad/ABP and a 12.2% (2 mg/mL) and 23.3% (10 mg/mL) decrease for Ad/PPSA. These data suggest that both Ad/ABP and Ad/PPSA cellular entry is mediated primarily by CAR-independent cellular uptake and may have therapeutic value for treating malignant cancer cells in a clinical setting. Previously, we have demonstrated that the cellular uptake mechanism of Ad/polymer complex is different from that of naked Ad which is clathrin-mediated endocytosis, and seems to enter the cells via clathrin-, caveolae-, and macropinocytosis-mediated endocytosis in part.51
Figure 4.
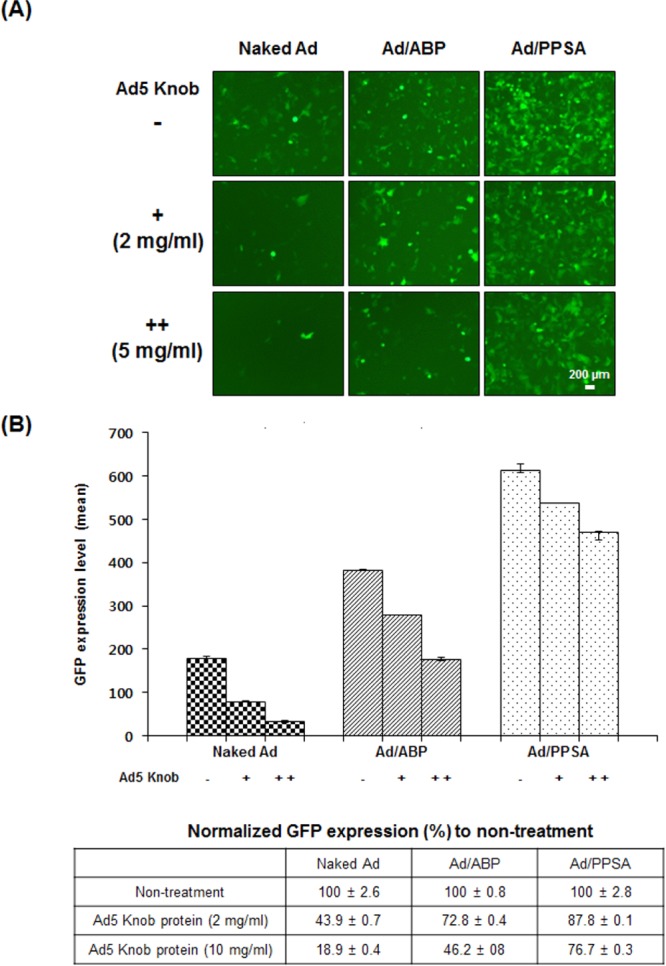
Competition assay of naked Ad, Ad/ABP, and Ad/PPSA with purified Ad 5 fiber knob protein. A549 cells were preincubated with Ad5 knob protein at 2 or 5 mg/mL, followed by treatment with naked Ad, Ad/ABP, or Ad/PPSA at 30 MOI. (A) GFP fluorescence microscopy images. (B) GFP expression levels measured by flow cytometry. The data represent three independent experiments performed in triplicate. Bars describe mean ± SD.
We also examined the cellular uptake efficiency of Ad/PPSA complex in comparison to naked Ad or mPEG-PEI-S-S-PEI-mPEG (PPS)-coated Ad by fluorescence labeling with FITC (Supporting Information Figure S5). The cellular uptake was markedly enhanced when Ad was complexed with either PPS or PPSA compared to naked Ad (P < 0.001). More importantly, cellular uptake was significantly enhanced when cells were treated with Ad/PPSA in comparison to that with Ad/PPS (P < 0.05), suggesting that arginine graft increase cellular uptake.
3.5. Cancer Cell Killing Effect
To further evaluate PPSA’s potential therapeutic value, oncolytic Ad (DWP418) was complexed with PPSA. DWP418 replication is controlled by a modified TERT promoter and contains relaxin as a therapeutic gene. We demonstrated previously that DWP418 oncolytic Ad only replicates in cells with high telomerase activity, a common feature of cancer cells. Additionally, relaxin expression increases viral spread throughout tumor tissue by reducing the extracellular matrix components.36 Naked DWP418 induced cell lysis in CAR-positive A549, but not in CAR-negative MCF7, suggesting that naked oncolytic Ad depends on CAR expression for cell entry (Figure 5). In marked contrast, cell killing efficacy was significantly increased in MCF7 cells when DWP418 was coated with ABP or PPSA at a 1 × 10⁶ Polymer:Ad molar ratio, showing 34% and 80% enhancement of cell death, respectively (P < 0.001). Likewise, an increase in CAR-positive A549 cell killing efficacy was observed with DWP418/ABP (18% increase) and DWP418/PPSA (40% increase) relative to naked DWP418 (P < 0.001). These results are consistent with enhanced gene transfer efficiency in DWP418/PPSA relative to naked DWP418 (Figure 3), demonstrating that oncolytic Ad’s therapeutic value would be significantly improved by coating the surface with PPSA.
Figure 5.
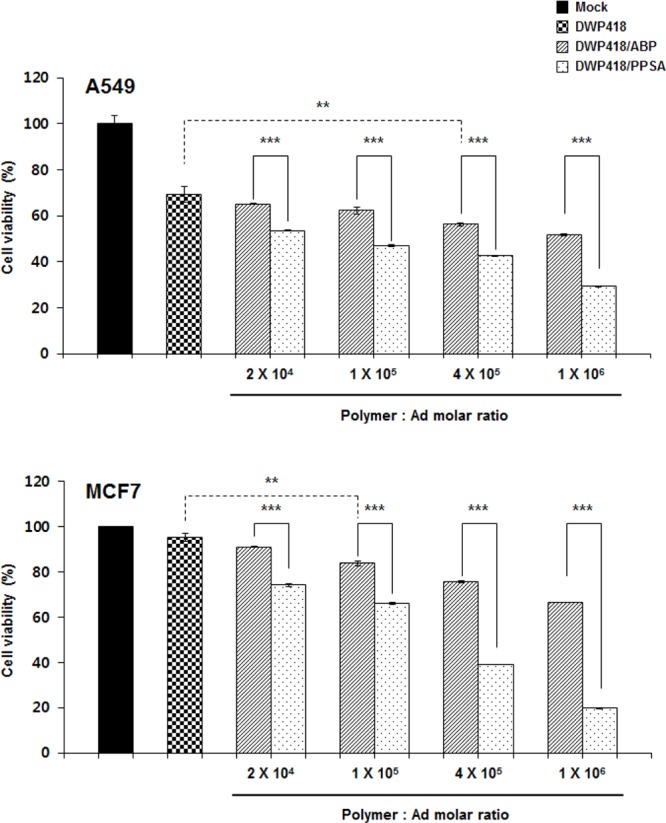
Cancer cell killing effect of DWP418, DWP418/ABP, or DWP418/PPSA. Cells were infected with DWP418, DWP418/ABP, or DWP418/PPSA at an MOI of 1 and 100 for A549 and MCF7, respectively. At 48 h after infection, the cells were harvested and cell viability was measured by MTT assay. Data describe mean ± SD **P < 0.01 between naked DWP418 and DWP418/ABP, ***P < 0.001 between DWP418/ABP and DWP418/PPSA.
3.6. Potent Antitumor Efficacy of Ad/PPSA
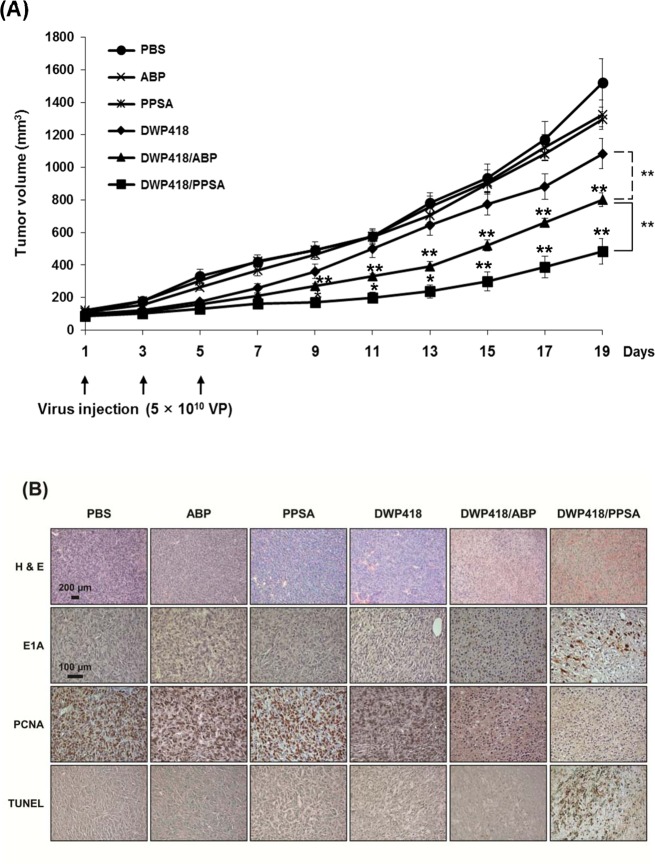
In order to validate the therapeutic antitumor efficacy of DWP418/PPSA, MCF7 tumors xenografted into nude mice were injected intratumorally every other day for 5 days (3 injections total) with PBS, ABP, PPSA, DWP418, DWP418/ABP, or DWP418/PPSA. Intratumoral injection with either DWP418/ABP or DWP418/PPSA significantly reduced tumor growth when compared with naked DWP418. This result indicates the enhanced oncolytic antitumor activity of cationic polymer-coated DWP418 (P < 0.01). (Figure 6). The volumes of the MCF7 xenograft tumors treated with PBS, ABP, PPSA, DWP418, DWP418/ABP, or DWP418/PPSA were 1520 ± 30, 1325 ± 47, 1297 ± 91, 1084 ± 42, 802 ± 42, and 483 ± 79 mm3, respectively, at 19 days post treatment (Figure 6A). The tumor volumes of mice treated with DWP418, DWP418/ABP, or DWP418/PPSA were reduced to 28.7%, 47.2%, and 68.2%, respectively, when compared with the PBS control. DWP418/ABP and DWP418/PPSA treatment resulted in tumors that were 1.35-fold and 2.24-fold smaller, respectively, when compared with naked DWP418 19 days post treatment (P < 0.01). These results demonstrate the superiority of DWP418/PPSA in terms of antitumor efficacy, improving the therapeutic value over DWP418/ABP (P < 0.01).
Figure 6.
(A) Antitumor efficacy of DWP418, DWP418/ABP, or DWP418/PPSA. MCF7 tumors were xenografted into nude mice. When the tumor size reached ∼80–100 mm3, each Ad formulation was injected intratumorally every other day for 5 days (3 injections total). Data describe mean ± SD **P < 0.01, naked DWP418 versus DWP418/ABP and **P < 0.01 & *P < 0.05, DWP418/ABP versus DWP418/PPSA were observed from day 9 to day 19. (B) Representative microscopy photographs of tumor sections from each group stained with H&E (scale bar = 200 μm) or immunostained against E1A, PCNA, or TUNEL (scale bar =100 μm). These images are representatives from four independent experiments.
For histological and immunohistochemical analysis, MCF7 tumors treated with PBS, ABP, PPSA, DWP418, DWP418/ABP, or DWP418/PPSA were harvested 3 days following the final injection. Sections were then stained for Ad E1A-specific antibody, PCNA, and TUNEL as well as standard H&E staining (Figure 6B). DWP418/PPSA-treated tumor tissue showed extensive necrosis and a larger Ad spread compared with DWP418- or DWP418/ABP-treated tumors. Dark staining of Ad E1A in tumor tissue indicated active replication of oncolytic Ad in infected cancer cells following PPSA release. Moreover, PCNA expression in DWP418/PPSA-treated tissue was markedly reduced compared to naked DWP418- or DWP418/ABP-treated tumors. This demonstrated that DWP418/PPSA is more effective at inhibiting tumor cell proliferation. Likewise, in the DWP418/PPSA-treated group, TUNEL-positive apoptotic cells were abundant in the same regions as E1A-positive cells. Taken together, these results demonstrate that PPSA-complexed oncolytic Ad enhanced infection ability and increased the antitumor efficacy over naked oncolytic Ad and ABP-complexed oncolytic Ad through reduced cancer cell proliferation and apoptosis stimulation.
3.7. Innate and Adaptive Immune Response against Ad
Intravenous Ad injection can activate an innate immune response, which limits the therapeutic efficiency of Ad. To evaluate whether DWP418/PPSA can evade the innate immune response, we measured proinflammatory cytokine IL-6 secretion from mice 6 h post-treatment. Naked DWP418 induced a significant increase in IL-6 serum level, 4.87-fold above the baseline level in Balb/C mice (P < 0.01) (Figure 7A). In marked contrast, DWP418/ABP and DWP418/PPSA treatment showed IL-6 serum levels approximately equivalent to PBS-treated mice, indicating that both ABP and PPSA Ad surface coatings can attenuate the innate immune response against Ad.
Figure 7.
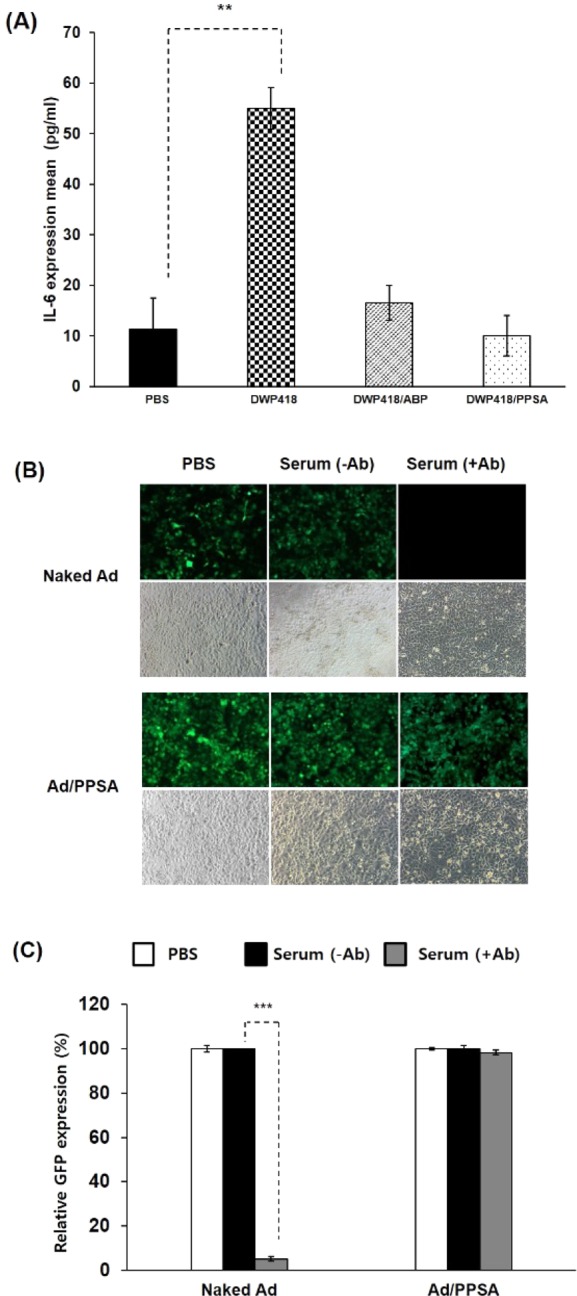
Innate and adaptive immune response against Ad. (A) Assessment of innate immune response against naked DWP418, DWP418/ABP, or DWP418/PPSA. Serum samples from mice systemically administered 2 × 10¹⁰ VP of naked DWP418, DWP418/ABP, or DWP418/PPSA were collected 6 h post treatment. IL-6 levels were determined by ELISA. **P < 0.01 between PBS and naked DWP418 group. (B,C) Adaptive immune responses against naked Ad and Ad/PPSA. Naked Ad (dE1/GFP) or Ad/PPSA complex were incubated with and without Ad-specific neutralizing antibody-containing serum, and then GFP expression level was observed by fluorescence microscopy (B) and an FACScan flow cytometer (C). ***P < 0.001 between with and without the presence of neutralizing Ab for naked Ad.
We also evaluated the potential effect of DWP418/PPSA to escape the adaptive immune response against Ad. As shown in Figure 7B,C, Ad-specific neutralizing antibody (Ab)-containing serum from a mouse treated with naked Ad (dE1/GFP) reduced the transduction efficiency of naked dE1/GFP by 94.8%. In marked contrast, no decrease of transduction efficiency was observed for Ad/PPSA complex. These results clearly demonstrate that PPSA complexation can evade pre-existing neutralizing antibodies, and further imply that Ad/PPSA nanocomplex can be utilized for systemic multidose treatment.
3.8. In Vivo Hepatotoxicity of Intravenously Injected Ad/PPSA
To evaluate Ad treatment-associated hepatotoxicity, serum ALT and AST levels were assessed following intravenous injection of naked DWP418, DWP418/ABP, or DWP418/PPSA (Figure 8). Naked DWP418-treated mice had significantly higher serum transaminase levels 3 days post injection when compared to PBS controls (P < 0.05). In contrast, no significant ALT and AST level increases were observed in DWP418/PPSA-treated mice. DWP418/ABP-treated mice showed a small decrease in ALT and AST levels compared to DWP418 alone; however, these values were still significantly higher than PBS controls. These data indicate that Ad PEGylation reduced Ad-associated liver toxicity. We speculate that the lower liver toxicity values observed with DWP418/PPSA-treatment compared with DWP418/ABP-treatment results from the PEGylated PEI on PPSA.32
Figure 8.

Hepatotoxicity assessment of DWP418, DWP418/ABP, and DWP418/PPSA. ALT and AST levels were determined from plasma samples collected 3 days following systemic injection of PBS, DWP418, DWP418/ABP, or DWP418/PPSA.
4. Conclusion
Ads have demonstrated potential as an effective cancer therapy strategy; however, they have several disadvantages. The addition of biocompatible, bioreducible polymers derived from nonviral vectors to the Ad surface has conferred numerous pharmacokinetic advantages to overcoming these shortcomings in vivo. PPSA complexation enabled Ad to evade both innate and adaptive immune responses against Ad, implying that Ad/PPSA nanocomplex can be utilized for systemic multidose treatment. Moreover, PPSA-coated Ad complex showed increased transduction efficiency in both CAR-high and CAR-negative cancer cells, emphasizing the potential utility of Ad-mediated gene therapy in clinical setting. Ad/PPSA complexation is an easy and simple process because electrostatic interactions stabilize the complex. These principles combine to form an effective clinical treatment option and a potential tool for cancer gene therapy. In sum, our data provide a solid experimental foundation for developing advanced oncolytic Ad systems based on polymer-modified viruses.
Acknowledgments
This work was supported by grants from the Ministry of Trade, Industry & Energy (10030051, Dr. C.-O. Yun), the National Research Foundation of Korea (2010-0029220, 2013K1A1A2A02050188, 2013M3A9D3045879, Dr. C.-O. Yun), the Korea Food and Drug Administration (KFDA-13172-306, Dr. C.-O. Yun), Basic Research Programs by National Research Foundation of Korea (2013R1A1A2012483, Dr. D. Kasala) and the National Institutes of Health, USA (CA 107070, Dr. S.-W. Kim).
Supporting Information Available
1H NMR spectra of polymers, MALDI-TOF spectrum of PPSA polymer, cytotoxicity of polymer, colloidal stability of PPSA coated Ad and cellular uptake of Ad/PPSA and Ad/PPS. These results are available free of charge via the Internet at http://pubs.acs.org.
Author Contributions
§ These authors contributed equally to this study.
The authors declare no competing financial interest.
Funding Statement
National Institutes of Health, United States
Supplementary Material
References
- El-Aneed A. J. Controlled Release 2004, 94, 1–14. [DOI] [PubMed] [Google Scholar]
- Meng F.; Hennink W. E.; Zhong Z. Biomaterials 2009, 30, 2180–2198. [DOI] [PubMed] [Google Scholar]
- Samal S. K.; Dash M.; Van Vlierberghe S.; Kaplan D. L.; Chiellini E.; van Blitterswijk C.; Moroni L.; Dubruel P. Chem. Soc. Rev. 2012, 41, 7147–7194. [DOI] [PubMed] [Google Scholar]
- Park T. G.; Jeong J. H.; Kim S. W. Adv. Drug Delivery Rev. 2006, 58, 467–486. [DOI] [PubMed] [Google Scholar]
- Coughlan L.; Alba R.; Parker A. L.; Bradshaw A. C.; McNeish I. A.; Nicklin S. A.; Baker A. H. Viruses 2010, 2, 2290–2355. [DOI] [PMC free article] [PubMed] [Google Scholar]
- Singh R.; Kostarelos K. Trend. Biotechnol. 2009, 27, 220–229. [DOI] [PubMed] [Google Scholar]
- Kasala D.; Choi J. W.; Kim S. W.; Yun C. O. Expert Opin. Drug Delivery 2014, 11, 379–392. [DOI] [PubMed] [Google Scholar]
- Roelvink P. W.; Lizonova A.; Lee J. G.; Li Y.; Bergelson J. M.; Finberg R. W.; Brough D. E.; Kovesdi I.; Wickham T. J. J. Virol. 1998, 72, 7909–7915. [DOI] [PMC free article] [PubMed] [Google Scholar]
- Park J.; Kim W. J. J. Drug Target. 2012, 20, 648–6466. [DOI] [PubMed] [Google Scholar]
- Neu M.; Fischer D.; Kissel T. J. Gene Med. 2005, 7, 992–1009. [DOI] [PubMed] [Google Scholar]
- Shen J.; Zhao D. J.; Li W.; Hu Q. L.; Wang Q. W.; Xu F. J.; Tang G. P. Biomaterials 2013, 34, 4520–4531. [DOI] [PubMed] [Google Scholar]
- Coue G.; Engbersen J. F. J. Controlled Release 2010, 148, e9–11. [DOI] [PubMed] [Google Scholar]
- Esfand R.; Tomalia D. A. Drug Discovery Today 2001, 6, 427–436. [DOI] [PubMed] [Google Scholar]
- Arote R. B.; Jiang H. L.; Kim Y. K.; Cho M. H.; Choi Y. J.; Cho C. S. Expert Opin. Drug Delivery 2011, 8, 1237–1246. [DOI] [PubMed] [Google Scholar]
- Green J. J.; Langer R.; Anderson D. G. Acc. Chem. Res. 2008, 41, 749–759. [DOI] [PMC free article] [PubMed] [Google Scholar]
- Lin C.; Blaauboer C. J.; Timoneda M. M.; Lok M. C.; van Steenbergen M.; Hennink W. E.; Zhong Z.; Feijen J.; Engbersen J. F. J. Controlled Release 2008, 126, 166–174. [DOI] [PubMed] [Google Scholar]
- Green J. J.; Zugates G. T.; Langer R.; Anderson D. G. Method. Mol. Biol. 2009, 480, 53–63. [DOI] [PMC free article] [PubMed] [Google Scholar]
- Fasbender A.; Zabner J.; Chillon M.; Moninger T. O.; Puga A. P.; Davidson B. L.; Welsh M. J. J. Biol. Chem. 1997, 272, 6479–6489. [DOI] [PubMed] [Google Scholar]
- Mok H.; Bae K. H.; Ahn C. H.; Park T. G. Langmuir 2009, 25, 1645–1650. [DOI] [PubMed] [Google Scholar]
- Mok H.; Park J. W.; Park T. G. Bioconjugate Chem. 2008, 19, 797–801. [DOI] [PubMed] [Google Scholar]
- Bolhassani A. Biochim. Biophys. Acta 2011, 1816, 232–246. [DOI] [PubMed] [Google Scholar]
- Torchilin V. P. Adv. Drug Delivery Rev. 2008, 60, 548–558. [DOI] [PubMed] [Google Scholar]
- Levchenko T. S.; Rammohan R.; Volodina N.; Torchilin V. P. Method. Enzymol. 2003, 372, 339–49. [DOI] [PubMed] [Google Scholar]
- Nam H. Y.; Kim J.; Kim S.; Yockman J. W.; Kim S. W.; Bull D. A. Biomaterials 2011, 32, 5213–5222. [DOI] [PMC free article] [PubMed] [Google Scholar]
- Koren E.; Torchilin V. P. Trend. Mol. Med. 2012, 18, 385–393. [DOI] [PubMed] [Google Scholar]
- Zorko M.; Langel U. Adv. Drug Delivery Rev. 2005, 57, 529–545. [DOI] [PubMed] [Google Scholar]
- Morris V. B.; Sharma C. P. J. Colloid Interface Sci. 2010, 348, 360–368. [DOI] [PubMed] [Google Scholar]
- Kim T. I.; Ou M.; Lee M.; Kim S. W. Biomaterials 2009, 30, 658–664. [DOI] [PMC free article] [PubMed] [Google Scholar]
- Nam H. Y.; Hahn H. J.; Nam K.; Choi W. H.; Jeong Y.; Kim D. E.; Park J. S. Int. J. Pharm. 2008, 363, 199–205. [DOI] [PubMed] [Google Scholar]
- Kim W. J.; Christensen L. V.; Jo S.; Yockman J. W.; Jeong J. H.; Kim Y. H.; Kim S. W. Mol. Ther. 2006, 14, 343–350. [DOI] [PubMed] [Google Scholar]
- Won Y. W.; Yoon S. M.; Lee K. M.; Kim Y. H. Mol. Ther. 2011, 19, 372–380. [DOI] [PMC free article] [PubMed] [Google Scholar]
- Kim P. H.; Kim T. I.; Yockman J. W.; Kim S. W.; Yun C. O. Biomaterials 2010, 31, 1865–1874. [DOI] [PubMed] [Google Scholar]
- Zhan C.; Qian J.; Feng L.; Zhong G.; Zhu J.; Lu W. J. Drug Target. 2011, 19, 573–581. [DOI] [PubMed] [Google Scholar]
- Eyer P.; Worek F.; Kiderlen D.; Sinko G.; Stuglin A.; Simeon-Rudolf V.; Reiner E. Anal. Biochem. 2003, 312, 224–227. [DOI] [PubMed] [Google Scholar]
- Kim E.; Kim J. H.; Shin H. Y.; Lee H.; Yang J. M.; Kim J.; Sohn J. H.; Kim H.; Yun C. O. Hum. Gene Ther. 2003, 14, 1415–1428. [DOI] [PubMed] [Google Scholar]
- Kim J. H.; Lee Y. S.; Kim H.; Huang J. H.; Yoon A. R.; Yun C. O. J. Natl. Cancer Inst. 2006, 98, 1482–1493. [DOI] [PubMed] [Google Scholar]
- Choi J. W.; Kang E.; Kwon O. J.; Yun T. J.; Park H. K.; Kim P. H.; Kim S. W.; Kim J. H.; Yun C. O. Gene Ther. 2013, 20, 880–892. [DOI] [PubMed] [Google Scholar]
- Kim P. H.; Kim J.; Kim T. I.; Nam H. Y.; Yockman J. W.; Kim M.; Kim S. W.; Yun C. O. Biomaterials 2011, 32, 9328–9342. [DOI] [PubMed] [Google Scholar]
- Kim P. H.; Sohn J. H.; Choi J. W.; Jung Y.; Kim S. W.; Haam S.; Yun C. O. Biomaterials 2011, 32, 2314–2326. [DOI] [PubMed] [Google Scholar]
- Kim J.; Nam H. Y.; Kim T. I.; Kim P. H.; Ryu J.; Yun C. O.; Kim S. W. Biomaterials 2011, 32, 5158–5166. [DOI] [PMC free article] [PubMed] [Google Scholar]
- Yun C. O.; Cho E. A.; Song J. J.; Kang D. B.; Kim E.; Sohn J. H.; Kim J. H. Hum. Gene Ther. 2003, 14, 1643–1652. [DOI] [PubMed] [Google Scholar]
- Schaffert D.; Wagner E. G. Gene Ther. 2008, 15, 1131–1138. [DOI] [PubMed] [Google Scholar]
- Kim W. J.; Yockman J. W.; Lee M.; Jeong J. H.; Kim Y. H.; Kim S. W. J. Controlled Release 2005, 106, 224–234. [DOI] [PubMed] [Google Scholar]
- Han J.; Zhao D.; Zhong Z.; Zhang Z.; Gong T.; Sun X. Nanotechnology 2010, 21, 105106. [DOI] [PubMed] [Google Scholar]
- Futaki S.; Suzuki T.; Ohashi W.; Yagami T.; Tanaka S.; Ueda K.; Sugiura Y. J. Biol. Chem. 2001, 276, 5836–5840. [DOI] [PubMed] [Google Scholar]
- Huang F. W.; Wang H. Y.; Li C.; Wang H. F.; Sun Y. X.; Feng J.; Zhang X. Z.; Zhuo R. X. Acta Biomater. 2010, 6, 4285–4295. [DOI] [PubMed] [Google Scholar]
- Wiethoff C. M.; Wodrich H.; Gerace L.; Nemerow G. R. J. Virol. 2005, 79, 992–2000. [DOI] [PMC free article] [PubMed] [Google Scholar]
- Meier O.; Greber U. F. J. Gene Med. 2003, 5, 451–462. [DOI] [PubMed] [Google Scholar]
- Matsumoto K.; Shariat S. F.; Ayala G. E.; Rauen K. A.; Lerner S. P. Urology 2005, 66, 441–446. [DOI] [PubMed] [Google Scholar]
- Sachs M. D.; Rauen K. A.; Ramamurthy M.; Dodson J. L.; De Marzo A. M.; Putzi M. J.; Schoenberg M. P.; Rodriguez R. Urology 2002, 60, 531–536. [DOI] [PubMed] [Google Scholar]
- Lee C. H.; Kasala D.; Na Y.; Lee M. S.; Kim S. W.; Jeong J. H.; Yun C. O. Biomaterials 2014, 35, 5505–5516. [DOI] [PubMed] [Google Scholar]
Associated Data
This section collects any data citations, data availability statements, or supplementary materials included in this article.


