Abstract
We demonstrate a strategy to transfer the zinc(II) sensitivity of a fluoroionophore with low photostability and a broad emission band to a bright and photostable fluorophore with a narrow emission band. The two fluorophores are covalently connected to afford an intramolecular Förster resonance energy transfer (FRET) conjugate. The FRET donor in the conjugate is a zinc(II)-sensitive arylvinylbipyridyl fluoroionophore, the absorption and emission of which undergo bathochromic shifts upon zinc(II) coordination. When the FRET donor is excited, efficient intramolecular energy transfer occurs to result in the emission of the acceptor boron dipyrromethene (4,4-difluoro-4-bora-3a,4a-diaza-s-indacene or BODIPY) as a function of zinc(II) concentration. The broad emission band of the donor/zinc(II) complex is transformed into the strong, narrow emission band of the BODIPY acceptor in the FRET conjugates, which can be captured within the narrow emission window that is preferred for multicolor imaging experiments. In addition to competing with other nonradiative decay processes of the FRET donor, the rapid intramolecular FRET of the excited FRET-conjugate molecule protects the donor fluorophore from photobleaching, thus enhancing the photostability of the indicator. FRET conjugates 3 and 4 contain aliphatic amino groups, which selectively target lysosomes in mammalian cells. This subcellular localization preference was verified by using confocal fluorescence microscopy, which also shows the zinc(II)-enhanced emission of 3 and 4 in lysosomes. It was further shown using two-color structured illumination microscopy (SIM), which is capable of extending the lateral resolution over the Abbe diffraction limit by a factor of two, that the morpholino-functionalized compound 4 localizes in the interior of lysosomes, rather than anchoring on the lysosomal membranes, of live HeLa cells.
Keywords: dyes/pigments, fluorescence, lysosomes, photostability, zinc
Introduction
Motivated by the relevance of zinc(II) biology to human health and driven by the need for tools to follow zinc(II) distribution and dynamics in metabolically active cellular and tissue specimens, many fluorescent indicators for zinc(II) have been developed.[1] Of the large number of the reported molecules that undergo zinc(II)-sensitive fluorescence modulation, a relatively small fraction has been used in biological imaging experiments. Therefore, in addition to having emission characteristics (intensity, quantum yield, lifetime, and so forth) that are functions of zinc(II) concentration under physiologically relevant conditions, there are other benchmarks that need to be met for an indicator molecule to be optimally effective in biological fluorescence imaging experiments.
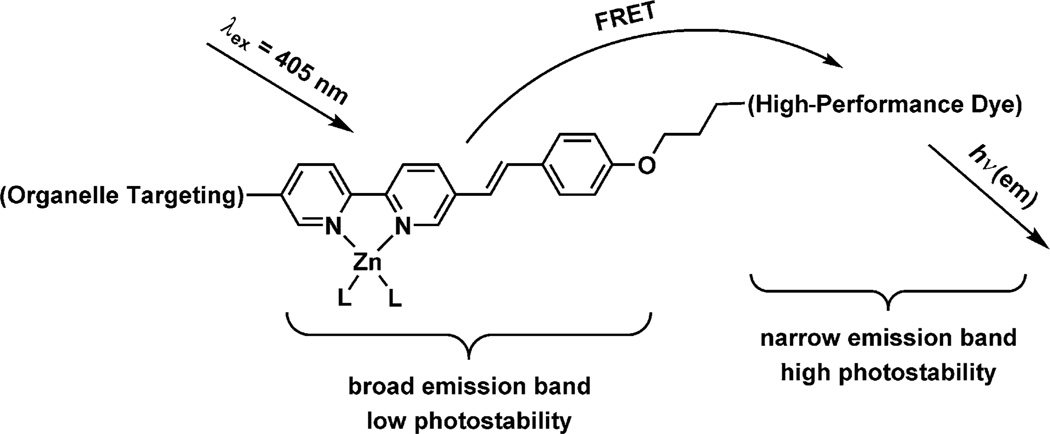
The two relevant issues that this work aims to address are the broadness of the emission band and the low photostability of certain zinc(II)-sensitive fluorophores. A broad emission band diminishes the usefulness of a dye in multicolor imaging. Low photostability reduces the applicability of the indicator in time-course experiments. These two issues could be addressed by the molecular construct depicted in Figure 1.
Figure 1.
The design of a zinc(II)-sensitive, organelle-specific, intramolecular FRET-conjugate; L: coordinating solvent or counterion. Attributes of a “high-performance dye” include a large molar absorptivity and fluorescence quantum yield in physiological buffer solutions, high photostability, a narrow emission band, and compatibility with conventional excitation/emission filter sets.
The molecular construct in Figure 1 contains two fluorophores, between which zinc(II)-dependent intramolecular Förster resonance energy transfer (FRET) occurs. The arylvinylbipyridyl FRET donor typifies a zinc(II)-sensitive fluoroionophore with a broad emission band and low photostability. A “high-performance” dye by the criteria of biological fluorescence imaging experiments shall be selected as the FRET acceptor, which absorbs the excitation energy of the donor to 1) transform a broad donor emission into a narrow, strong emission of the acceptor, and 2) protect the donor from photo- bleaching by sending the donor rapidly back to the ground state.
We qualify an acceptor dye as “high performance” (Figure 1) if it possesses several of the following attributes: a large molar absorptivity in the visible region and a high fluorescence quantum yield in physiological buffer solutions; high photostability; a small emission bandwidth; and compatibility with commercial excitation/emission bandpass filter sets. Organic dyes such as boron dipyrromethene (4,4-difluoro-4-bora-3a,4a-diaza-s-indacene or BODIPY), fluorescein, rhodamine, and carbocyanine fall into this category.[2] All of these dyes have molar absorptivity values at excitation wavelengths over 50 000 m−1 cm−1, and fluorescence quantum yields in the range of 0.8–1.0 (except the carbocyanines).[2a] They are photostable enough to be frequently employed in fluorescence microscopic video time-course experiments, and they have appropriately narrow emission bandwidths to be applied in multicolor imaging experiments. In the current work, BODIPY[3] is chosen as the FRET acceptor shown in Figure 1. A lysosome-targeting aliphatic amino group was placed at the arylvinylbipyridyl side of the molecule, which leads to the selective accumulation of the indicator molecules in lysosomes.
On the basis of the Förster theory of energy transfer, several options exist to render the acceptor emission of an intramolecular FRET conjugate as a function of an analyte (zinc(II) in this study) concentration. As shown in Equation (1), the rate of FRET (kFRET) is proportional to the spectral-overlap integral (J(λ)) and inversely proportional to the sixth order of the distance that separates the donor and the acceptor (r).[4] Both parameters (r and J(λ)) might be devised as a function of an analyte concentration,[1p] thereby providing a strategy for developing fluorescent indicators. Altering the FRET rate (kFRET), hence the efficiency, by changing r by means of analyte binding has been successfully applied, notably in the genetically encoded calcium(II) sensor Chameleon,[5] molecular beacons for nucleic acid analysis,[6] and more recently in genetically encoded zinc(II) indicators.[7] Our group reported intramolecular FRET-based indicators in which zinc(II) binding amplifies the spectral overlap integral, thus increasing the FRET efficiency.[8] A growing number of FRET-conjugate indicators that contain a metal-ion-sensitive rhodamine spirolactam moiety operate by means of metal-ion binding-enhanced J(λ), essentially by creating the FRET acceptor by means of the metal-ion-keyed rhodamine spirolactam ring-opening reaction.[9]
| (1) |
in which κ is the orientation factor, J(λ) is the spectral overlap integral; φD is the donor fluorescence quantum yield in the absence of the acceptor, r is the donor–acceptor distance, η is the refractive index of the medium, and τD is the lifetime of the donor in the absence of the acceptor.
In addition to relating the rate of FRET [kFRET in Eq. (1)] to zinc(II) concentration for the purpose of developing a zinc(II)-sensitive indicator, we have shown that the emission intensity of the FRET acceptor [IA in Eq. (2)] of a donor–acceptor conjugate can be related to zinc(II)-dependent donor molar absorptivity at the excitation wavelength (εD(λex)). In our previous report, the FRET dynamics of a representative donor–acceptor conjugate in organic media were characterized by means of femtosecond time-resolved transient absorption spectroscopy.[10] In the current work, we describe the effectiveness of this FRET strategy in transferring the zinc(II) sensitivity of a fluorophore with a broad emission band and low photostability to a bright, photostable fluorophore of a strong and narrow emission band. The FRET strategy is shown to protect donors from undergoing other nonradiative processes, such as trans–cis photoisomerization, and to reduce photobleaching in the context of live-cell imaging. Two FRET-conjugate indicators are targeted to lysosomes of mammalian cells for illuminating the lysosomal zinc(II). The indicators are visualized in the interior of lysosomes by using two-color structured illumination microscopy (SIM),[11] which increases the spatial resolution over the Abbe diffraction limit.[12]
| (2) |
A longstanding objective of our laboratory is to provide imaging tools in zinc(II) biological research.[13] The specific choice of targeting lysosomal zinc(II) in this work is made based on the relevance of lysosomal zinc(II) in cellular responses to redox potential fluctuations. When eukaryotic cells are subjected to oxidative stress (e.g., a sudden influx of hydrogen peroxide), the cysteine residues in zinc(II)-bound metallothioneins, cytoplasmic proteins that carry the buffering function in maintaining intracellular zinc(II) homeostasis,[14] are oxidized to disulfides with the release of zinc(II) ions.[15] The rapid accumulation of the surplus zinc(II) ions by means of a currently unknown mechanism into lysosomes[16] has been found to induce membrane disintegration,[17] which leads to the release of harmful levels of hydrolytic enzymes, such as cathepsin,[18] to result in cell death. This process is called lysosomal membrane permeabilization (LMP).[19] Zinc(II) ions, therefore, appear to be a link between the oxidative stress and LMP, which raises interest in developing fluorescent indicators to correlate lysosomal zinc(II) profiles to the levels of oxidative stress and downstream markers for LMP.[19b]
Results and Discussion
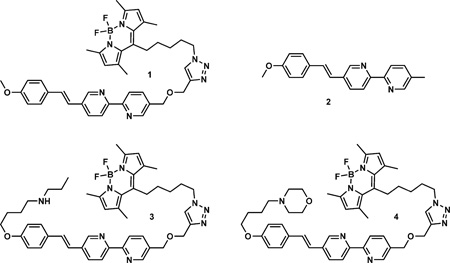
Compounds 1–4 were investigated in this project. The zinc(II)-responding arylvinylbipyridyl FRET donor moiety is linked to the BODIPY acceptor in compound 1. The bipyridyl ligand component of the donor preferentially binds zinc(II) ions over alkali and alkaline earth metal ions,[8b] thus making it suitable for selectively imaging zinc(II) ions in a biological setting. Compound 2 is the donor component of 1, 3, and 4. Compounds 3 and 4 contain a secondary or a tertiary amino group, respectively, as a lysosome-directing moiety.[20]
Synthesis
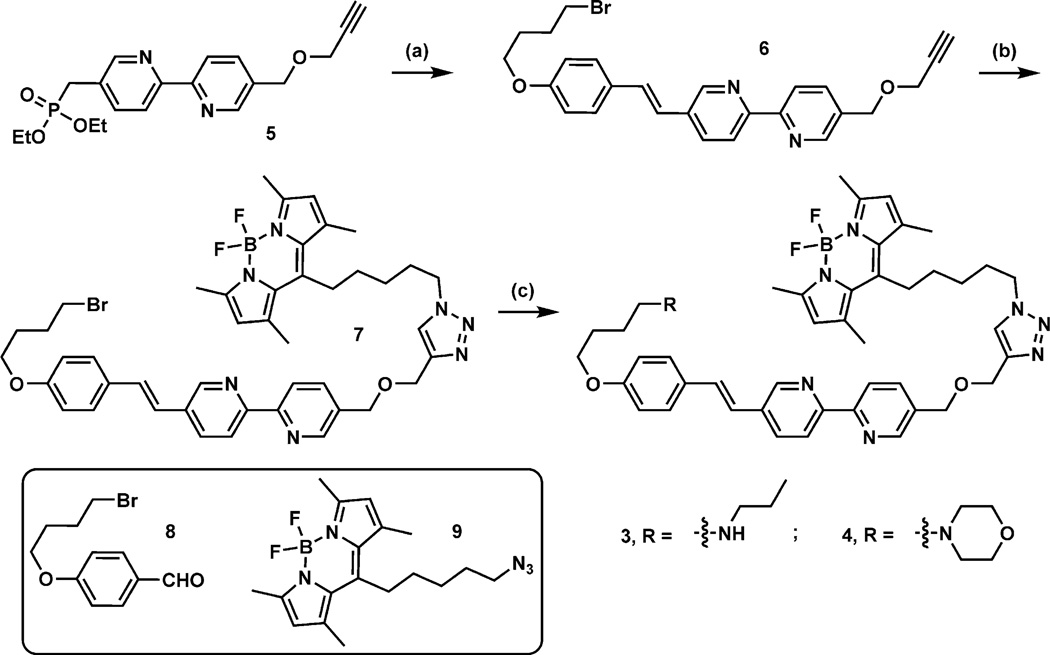
The syntheses of compounds 3 and 4 are outlined in Scheme 1. The detailed procedures are included in the Supporting Information. Briefly, the Horner–Wadsworth–Emmons reaction between 5[10, 20] and aldehyde 8[8c] leads to compound 6 in 67% yield, which reacts with azide 9[10] under the copper(I)-catalyzed conditions[21] to obtain 7 in 78% yield. Upon treatment with n-propylamine or morpholine, compound 7 is converted to compound 3 in 59% or 4 in 62% yield, respectively.
Scheme 1.
Syntheses of compounds 3 and 4. Reagents and conditions: a) Compound 8, potassium bis(trimethylsi-lyl)amide (KHMDS), −78°C to RT, 67%; b) compound 9, Cu(OAc)2·H2O (5 mol%), sodium ascorbate (25 mol%), tris[(1-benzyl-1H-1,2,3-triazol-4-yl)methyl]amine (TBTA, cat.), 12 h, 78%; c) n-propylamine (3, 59%) or morpholine (4, 62%), CH3CN, 60°C, 12 h.
Absorption and emission
Previously, compound 1 and its zinc(II) complex were characterized in organic solvents by using femtosecond time-resolved transient absorption spectroscopy to undergo efficient intramolecular FRET, owing to a short distance (r) and a large spectral-overlap integral (J(λ)) between the arylvinylbipyridyl donor and the BODIPY acceptor.[10] The emission intensity of the BODIPY acceptor is a function of the molar absorptivity of the donor at the excitation wave-length. The molar absorptivity of the zinc(II) complex of 1 at 405 nm, which is a laser line that we use in confocal fluorescence microscopic experiments, is 25 times larger than that of the free ligand. Therefore, the emission intensity of the BODIPY acceptor shall be dependent on [zinc(II)] in the sample [Eq. (2)]. In this subsection, we describe how the FRET strategy creates indicators suitable for fluorescence microscopy by offering a high fluorescence quantum yield within a narrow detection window. The zinc(II)-dependent spectral data of compounds 3 and 4 under aqueous conditions buffered at neutrality are also included. On account of the tendency of the BODIPY-derived compounds 1, 3, and 4 to aggregate in water, a 1:1 mixture of CH3CN and water that contained 4-(2-hydroxyethyl)-1-piperazineethanesulfonic acid (HEPES; 25 mm) and NaCl (25 mm) buffered at pH 7.3 was used as the solvent in this study to eliminate aggregation and to provide reproducible data.
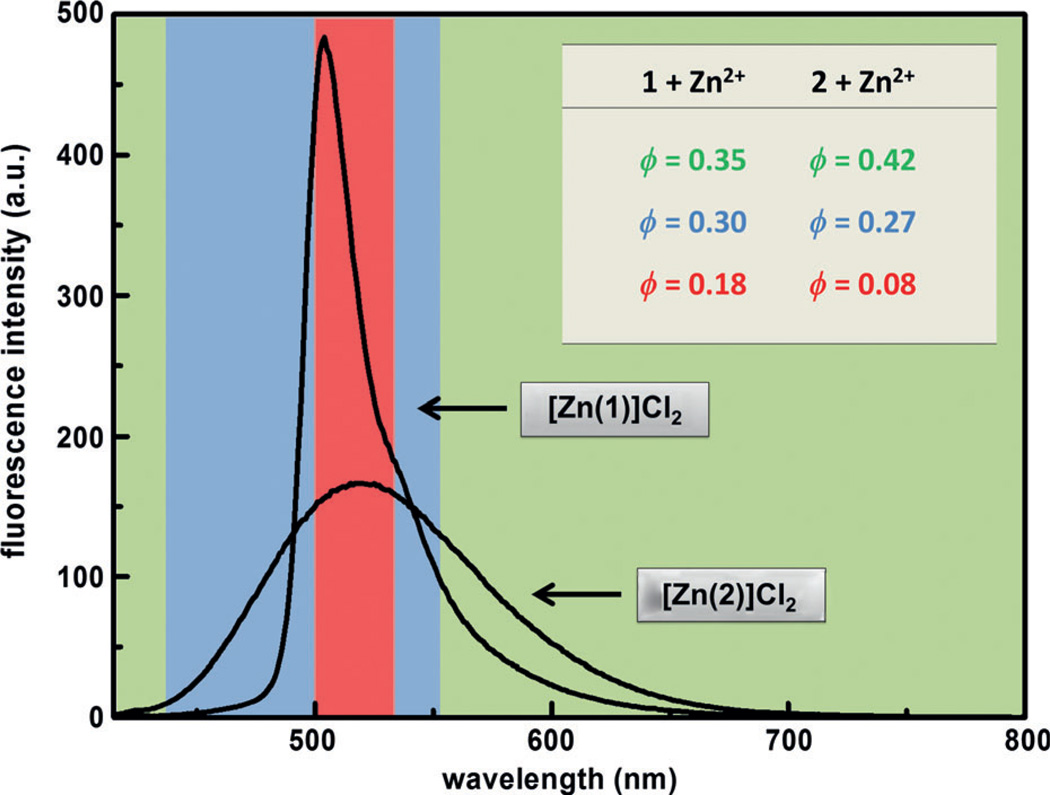
A high fluorescence quantum yield (ϕ) of the zinc(II) complex of an indicator is desired to achieve a high signal-to-noise ratio in microscopic imaging of zinc(II) ions. A comparison of the ϕ values of the zinc(II) complexes of 1, which is a donor–acceptor FRET conjugate, and 2, which is the donor alone, reveals the advantages of the FRET strategy. The ϕ value of [Zn(1)]Cl2 (0.35) is lower than that of [Zn(2)]Cl2 (0.42) when integrated over the entire spectral range (Figure 2, green window). However, because compound 1 has the sharper (narrower half-width) emission band of BODIPY than that of 2, as the emission detection window zooms onto the BODIPY band, for example, across 500–530 nm, which is the detection window of the subsequent confocal fluorescence microscopic experiments, the fractional ϕ value of [Zn(1)]Cl2 within that narrow range is higher than that of [Zn(2)]Cl2 (Figure 2, red window).
Figure 2.
Fractional fluorescence quantum yield (ϕ) values of compounds 1 and 2 in the presence of 20 equiv of ZnCl2 in water/CH3CN mixture (1:1) containing HEPES (25 mm) and NaCl (25 mm) at pH 7.3 determined within different spectral windows. Green: 415–800 nm; blue: 450–550 nm; red: 500–530 nm. The values determined within the green window equate the actual fluorescence quantum yields of the zinc(II) complexes.
Applying a narrow emission detection window is desirable in fluorescence microscopic experiments to 1) reduce the non-specific background fluorescence, and 2) allow and facilitate multicolor imaging. By using the FRET strategy, the bandwidth of a zinc(II)-sensitive dye is effectively reduced so that the zinc(II)-dependent emission can be captured with a high photon count within a narrow detection window. A large number of zinc(II) indicators published in the chemistry literature have excellent zinc(II) sensitivity, but relatively broad emission bands that bleed out of the coverage of a conventional emission filter, thus limiting their effectiveness in multicolor imaging. The reported FRET strategy might be applied to convert the zinc(II)-dependent emission of these zinc(II)-sensitive dyes to the emission of dyes with small bandwidths that are widely used in fluorescence microscopic multicolor imaging experiments, such as BODIPY.
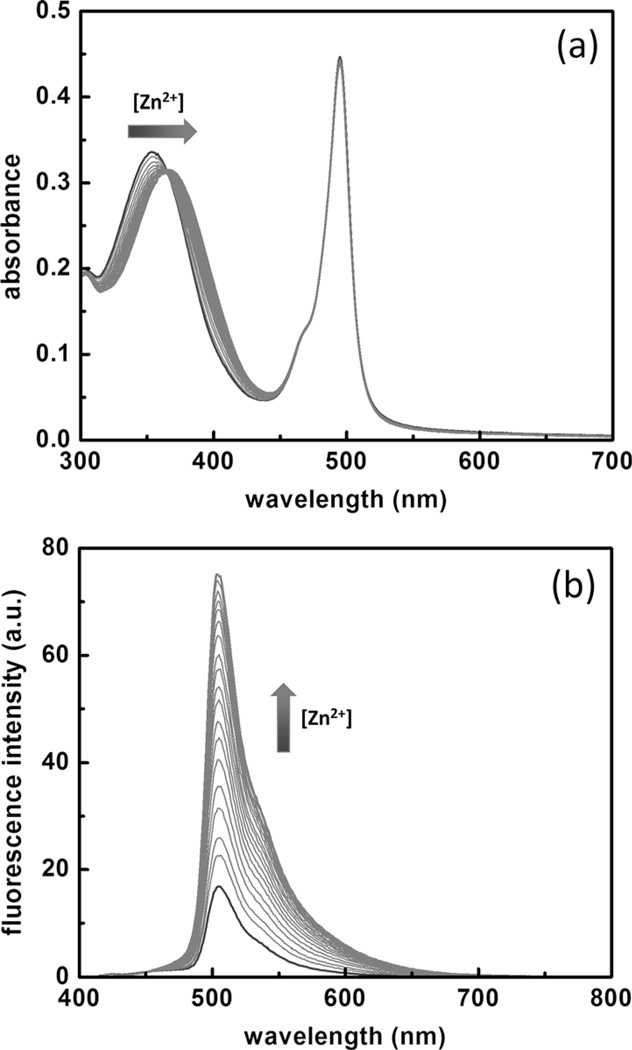
The zinc(II)-dependent absorption and emission spectra of compound 3 were shown in Figure 3. The FRET donor portion of the absorption spectrum of 3 undergoes a bathochromic shift as [ZnCl2] increases, whereas the BODIPY acceptor absorption band hardly changes (Figure 3a). Upon excitation at 405 nm, only the fluorescence of BODIPY was observed, the intensity of which increases upon the addition of ZnCl2 (Figure 3b). These observations are consistent with the model that zinc(II) coordination to compound 3 increases the molar absorptivity of the FRET donor, which leads to the amplification of the acceptor emission through an efficient intramolecular FRET. The spectra of the other compounds are included in the Supporting Information (Figures S1–S3). The absorption and emission maxima and fluorescence quantum yields are listed in Table 1. Job plots of compounds 1 and 2 (Figure S4 and S5 in the Supporting Information) suggest that ZnCl2 forms [ZnL2]Cl2 complexes (L=ligand) with the reported series of compounds. Therefore, the binding isotherms of 1–4 (Figures S6–S9 in the Supporting Information) are fitted to a 2:1 (ligand/metal) binding script by using Origin software, which yields the Ka values in Table 1.
Figure 3.
a) Absorption spectral changes of 3 (10 µm) on addition of ZnCl2 (0–12 equiv) in water/CH3CN mixture (1:1) containing HEPES (25 mm) and NaCl (25 mm) at pH 7.3. b) Corresponding changes in the emission spectra; λex=405 nm.
Table 1.
Photophysical data of ligands 1–4 and their zinc(II) complexes (ZnL2), and the association constants (Ka) of ZnL2.
| L | λmax(abs) [nm] L/ZnL2 | λmax(em) [nm] L/ZnL2 | ϕL [a] | ϕZnL2 [a] | Ka [m−2] |
|---|---|---|---|---|---|
| 1 | (350, 495)/(361, 495) | 504/504 | 0.35 | 0.35 | 1 × 10⁹ |
| 2 | 346/357 | 456/520 | 0.34 | 0.42 | 3 × 10⁹ |
| 3 | (350, 495)/(365, 495) | 504/504 | 0.25 | 0.24 | 1 × 10⁹ |
| 4 | (350, 495)/(359, 495) | 504/504 | 0.32 | 0.33 | 6 × 10⁹ |
The ligand concentrations were kept at 1.0 µm. The excitation wavelengths are selected at the absorption maxima of the FRET donor bands of 1–4. Quinine bisulfate in 1 n H2SO4 solution was used as the standard. To ensure the saturation of zinc(II) in the measurements of ϕZnL2, the ratio of zinc(II)/L = 20:1.
The fluorimetric responses of compound 4 to various metal ions are plotted in Figure S10 of the Supporting Information. The 2,2’-bipyridyl (bipy)-containing 4 shows a binding preference to transition metals over the alkali and alkaline earth metal ions. Paramagnetic cobalt(II) and copper(II) quench the emission, whereas cadmium(II), which is in the same group as zinc(II), enhances the emission. Zinc(II) is able to outcompete most of the tested ions for the ligand except for cobalt(II), nickel(II), and copper(II). These observations are within the expectations based on the Irving–Williams order[22] and the hard and soft acids and bases (HSAB) theory.[23]
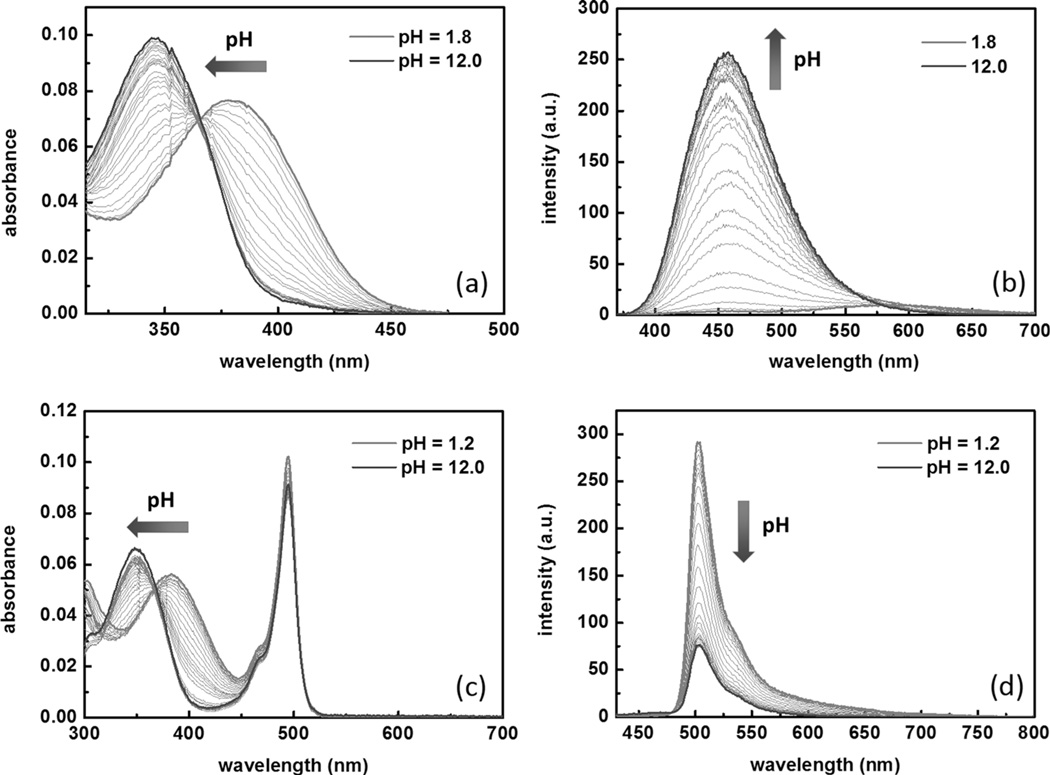
The dependence of absorption and emission of compounds 2 and 4 on pH is shown in Figure 4. As the solution is acidified, the absorption of the donor-only compound 2 shifts to a longer wavelength (Figure 4a), which results from protonation at the bipy site. The fluorescence spectra of 2 acquired upon excitation at 360 nm reveal protonation-effected quenching (Figure 4b). When excited at 405 nm, at which the protonated form absorbs using an otherwise identical instrumental parameter set, the emission intensity remains low across the tested pH range (Figure S11 in the Supporting Information). For the FRET-conjugate compound 4, the absorption of the donor band undergoes a bathochromic shift upon protonation, whereas the BODIPY acceptor absorption changes little (Figure 4c). Different from the donor-only compound 2, the emission intensity of the FRET conjugate 4 under excitation at 405 nm increases as the solution is acidified (Figure 4d). The fluorescence quantum yields of 2 at low (pH 1.8) and high (pH 12.0) pH values are 0.02 and 0.34, respectively, whereas those of 4 are 0.09 and 0.31, respectively. From these data, we conclude that although both 2 and 4 experience protonation-effected quenching, the FRET process in 4 reduces the degree of fluorescence quantum yield loss that the donor suffers from protonation. This protective effect could be attributed to a highly efficient FRET process that competes with the quenching pathway.[24]
Figure 4.
Spectra of compounds 2 (2.0 µm) and 4 (2.0 µm) in a water/CH3CN mixture (1:1) containing HEPES (25 mm) and NaCl (25 mm). The increase in pH value follows the directions of the arrows. a) The absorption spectra of compound 2; b) the emission spectra of 2 (λex=360 nm); c) the absorption spectra of compound 4; and d) the emission spectra of 4 (λex=405 nm).
The pKa value of compound 4 under the conditions shown in the caption of Figure 4 was determined to be 3.1 and 2.7 on the basis of the pH-dependent absorption and emission data (Figure 4c and d), respectively. The pH titration isotherms and fitting curves are included in Figure S12 of the Supporting Information. Therefore, protonation of compound 4 shall not interfere with zinc(II) detection under physiological conditions, even within the acidic confines of lysosomes of mammalian cells at pH 4.5–5.0.[25] The absorption and emission dependence on ZnCl2 at pH 4.8 (Figure S13 in the Supporting Information) is similar to that at pH 7.3, and the zinc(II) affinity constant is 1 × 10⁹m−2, also on par with the value at pH 7.3 (Table 1).
Photostability of compounds 2–4
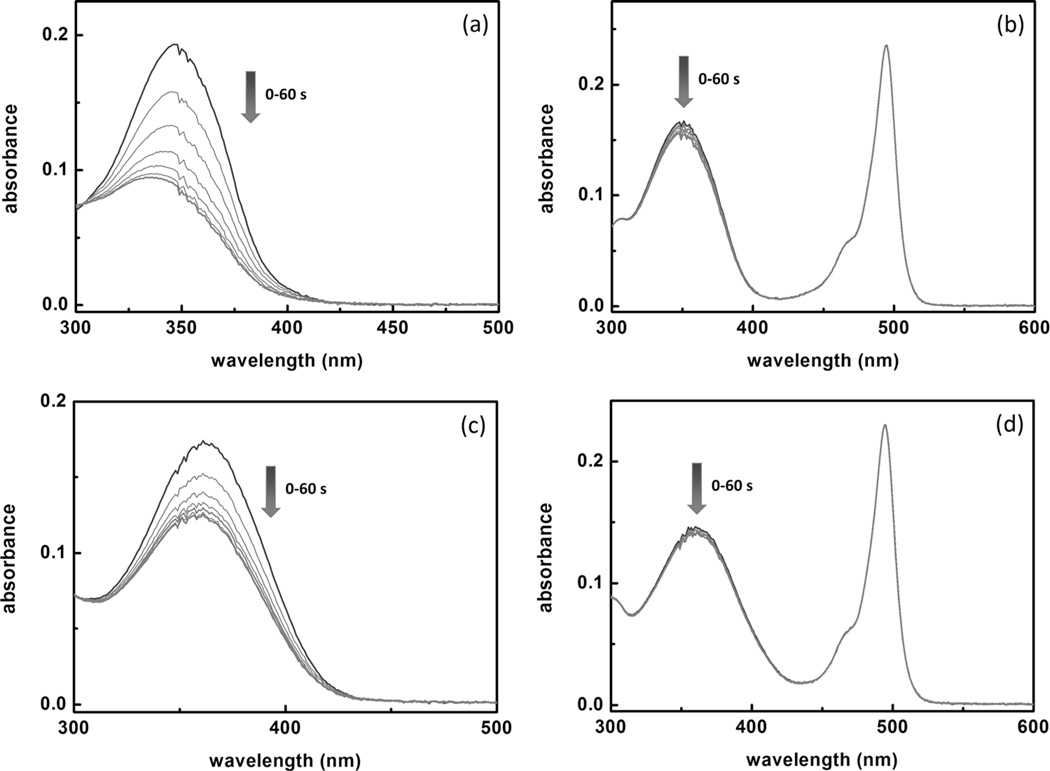
The susceptibilities of compounds 2 and 4 to UV irradiation were compared by subjecting the dye solutions (5 µm) under UV irradiation (365 nm) from a handheld UV lamp for one minute. The absorption band of the donor-only compound 2 decreases (Figure 5a), presumably owing to trans–cis photoisomerization. The degree of the drop in the donor absorption of the FRET-conjugate compound 4 is much less (Figure 5b) under the same conditions, which suggests that the FRET process protects the donor component from undergoing photoisomerization or other photobleaching processes initiated through UV irradiation. The stabilization effect of intramolecular FRET on the donor absorption is also replicated in the presence of 100 µm of ZnCl2 (Figure 5c and d).
Figure 5.
The absorption spectra of compounds a) 2 and b) 4 at 5 µm each in a 1:1 water/CH3CN mixture at pH 7.3 (HEPES 25 mm, NaCl 25 mm) acquired under irradiation from a handheld UV lamp (365 nm) for 1 min. The spectra were collected at 10 s increments. The changes of absorption spectra of c) 2 and d) 4 under the same conditions in the presence of ZnCl2 (100 µm).
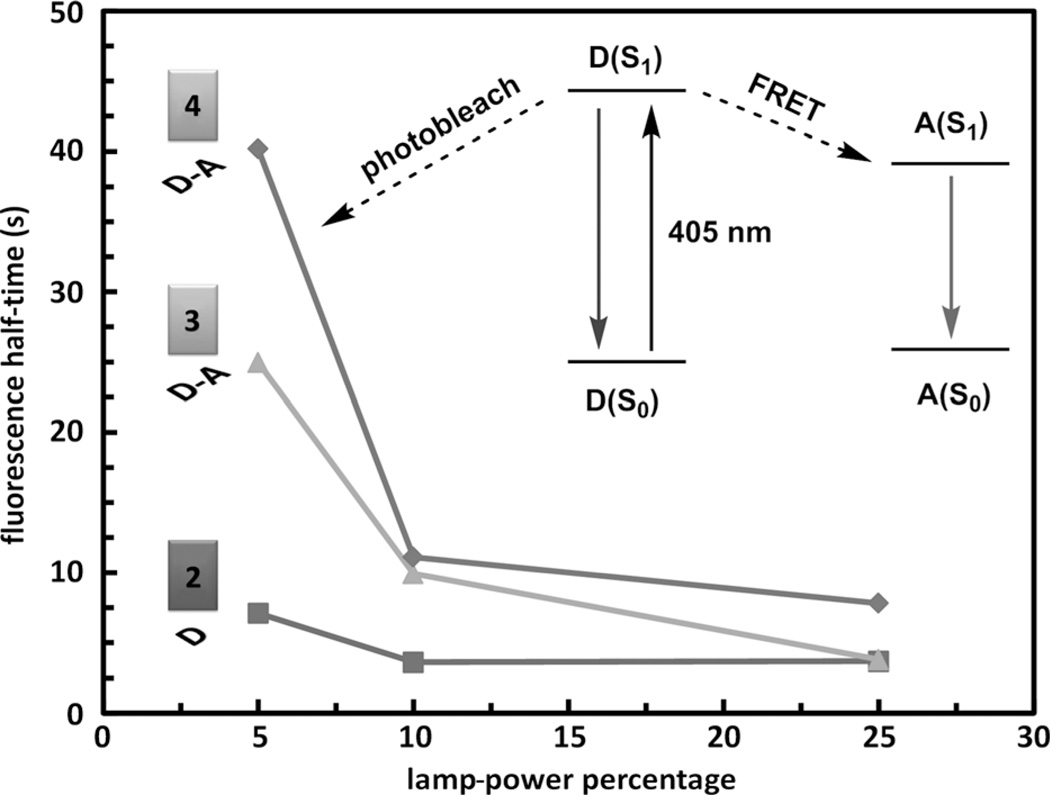
The photostability of dyes 2–4 in live-cell fluorescence imaging experiments was studied using wide-field fluorescence microscopy. In a typical procedure,[8b, 26] HeLa (S3) cells were incubated in a growth medium that contained 2 µm of an indicator for 30 min. The indicator-containing medium was subsequently replaced with a fresh medium that contained 50 µm of ZnCl2. The fluorescence images were acquired after a 10 min incubation period using an excitation window of 305–405 nm. Under these conditions, the zinc(II)-bound donor moieties in 2–4 are excited, and the emission within 510–560 nm was monitored over time at three different lamp powers (Figure 6). Invariably, the half-times of all three dyes decreased as lamp power increased, but the FRET conjugates 3 and 4 have longer halftimes than that of the FRET donor control compound 2 at low lamp powers.
Figure 6.
Fluorescence half-time of donor (D) 2 and donor–acceptor conjugates (D–A) 3 and 4 under the zinc(II)-adequate (ZA) conditions as a function of the power of the excitation source (see the Supporting Information for details). Inset: scheme explaining how FRET increases the photostability of the donor (D) component in compounds 3 and 4.
The increased photostability of the FRET-conjugate ligands is consistent with the excited-state model of compounds 2–4 depicted in the inset of Figure 6. As the FRET donor is excited, in the absence of an acceptor, it might photobleach (i.e., undergo irreversible photochemical reactions with intracellular species) rapidly to afford a short half-time, and thereby result in low photostability. A FRET acceptor offers a rapid energy-transfer pathway (≈50 ps in 1)[10] to send the donor back to the ground state before the photobleaching occurs. Therefore, the FRET donor is protected, thus leading to higher photostability.
Confocal fluorescence microscopy
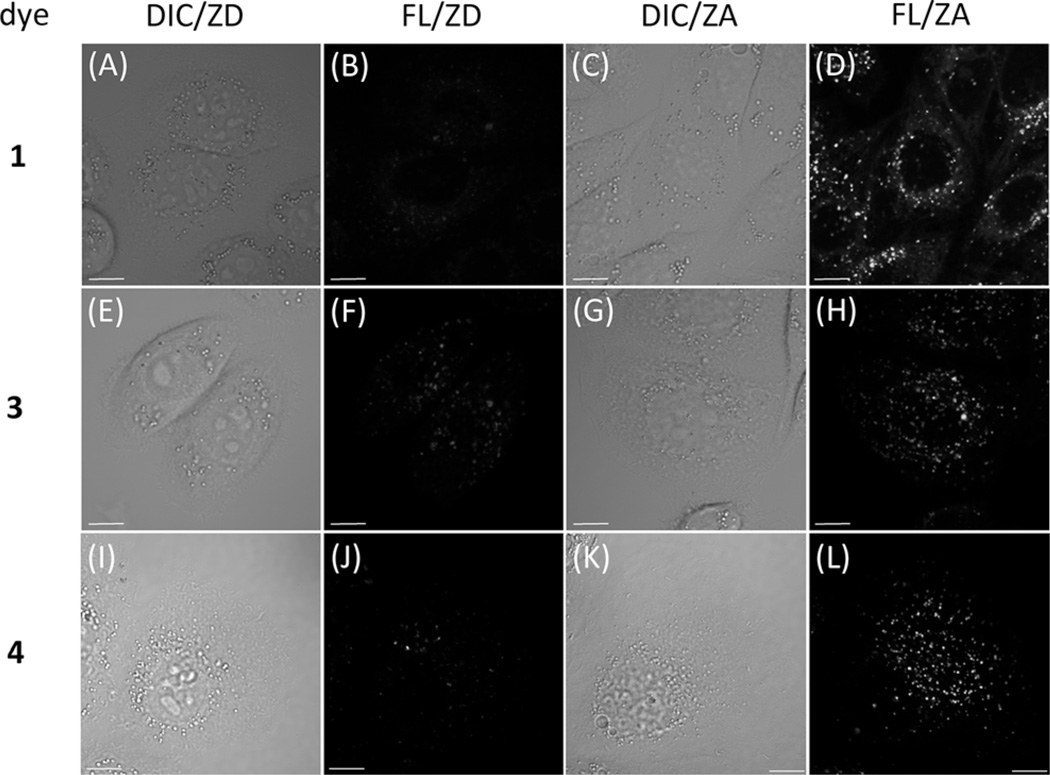
The abilities of FRET-conjugates 1, 3, and 4 to illuminate intracellular zinc(II) ions were evaluated by using confocal fluorescence microscopy. The same indicator and zinc(II)-incubation procedures as described in the previous subsection were applied. After loading the indicator molecules, the replenished medium contained either no ZnCl2 or 50 µm ZnCl2, in addition to 50 µm sodium pyrithione as a zinc(II) ionophore. These two conditions are henceforth dubbed zinc(II)-deficient (ZD) and zinc(II)-adequate (ZA) conditions, respectively. The confocal fluorescence images were taken after a 10 min incubation period; these are shown together with the differential interference contrast (DIC) images in Figure 7. The excitation source is a 405 nm diode laser, which selectively excites the zinc(II)-bound FRET donor moiety. The detection window covers the region 500–530 nm.
Figure 7.
Differential interference contrast (DIC) and fluorescence (FL) images of HeLa (S3) cells incubated with compounds 1, 3, or 4 (2 µm, top to bottom) for 30 min, taken under the zinc(II)-deficient (ZD, [ZnCl2]=0) or the zinc(II)-adequate (ZA, [ZnCl2]=50 µm) conditions. The growth medium contained sodium pyrithione (50 µm) as a zinc(II) ionophore. The excitation source was a 405 nm diode laser. The emission window was 500–530 nm. Scale bar = 10 µm.
For all three compounds, the HeLa (S3) cells incubated under the ZA conditions (50 µm ZnCl2 in the growth medium) show brighter fluorescence than those incubated under the ZD conditions (no supplemental zinc(II)), using an identical set of instrumental parameters. The subcellular localization properties, however, are different. Compound 1 (Figure 7, frames A–D), which includes no functional group to target any subcellular organelle, nonspecifically stains the intracellular space except the nuclei. Compounds 3 (frames E–H) and 4 (frames I–L), which contain secondary and a tertiary amino groups, respectively, exhibit punctate staining patterns characteristic of lysosomal localization.[20c, d, f, 27] The preference of lysosomal localization of 1, 3, and 4 is quantified by the colocalization Pearson’s coefficient in HeLa (S3) cells that express FusionRed-LAMP (LAMP=lysosome associated membrane protein, also known as Lysosome-20), which is a red fluorescent protein that marks lysosomes. BODIPY has an emission maximum of approximately 512 nm, relative to approximately 608 nm for FusionRed, a very wide spectral separation that allows for reliable colocalization analysis. The Pearson’s coefficient of compound 1 is 29%, which is considered a poor overlap. The inclusion of a secondary amino group in compound 3 elevates the Pearson’s coefficient to 56%, an apparent preference for lysosomes. Compound 4, which contains a morpholino group extensively used for lysosome targeting,[20c, 28] achieves a higher Pearson’s coefficient of 67%. The two-channel overlay images of compounds 1, 3, and 4 with FusionRed-LAMP are shown in Figure S14 of the Supporting Information.
Structured illumination microscopy (SIM)
Compounds 3 and 4 are shown to selectively localize in lysosomes using confocal fluorescence microscopy. The limited spatial resolution of a confocal microscope does not allow the determination of whether or not the indicator molecules are inside lysosomes or are adsorbed on the membranes of these vesicles. The lateral resolution of a fluorescence image can be increased by using structured illumination microscopy (SIM). SIM operates by using beam interference to generate sinusoidally structured excitation, thereby generating fluorescence in the same pattern. By acquiring several images at different phases and orientations of this pattern, normally unobservable high-frequency information can be identified and included in the final composite SIM image. Thus the data are collectively processed to produce a reconstructed image with a high spatial resolution.[11a] SIM with a linear excitation is able to enhance the lateral resolution by a factor of two[11a] from the Abbe diffraction limit.[12] The recently developed nonlinear SIM in principle has an unlimited spatial resolution.[29]
Wright and co-workers have recently shown that the weakly basic 3-(2,4-dinitroanilino)-3′-amino-N-methyldipropylamine (DAMP)-derived protein activity probes are encapsulated in lysosomes in fixed cells using SIM.[30] In the current work, the interior localization of an amino-functionalized molecule in lysosomes in live cells is demonstrated. The application of two-color SIM on live HeLa (S3) cells transfected with Fusion-Red-LAMP and co-stained with compound 4 confirms that FusionRed-LAMP is anchored on the membrane of lysosomes, whereas compound 4 is confined in the lumen of lysosomes. A doubly stained HeLa (S3) cell is shown in Figure 8 (left). The region of interest (white box) is expanded in Figure 8 (middle). It is evident that all the red circles, which define the boundaries of lysosomes by FusionRed-LAMP, encapsulate the green-emitting indicator 4. A single lysosome is magnified in Figure 8 (right), which confirms the interior lysosomal localization of 4. The lateral resolution in this experiment reached approximately 110 nm in the green channel (BODIPY detection) and 130 nm in the red (FusionRed detection), and was determined using the SIM analysis module available in the ZEN 2012 software (Zeiss, Thornwood, New York, USA).
Figure 8.
Localization of compound 4 (green) compared to that of a lysosome-associated membrane protein (LAMP) fused to the fluorescent protein FusionRed (red). HeLa (S3) cells were transiently transfected to express FusionRed-LAMP, then loaded with 4 (2 µm) immediately prior to live-cell multicolor SIM imaging (green: 495–550 nm; red: 570–620 nm).
Conclusion
We have demonstrated an intramolecular FRET strategy to improve the photostability and to decrease the bandwidth of a zinc(II)-sensitive fluoroionophore under the context of fluorescence microscopy. For compounds 1, 3, and 4, in which intramolecular FRET is highly efficient, the emission of the acceptor BODIPY is intensified upon zinc(II) binding at the donor site, because the coordination reaction increases the molar absorptivity of the FRET donor at the excitation wavelength. The fractional fluorescence quantum yield of the FRET-conjugate complex [Zn(1)]Cl2 is higher than that of the FRET donor alone [Zn(2)]Cl2 within the narrow emission detection window often favored in fluorescence microscopic experiments for permitting multicolor labeling. The photostabilities of the FRET-conjugate indicators are higher than the FRET donor alone in wide-field fluorescence microscopic imaging of live HeLa (S3) cells. Compounds 3 and 4 contain aliphatic amino groups, which guide the molecules to lysosomes of mammalian cells as shown under a confocal fluorescence microscope. It was unambiguously resolved that the amino-appended FRET-conjugate indicator 4 arrives at the interior of lysosomes of live cells, rather than anchoring on the lysosomal membranes, by using two-color structured illumination microscopy.
Supplementary Material
Acknowledgements
This work was supported by the National Institute of General Medical Sciences (no. R01M081382). We thank Kirsten Daykin (FSU) for the help in synthesizing compound 4.
Footnotes
Supporting information for this article is available on the WWW under http://dx.doi.org/10.1002/chem.201403479.
Contributor Information
Michael W. Davidson, Email: davidson@magnet.fsu.edu.
Lei Zhu, Email: lzhu@chem.fsu.edu.
References
- 1.a) Kikuchi K, Komatsu H, Nagano T. Curr. Opin. Chem. Biol. 2004;8:182–191. doi: 10.1016/j.cbpa.2004.02.007. [DOI] [PubMed] [Google Scholar]; b) Jiang P, Guo Z. Coord. Chem. Rev. 2004;248:205–229. [Google Scholar]; c) Thompson RB. Curr. Opin. Chem. Biol. 2005;9:526–532. doi: 10.1016/j.cbpa.2005.08.020. [DOI] [PubMed] [Google Scholar]; d) Lim NC, Freake HC, Brückner C. Chem. Eur. J. 2005;11:38–49. doi: 10.1002/chem.200400599. [DOI] [PubMed] [Google Scholar]; e) Chang CJ, Lippard SJ. Met. Ions Life Sci. 2006;1:321–370. [Google Scholar]; f) Dai Z, Canary JW. New J. Chem. 2007;31:1708–1718. [Google Scholar]; g) Carol P, Sreejith S, Ajayaghosh A. Chem. Asian J. 2007;2:338–348. doi: 10.1002/asia.200600370. [DOI] [PubMed] [Google Scholar]; h) Domaille DW, Que EL, Chang CJ. Nat. Chem. Biol. 2008;4:168–175. doi: 10.1038/nchembio.69. [DOI] [PubMed] [Google Scholar]; i) Que EL, Domaille DW, Chang CJ. Chem. Rev. 2008;108:1517–1549. doi: 10.1021/cr078203u. [DOI] [PubMed] [Google Scholar]; j) McRae R, Bagchi P, Sumalekshmy S, Fahrni CJ. Chem. Rev. 2009;109:4780–4827. doi: 10.1021/cr900223a. [DOI] [PMC free article] [PubMed] [Google Scholar]; k) Nolan EM, Lippard SJ. Acc. Chem. Res. 2009;42:193–203. doi: 10.1021/ar8001409. [DOI] [PMC free article] [PubMed] [Google Scholar]; l) Tomat E, Lippard SJ. Curr. Opin. Chem. Biol. 2010;14:225–230. doi: 10.1016/j.cbpa.2009.12.010. [DOI] [PMC free article] [PubMed] [Google Scholar]; m) Xu Z, Yoon J, Spring DR. Chem. Soc. Rev. 2010;39:1996–2006. doi: 10.1039/b916287a. [DOI] [PubMed] [Google Scholar]; n) Pluth MD, Tomat E, Lippard SJ. Annu. Rev. Biochem. 2011;80:333–355. doi: 10.1146/annurev-biochem-061009-091643. [DOI] [PMC free article] [PubMed] [Google Scholar]; o) Huang Z, Lippard SJ. Methods Enzymol. 2012;505:445–468. doi: 10.1016/B978-0-12-388448-0.00031-0. [DOI] [PMC free article] [PubMed] [Google Scholar]; p) Liu Z, He W, Guo Z. Chem. Soc. Rev. 2013;42:1568–1600. doi: 10.1039/c2cs35363f. [DOI] [PubMed] [Google Scholar]; q) Carter KP, Young AM, Palmer AE. Chem. Rev. 2014;114:4564–4601. doi: 10.1021/cr400546e. [DOI] [PMC free article] [PubMed] [Google Scholar]
- 2.a) Lavis LD, Raines RT. ACS Chem. Biol. 2008;3:142–155. doi: 10.1021/cb700248m. [DOI] [PMC free article] [PubMed] [Google Scholar]; b) Lavis LD, Raines RT. ACS Chem. Biol. 2014;9:855–866. doi: 10.1021/cb500078u. [DOI] [PMC free article] [PubMed] [Google Scholar]
- 3.a) Loudet A, Burgess K. Chem. Rev. 2007;107:4891–4932. doi: 10.1021/cr078381n. [DOI] [PubMed] [Google Scholar]; b) Ulrich G, Ziessel R, Harriman A. Angew. Chem. Int. Ed. 2008;47:1184–1201. doi: 10.1002/anie.200702070. [DOI] [PubMed] [Google Scholar]; Angew. Chem. 2008;120:1202–1219. [Google Scholar]; c) Lee J-S, Kang N-y, Kim YK, Samanta A, Feng S, Kim HK, Vendrell M, Park JH, Chang Y-T. J. Am. Chem. Soc. 2009;131:10077–10082. doi: 10.1021/ja9011657. [DOI] [PubMed] [Google Scholar]; d) Boens N, Leen V, Dehaen W. Chem. Soc. Rev. 2012;41:1130–1172. doi: 10.1039/c1cs15132k. [DOI] [PubMed] [Google Scholar]; e) Lu H, Mack J, Yang Y, Shen Z. Chem. Soc. Rev. 2014;43:4778–4823. doi: 10.1039/c4cs00030g. [DOI] [PubMed] [Google Scholar]
- 4.a) Turro NJ. Modern Molecular Photochemistry. Sausalito: University Science Books; 1991. [Google Scholar]; b) Lakowicz JR. Principles of Fluorescence Spectroscopy. 3rd ed. New York: Springer; 2006. [Google Scholar]
- 5.Miyawaki A, Llopis J, Heim R, McCaffery JM, Adams JA, Ikura M, Tsien RY. Nature. 1997;388:882–887. doi: 10.1038/42264. [DOI] [PubMed] [Google Scholar]
- 6.Tyagi S, Kramer FR. Nat. Biotechnol. 1996;14:303–308. doi: 10.1038/nbt0396-303. [DOI] [PubMed] [Google Scholar]
- 7.a) van Dongen EMWM, Dekkers LM, Spijker K, Meijer EW, Klomp LWJ, Merkx M. J. Am. Chem. Soc. 2006;128:10754–10762. doi: 10.1021/ja0610030. [DOI] [PubMed] [Google Scholar]; b) Vinkenborg JL, Nicolson TJ, Bellomo EA, Koay MS, Rutter GA, Merkx M. Nat. Methods. 2009;6:737–U710. doi: 10.1038/nmeth.1368. [DOI] [PMC free article] [PubMed] [Google Scholar]; c) Dittmer PJ, Miranda JG, Gorski JA, Palmer AE. J. Biol. Chem. 2009;284:16289–16297. doi: 10.1074/jbc.M900501200. [DOI] [PMC free article] [PubMed] [Google Scholar]; d) Qin Y, Dittmer PJ, Park JG, Jansen KB, Palmer AE. Proc. Natl. Acad. Sci. USA. 2011;108:7351–7356. doi: 10.1073/pnas.1015686108. [DOI] [PMC free article] [PubMed] [Google Scholar]; e) Park JG, Qin Y, Galati DF, Palmer AE. ACS Chem. Biol. 2012;7:1636–1640. doi: 10.1021/cb300171p. [DOI] [PMC free article] [PubMed] [Google Scholar]
- 8.a) Wandell RJ, Younes AH, Zhu L. New J. Chem. 2010;34:2176–2182. [Google Scholar]; b) Sreenath K, Allen JR, Davidson MW, Zhu L. Chem. Commun. 2011;47:11730–11732. doi: 10.1039/c1cc14580k. [DOI] [PMC free article] [PubMed] [Google Scholar]; c) Sreenath K, Clark RJ, Zhu L. J. Org. Chem. 2012;77:8268–8279. doi: 10.1021/jo3016659. [DOI] [PMC free article] [PubMed] [Google Scholar]
- 9.a) Quang DT, Kim JS. Chem. Rev. 2010;110:6280–6301. doi: 10.1021/cr100154p. [DOI] [PubMed] [Google Scholar]; b) Eun Jun M, Roy B, Ahn KH. Chem. Commun. 2011;47:7583–7601. doi: 10.1039/c1cc00014d. [DOI] [PubMed] [Google Scholar]; c) Chen X, Pradhan T, Wang F, Kim JS, Yoon J. Chem. Rev. 2012;112:1910–1956. doi: 10.1021/cr200201z. [DOI] [PubMed] [Google Scholar]
- 10.Sreenath K, Yi C, Knappenberger JKL, Jr, Zhu L. Phys. Chem. Chem. Phys. 2014;16:5088–5092. doi: 10.1039/c3cp55382e. [DOI] [PubMed] [Google Scholar]
- 11.a) Gustafsson MGL. J. Microsc. 2000;198:82–87. doi: 10.1046/j.1365-2818.2000.00710.x. [DOI] [PubMed] [Google Scholar]; b) Gustafsson MGL, Shao L, Carlton PM, Wang CJR, Golubovskaya IN, Cande WZ, Agard DA, Sedat JW. Biophys. J. 2008;94:4957–4970. doi: 10.1529/biophysj.107.120345. [DOI] [PMC free article] [PubMed] [Google Scholar]
- 12.Murphy DB, Davidson MW. Fundamentals of Light Microscopy and Electronic Imaging. 2nd ed. Hoboken: Wiley-Blackwell; 2013. [Google Scholar]
- 13.Zhu L, Yuan Z, Sreenath K, Simmons JT. RSC Adv. 2014;4:20398–20440. doi: 10.1039/C4RA00354C. [DOI] [PMC free article] [PubMed] [Google Scholar]
- 14.a) Krężel A, Maret W. J. Biol. Inorg. Chem. 2006;11:1049–1062. doi: 10.1007/s00775-006-0150-5. [DOI] [PubMed] [Google Scholar]; b) Krężel A, Hao Q, Maret W. Arch. Biochem. Biophys. 2007;463:188–200. doi: 10.1016/j.abb.2007.02.017. [DOI] [PubMed] [Google Scholar]; c) Krężel A, Maret W. J. Biol. Inorg. Chem. 2008;13:401–409. doi: 10.1007/s00775-007-0330-y. [DOI] [PubMed] [Google Scholar]; d) Colvin RA, Holmes WR, Fontaine CP, Maret W. Metallomics. 2010;2:306–317. doi: 10.1039/b926662c. [DOI] [PubMed] [Google Scholar]
- 15.Bell SG, Vallee BL. ChemBioChem. 2009;10:55–62. doi: 10.1002/cbic.200800511. [DOI] [PubMed] [Google Scholar]
- 16.Another possibility for the lysosome zinc(II) increase upon subjection to oxidative stress is that the zinc(II)-containing proteins inside lysosomes are oxidized. One might speculate that zinc(II)-charged metallothioneins can enter lysosomes by means of autophagy or other means, which has been reported: Kägi JHR, Schäffer A. Biochemistry. 1988;27:8509–8515. doi: 10.1021/bi00423a001. Baird SK, Kurtz T, Brunk UT. Biochem. J. 2006;394:275–283. doi: 10.1042/BJ20051143.
- 17.Lee S-J, Koh J-Y. Mol. Brain. 2010;3:30. doi: 10.1186/1756-6606-3-30. [DOI] [PMC free article] [PubMed] [Google Scholar]
- 18.Sensi SL, Paoletti P, Koh J-Y, Aizenman E, Bush AI, Hershfinkel M. J. Neurosci. 2011;31:16076–16085. doi: 10.1523/JNEUROSCI.3454-11.2011. [DOI] [PMC free article] [PubMed] [Google Scholar]
- 19.a) Hwang JJ, Lee S-J, Kim T-Y, Cho J-H, Koh J-Y. J. Neurosci. 2008;28:3114–3122. doi: 10.1523/JNEUROSCI.0199-08.2008. [DOI] [PMC free article] [PubMed] [Google Scholar]; b) Roh HC, Collier S, Guthrie J, Robertson JD, Kornfeld K. Cell Metab. 2012;15:88–99. doi: 10.1016/j.cmet.2011.12.003. [DOI] [PMC free article] [PubMed] [Google Scholar]
- 20.a) Anderson RGW, Falck JR, Goldstein JL, Brown MS. Proc. Natl. Acad. Sci. USA. 1984;81:4838–4842. doi: 10.1073/pnas.81.15.4838. [DOI] [PMC free article] [PubMed] [Google Scholar]; b) Anderson RGW, Orci L. J. Cell. Biol. 1988;106:539–543. doi: 10.1083/jcb.106.3.539. [DOI] [PMC free article] [PubMed] [Google Scholar]; c) Galindo F, Burguete MI, Vigara L, Luis SV, Kabir N, Gavrilovic J, Russell DA. Angew. Chem. Int. Ed. 2005;44:6504–6508. doi: 10.1002/anie.200501920. [DOI] [PubMed] [Google Scholar]; Angew. Chem. 2005;117:6662–6666. [Google Scholar]; d) Kim HM, An MJ, Hong JH, Jeong BH, Kwon O, Hyon J-Y, Hong S-C, Lee KJ, Cho BR. Angew. Chem. Int. Ed. 2008;47:2231–2234. doi: 10.1002/anie.200704586. [DOI] [PubMed] [Google Scholar]; Angew. Chem. 2008;120:2263–2266. [Google Scholar]; e) Wang X, Nguyen DM, Yanez CO, Rodriguez L, Ahn H-Y, Bondar MV, Belfield KD. J. Am. Chem. Soc. 2010;132:12237–12239. doi: 10.1021/ja1057423. [DOI] [PMC free article] [PubMed] [Google Scholar]; f) Han JH, Park SK, Lim CS, Park MK, Kim HJ, Kim HM, Cho BR. Chem. Eur. J. 2012;18:15246–15249. doi: 10.1002/chem.201203452. [DOI] [PubMed] [Google Scholar]; g) http://probes.invitrogen.com/media/pis/mp07525.pdf.
- 21.a) Rostovtsev VV, Green LG, Fokin VV, Sharpless KB. Angew. Chem. Int. Ed. 2002;41:2596–2599. doi: 10.1002/1521-3773(20020715)41:14<2596::AID-ANIE2596>3.0.CO;2-4. [DOI] [PubMed] [Google Scholar]; Angew. Chem. 2002;114:2708–2711. [Google Scholar]; b) Tornøe CW, Christensen C, Meldal M. J. Org. Chem. 2002;67:3057–3064. doi: 10.1021/jo011148j. [DOI] [PubMed] [Google Scholar]
- 22.Irving H, Williams RJP. Nature. 1948;162:746–747. [Google Scholar]
- 23.Pearson RG. Science. 1966;151:172–177. doi: 10.1126/science.151.3707.172. [DOI] [PubMed] [Google Scholar]
- 24.See a recent paper on applying FRET strategy in fluorescent dye development: Su D, Oh J, Lee S-C, Lim JM, Sahu S, Yu X, Kim D, Chang Y-T. Chem. Sci. 2014 Advanced Article.
- 25.Mindell JA. Annu. Rev. Physiol. 2012;74:69–86. doi: 10.1146/annurev-physiol-012110-142317. [DOI] [PubMed] [Google Scholar]
- 26.Simmons JT, Allen JR, Morris DR, Clark RJ, Levenson CW, Davidson MW, Zhu L. Inorg. Chem. 2013;52:5838–5850. doi: 10.1021/ic302798u. [DOI] [PMC free article] [PubMed] [Google Scholar]
- 27.Xue L, Li G, Zhu D, Liu Q, Jiang H. Inorg. Chem. 2012;51:10842–10849. doi: 10.1021/ic301307v. [DOI] [PubMed] [Google Scholar]
- 28.Yu H, Xiao Y, Jin L. J. Am. Chem. Soc. 2012;134:17486–17489. doi: 10.1021/ja308967u. [DOI] [PubMed] [Google Scholar]
- 29.Gustafsson MGL. Proc. Natl. Acad. Sci. USA. 2005;102:13081–13086. doi: 10.1073/pnas.0406877102. [DOI] [PMC free article] [PubMed] [Google Scholar]
- 30.Wiedner SD, Anderson LN, Sadler NC, Chrisler WB, Kodali VK, Smith RD, Wright AT. Angew. Chem. Int. Ed. 2014;53:2919–2922. doi: 10.1002/anie.201309135. [DOI] [PMC free article] [PubMed] [Google Scholar]; Angew. Chem. 2014;126:2963–2966. [Google Scholar]
Associated Data
This section collects any data citations, data availability statements, or supplementary materials included in this article.


