

Abstract
Plumbagin (PLB) has exhibited a potent anticancer effect in preclinical studies, but the molecular interactome remains elusive. This study aimed to compare the quantitative proteomic responses to PLB treatment in human prostate cancer PC-3 and DU145 cells using the approach of stable-isotope labeling by amino acids in cell culture (SILAC). The data were finally validated using Western blot assay. First, the bioinformatic analysis predicted that PLB could interact with 78 proteins that were involved in cell proliferation and apoptosis, immunity, and signal transduction. Our quantitative proteomic study using SILAC revealed that there were at least 1,225 and 267 proteins interacting with PLB and there were 341 and 107 signaling pathways and cellular functions potentially regulated by PLB in PC-3 and DU145 cells, respectively. These proteins and pathways played a critical role in the regulation of cell cycle, apoptosis, autophagy, epithelial to mesenchymal transition (EMT), and reactive oxygen species generation. The proteomic study showed substantial differences in response to PLB treatment between PC-3 and DU145 cells. PLB treatment significantly modulated the expression of critical proteins that regulate cell cycle, apoptosis, and EMT signaling pathways in PC-3 cells but not in DU145 cells. Consistently, our Western blotting analysis validated the bioinformatic and proteomic data and confirmed the modulating effects of PLB on important proteins that regulated cell cycle, apoptosis, autophagy, and EMT in PC-3 and DU145 cells. The data from the Western blot assay could not display significant differences between PC-3 and DU145 cells. These findings indicate that PLB elicits different proteomic responses in PC-3 and DU145 cells involving proteins and pathways that regulate cell cycle, apoptosis, autophagy, reactive oxygen species production, and antioxidation/oxidation homeostasis. This is the first systematic study with integrated computational, proteomic, and functional analyses revealing the networks of signaling pathways and differential proteomic responses to PLB treatment in prostate cancer cells. Quantitative proteomic analysis using SILAC represents an efficient and highly sensitive approach to identify the target networks of anticancer drugs like PLB, and the data may be used to discriminate the molecular and clinical subtypes, and to identify new therapeutic targets and biomarkers, for prostate cancer. Further studies are warranted to explore the potential of quantitative proteomic analysis in the identification of new targets and biomarkers for prostate cancer.
Keywords: EMT, proteomics, SILAC
Introduction
Prostate cancer is the second most common cancer in men worldwide, after lung cancer.1 There were over 903,500 new prostate cancer cases reported worldwide and an estimated 258,400 men died from this disease in 2008.2 The incidence of prostate cancer varies significantly among different countries and ethnic groups. It is quite frequently diagnosed in North America and Europe but is rare in Asians.3–5 The age-standardized incidence rate of prostate cancer in the People’s Republic of China was 4.3 per 105, but it is 83.8 per 105 in the US.3,4 In the US, 196,038 men were diagnosed with prostate cancer, and 28,560 American men died from this disease in 2010.6,7 In the United Kingdom, 40,975 men were diagnosed with prostate cancer in 2010, and 10,793 men died from this disease in 2011.8 Although the 10-year survival rate for early prostate cancer was over 98% in the US, many patients were diagnosed with locally advanced or metastatic forms of prostate cancer in clinic.9,10 This will substantially and negatively affect the therapeutic outcomes. Current prostate cancer therapy includes surgery, radiation, hormone therapy, and chemotherapy.11 Androgen-deprivation therapy with antiandrogens remains the main treatment for later-stage prostate cancer, and it can effectively suppress prostate cancer growth during the first 12−24 months.12,13 However, androgen-deprivation therapy eventually fails and tumors may relapse, despite the absence of androgenic stimulation, and progress into the castration resistant (ie, hormone-refractory) stage, which accounts for the unappreciated failure of current therapies and the increase in prostate cancer mortality.12 On the other hand, chemotherapy usually brings drug resistance and severe adverse reactions in patients. Therefore, new anticancer drugs that can prevent the progression of prostate cancer and can execute prostate cancer cells with improved efficacy and reduced side effects are certainly and urgently needed.
Numerous abnormal biological events at cellular and sub-cellular levels occur in the process of prostate cancer initiation, development, progression, and relocation with the involvement of cell survival, cell death, cell invasion, activation of oncogenes, loss of tumor suppressor genes, and dysregulation of related signaling pathways.14–17 Comprehensively and globally exploring the molecule targets and underlying mechanisms will help identify new therapies for the treatment of prostate cancer.14,18,19 Recently, targeting programmed cell death and other important pathways has become a promising approach to treat prostate cancer through regulating cancer cell apoptosis and autophagy. On the other hand, emerging evidence suggests that the epithelial–mesenchymal transition (EMT) process is activated during prostate cancer development, growth, progression, and metastasis.20,21 It has been proposed that EMT is coopted by prostate cancer cells during their metastatic dissemination from a primary organ to secondary sites22 and, thus, intervention of this process may represent a novel strategy to prevent prostate cancer metastasis. Moreover, it has been reported that sirtuin (Sirt) 1, a class III nicotinamide adenine dinucleotide (NAD+)-dependent histone deacetylase, induces EMT by cooperating with EMT transcription factors and enhances prostate cancer cell migration and metastasis through deacetylation of its target proteins and modulation of EMT;23 thus, Sirt1 may represent a new therapeutic target for prostate cancer therapy.
Plumbagin ([PLB] 5-hydroxy-2-methyl-1,4-naphthoquinone, Figure 1A), an active naphthoquinone compound, possesses a wide spectrum of pharmacological activities, including anti-inflammatory, neuroprotective, anticancer, hypolipidemic, antiatherosclerotic, antibacterial, and antifungal activities in in vitro and in vivo models.24 Recently, increasing attention has been drawn to its anticancer effect. It has been proposed that the anticancer effect of PLB is mainly ascribed to induction of intracellular reactive oxygen species (ROS) generation, apoptosis and autophagy, and cell cycle arrest.24 In vitro and in vivo studies by our laboratory and other groups have showed that PLB induced cancer cell apoptosis and autophagy via modulation of cellular redox status, inhibition of NF-κB activation, upregulation of p53 via c-JNK phosphorylation, and inhibition of phosphatidylinositide 3-kinase (PI3K)/Akt/mTOR pathway.25–31 Several previous studies also found that ROS-mediated apoptotic pathways contributed to the anticancer effect of PLB in tumor-bearing nude mice.32–34 Although the characterization and identification of individual targets and related signaling pathways provided important evidence for the mechanism of actions of PLB in tumor cell killing in vitro and in vivo, the comprehensive and global understanding on the beneficial effect of PLB is lacking and the molecular interactome of PLB is unknown. Stable-isotope labeling by amino acids in cell culture (SILAC) is a practical and powerful approach to uncover the global proteomic responses to drug treatment and other interventions.35 In particular, it can be used to systemically and quantitatively assess the target network of drugs, evaluate drug toxicity, and identify new biomarkers for the diagnosis and treatment of important diseases such as cancer and Alzheimer’s disease.35–37 In this regard, we investigated the molecular targets of PLB in prostate cancer PC-3 and DU145 cells using a combination of bioinformatic, proteomic, and functional approaches with a focus on whether there were differences in the proteomic response between the two cell lines with regard to cell cycle, apoptosis, autophagy, and EMT pathways.
Figure 1.
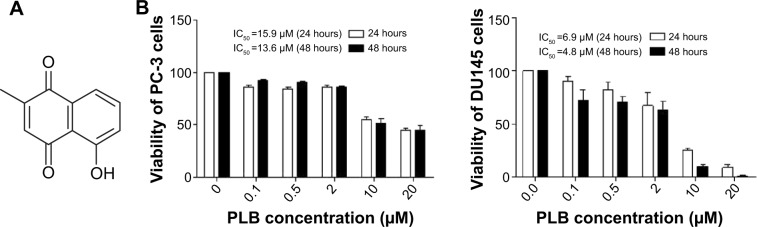
Chemical structure of PLB (5-hydroxy-2-methyl-1,4-naphthoquinone) and effect of PLB on cell viability in PC-3 and DU145 cells.
Notes: PC-3 and DU145 cells were treated with PLB at 0.1 to 20 μM for 24 or 48 hours. (A) Chemical structure of PLB, and (B) cell viability of PC-3 and DU145 cells. Data are the mean ± SD of three independent experiments.
Abbreviation: IC50, half maximal inhibitory concentration; PLB, plumbagin; SD, standard deviation.
Materials and methods
Prediction of the interactome of PLB and pathway analysis by molecular docking and bioinformatic approach
Protein targets were obtained from a third-party protein structure database named PDBBind.38 In this database, every ligand binding pocket is examined manually and hydrogen is added using Sybyl. According to the developer of PDBBind, the missing atoms were fixed and the amino acids residues with alternate location indicators were refined. There are a total of 1,780 Protein Data Bank (PDB) entries of human proteins available in PDBBind, and a total of 301 nonredundant PDBs corresponding to 353 ligand binding pockets were identified from it, 86% of which have resolutions of less than 2.5 Å. The docking boxes for each of the pockets were defined by expanding the circumscribed cube of the pocket with a margin of 8 Å in six directions (up, down, front, back, left, and right).
The 2D structure of the PLB was downloaded from PubChem. The hydrogen and Gasteiger charge were added and the file format was transformed into Mol2 using Vega ZZ. The docking program AutoDock 4.2 was used to dock the PLB molecule into all 353 pockets, generating a score vector of 353 dimensions. Z-scores were then calculated using the methodologies we applied before.39–41 Here, an empirical threshold of −0.6 of the Z-score was set to indicate that the binding of PLB towards this target was likely to be true.
The Database for Annotation, Visualization and Integrated Discovery (DAVID)42 was used to provide biological functional interpretation of the potential targets of PLB derived from molecular docking calculations. UniProtKB protein IDs of these targets were converted into gene lists by using the gene accession conversion tool in the DAVID database. The DAVID database adds biological function annotation (including gene ontology, pathway, and disease association) derived from some public data sources such as Gene Ontology terms (GOTERMS) or Kyoto Encyclopedia of Genes and Genomes (KEGG) pathways. Enrichment scores and Fisher’s exact test P-values (and corresponding false discovery rate [FDR]) were then calculated to identify which functional-related gene groups are significantly enriched in the target list. These significant enriched gene groups could explain the mechanism of action of PLB systematically.
Chemicals and reagents
Fetal bovine serum, PLB, dimethyl sulfoxide (DMSO), apocynin (Apo, 4′-hydroxy-3′-methoxyacetophenone, an inhibitor of nicotinamide adenine dinucleotide phosphate [NADPH] oxidase), thiazolyl blue tetrazolium bromide (MTT), Dulbecco’s phosphate buffered saline (PBS), 13C6-L-lysine, L-lysine, 13C6 15N4-L-arginine, and L-arginine were purchased from Sigma-Aldrich Co. (St Louis, MO, USA). Dulbecco’s Modified Eagle’s Medium and RPMI-1640 medium were bought from Coring Cellgro Inc. (Herndon, VA, USA). Sirtinol ([STL] a specific Sirt1 and Sirt2 inhibitor, (E)-2-((2-hydroxynaphthalen-1-yl)methyleneamino)-N-(1-phenylethyl)benzamide) was obtained from BioVision Inc. (Milpitas, CA, USA). Western blot substrate was purchased from Thermo Fisher Scientific (Waltham, MA, USA). The polyvinylidene difluoride membrane was bought from EMD Millipore (Billerica, MA, USA). Primary antibodies against human p21 Waf1/Cip1, p27 Kip1, p53, cyclin B1, cyclin D1, cyclin-dependent kinase 1 (CDK1/CDC2/CDKN1), cyclin-dependent kinase 2 (CDK2/CDKN2), cytochrome c, p38 mitogen-activated protein kinase (p38 MAPK), phosphorylated (p-) p38 MAPK at Thr180/Tyr182, AMPK, p-AMPK at Thr172, protein kinase B (Akt), p-Akt at Ser473, mTOR, p-mTOR at Ser2448, PI3K, p-PI3K/p85 at Tyr458, and EMT antibody sampler kit (No #9782) were all purchased from Cell Signaling Technology Inc. (Beverly, MA, USA). The EMT antibody sampler kit contains primary antibodies to N-cadherin, E-cadherin, zona occludens protein-1 (ZO-1), vimentin, slug, snail, zinc finger E-box-binding homeobox 1 (TCF8/ZEB1), and β-catenin. The antibody against human β-actin was obtained from Santa Cruz Biotechnology Inc. (Dallas, TX, USA).
Cell culture and treatment
Two human prostate cancer PC-3 and DU145 cell lines were purchased from the American Type Culture Collection (ATCC) (Manassas, VA, USA) and maintained in RPMI-1640 (PC-3 cells) and Dulbecco’s Modified Eagle’s Medium (DU145 cells) containing L-glutamine, phenol red, L-cysteine, L-methionine, sodium bicarbonate, and sodium pyruvate supplemented with 10% heat-inactivated fetal bovine serum at 37°C in a 5% CO2/95% air humidified incubator. Cells were seeded into the plates for 24 hours to achieve a confluence of ~80% prior to drug treatment. PLB was dissolved in DMSO with a stock concentration of 100 mM, and was freshly diluted to the indicated concentrations with culture medium with 0.05% (v/v) final concentration of DMSO.
Cell viability assay
The effect of PLB on the cell viability of PC-3 and DU145 cells was examined by MTT assay. Briefly, cells were seeded into a 96-well plate at a density of 8,000 cells/well and treated with PLB at 0.1–20 μM for 24 and 48 hours. After the treatment with PLB, the cells were incubated with 10 μL (5 mg/mL) MTT for 4 hours at 37°C. Cell viability was determined by reduction of MTT. The absorbance was measured using a Synergy H4 Hybrid microplate reader (BioTek Inc., Winooski, VT, USA) at a wavelength of 450 nm. The half maximal inhibitory concentration values were determined using the relative viability over PLB concentration curve.
Quantitative proteomic study using SILAC
Quantitative proteomic experiments were performed using SILAC as described previously.35,36,43 The protein quantitation kits for acidification, desalting, and digestion were purchased from Thermo Fisher Scientific. Briefly, PC-3 and DU145 cells were cultured in the medium with (heavy) or without (light) stable-isotope labeled amino acids (13C6 L-lysine and 13C6 15N4 L-arginine). PC-3 and DU145 cells were passaged five times by changing medium or splitting cells. Then, cells were treated with 5 μM PLB for 24 hours together with stable isotope-labeled amino acids. Following that, the cell samples were harvested and lysated with hot lysis buffer (100 mM Tris base, 4% sodium dodecyl sulfate (SDS), and 100 mM dithiothreitol). The protein was denatured at 95°C for 5 minutes and sonicated at 20% amplitude (AMPL) for 3 seconds with six pulses. After that, the samples were centrifuged at 15,000× g for 20 minutes and supernatant was collected in clean tubes. The protein concentration was determined using the Ionic Detergent Compatibility Reagent (Thermo Fisher Scientific). Subsequently, equal amounts of heavy and light protein sample were combined to reach a total volume of 30–60 μL containing 300–600 μg protein. The combined protein sample was digested using FASP™ protein digestion kit from Protein Discovery Inc. (Knoxville, TN, USA). After protein was digested, the resultant sample was acidified to a pH of 3 and desalted using a C18 solid-phase extraction column. The peptide mixtures were then analyzed using the hybrid linear ion trap–Orbitrap (LTQ Orbitrap XL; Thermo Fisher Scientific Inc.). The mass analysis of peptides was performed using a 10 cm-long 75 μm (inner diameter) reversed-phase column packed with 5 μm-diameter C18 material with 300 Å pore size (New Objective, Woburn, MA, USA) with a gradient mobile phase of 2%–40% acetonitrile in 0.1% formic acid at 200 μL/min for 125 minutes using liquid chromatography–tandem mass spectrometry (MS). The Orbitrap full MS scanning was performed at a mass (m/z)-resolving power of 60,000, with positive polarity in profile mode (M+H+). Peptide SILAC ratio was calculated using MaxQuant version 1.2.0.13. The SILAC ratio was determined by averaging all peptide SILAC ratios from peptides identified of the same protein. The protein IDs were identified using Scaffold 4.3.2 from Proteome Software Inc. (Portland, OR, USA) and the pathway was analyzed using Ingenuity Pathway Analysis (IPA) from QIAGEN (Redwood City, CA, USA).
Cell cycle distribution analysis
The effect of PLB on cell cycle of PC-3 and DU145 cells was determined using propidium iodide as the DNA stain by flow cytometry as described previously.44 Briefly, PC-3 and DU145 cells were treated with PLB at concentrations of 0.1, 1, 5, and 10 μM for 24 hours. In separate experiments, PC-3 and DU145 cells were treated with 5 μM PLB for 4, 8, 12, 24, 48, and 72 hours. Cells were trypsinized and fixed by 70% ethanol at −20°C overnight. The cells were stained using 50 μg/mL propidium iodide. A total number of 1×10⁴ cells was subject to cell cycle analysis using a flow cytometer (BD Biosciences, San Jose, CA, USA).
Western blotting analysis
PC-3 and DU145 cells were washed with PBS after 24 hours’ treatment with PLB at indicated concentrations, and lysed with the RIPA buffer containing protease inhibitor and phosphatase inhibitor cocktails. Protein concentrations were measured by bicinchoninic acid assay and denatured for 5 minutes at 95°C. A quota of protein (20 μg) was electrophoresed on 7%−12% sodium dodecyl sulfate polyacrylamide gel electrophoresis mini-gel and transferred onto methanol activated polyvinylidene difluoride membrane at 100 V for 2 hours at 4°C. Membranes were probed with indicated primary antibody overnight at 4°C and then blotted with the respective secondary antibody. Visualization was performed using BioRad system (Bio-Rad Laboratories Inc., Hercules, CA, USA). Protein level was normalized to the matching densitometric value of internal control.
Measurement of intracellular ROS levels
CM-H2DCFDA was used to measure intracellular levels of ROS according to the manufacturer’s instruction. Briefly, cells were seeded into 96-well plate (1×10⁴ cells/well) and treated with PLB at 0.1, 1, and 5 μM for 24 hours. Following that, the cells were incubated with 5 μM CM-H2DCFDA in PBS for 30 minutes at 37°C. In separate experiments, the intracellular ROS level was measured when cells were exposed to 5 μM PLB over 72 hours. Additionally, cells were pretreated with Apo (0.1 μM) for 1 hour with addition of 5 μM PLB followed by further incubation for 24 hours. The fluorescence intensity was detected at wavelengths of 485 nm (excitation) and 530 nm (emission).
Statistical analysis
Data are expressed as the mean ± standard deviation. Multiple comparisons were evaluated by one-way analysis of variance followed by Tukey’s multiple comparison. A value of P<0.05 was considered statistically significant.
Results
PLB likely interacts with a number of important functional proteins
Using Vega ZZ and AutoDock 4.2 programs, we examined the interactome of PLB. There were 78 proteins that possibly interacted with PLB, including those involved in cell proliferation and apoptosis (eg, SRC, JAK2, Akt, BRAF, CDKN2A, CLK1, AURKA, and MAPK1); nucleic acid biosynthesis and metabolism (eg, GATM, MGMT, ALDH1L1, DHFR, DHODH, TYMP, TPH1, and NNMT); carbohydrate metabolism (eg, GLA, GALE, PYGL, and PYGM); amino acid and protein metabolism (eg, ASS1, BCAT2, SDS, and METAP1); phospholipid and lipid metabolism (eg, PLA2G2A and PPARA); inflammation and immune response (eg, TNFA, MASP2, and MIF); steroid metabolism and transport (AKR1C1, 1C2 and 1C3, and SHBG); blood coagulation (eg, PROCR and F9); and signal transduction (eg, ESR1, GR, PGR, and JAK2) (see Figures 2–5; Table 1). The Z’-score values were −2.478, −2.276, −2.150, −2.084, and −2.081 for activated CD42 kinase 1, integrin-α-L, Janus kinase-2 (JAK2), tyrosyl-tRNA synthetase (YARS), and tryptophan 5-hydroxylase 1 (TPH1), respectively. PLB appeared to interact with several functional protein families or subfamilies, such as the nuclear receptors (AR, GR, PGR, RARA, RARB, RARG, RXRA, RXRB, PPARA, THRB, ESR1, and ESR2), AKRs (1C1, 1C2, and 1C3), ALDHs (5 and 7), and oncoproteins and kinases (ABL, AKT, BRAF, CDKN2A, CLK1, CSNK2A1, JAK2, PAK1, MAPK1, SRC, AURKA, RPS6KA1, and MAPKAPK2). The interaction between PLB and selected targets included H-bond formation, charge interaction, and π-π stacking with the involvement of a number of critical amino acid residues in the active site of targets (Table 2).
Figure 2.

Molecular interactions between PLB and selected predicted targets.
Notes: Protein structure identifications from PDB. ABL1 (ID: 1OPL); ACPP (ID: 1CVI); ADH7 (ID: 1D1T); and AKR1C1 (ID: 1IHI).
Abbreviations: ABL1, c-Abl oncogene 1; ACPP, prostate acid phosphatase; ADH7, alcohol dehydrogenase 5; AKR1C1, aldo–keto reductase family 1, member C1; PDB, Protein Data Bank; PLB, plumbagin.
Figure 5.

Molecular interactions between PLB and selected predicted targets.
Notes: Protein structure identifications from PDB. CLK1 (ID: 1Z57); CRABP2 (ID: 1CBS); and ESR1/NR3A1 (ID:1GWQ).
Abbreviations: CLK1, CDC-like kinase 1; CRABP2, cellular retinoic acid binding protein 2; ESR1/NR3A1, estrogen receptor-α; PDB, Protein Data Bank; PLB, plumbagin.
Table 1.
Predicted protein targets of PLB
| PDB ID | Protein target | Gene symbol | Molecular and biological function | Docking score | Z’-score |
|---|---|---|---|---|---|
| 1OPL | Proto-oncogene tyrosine-protein kinase ABL1 | ABL1 | Non-receptor tyrosine kinase that regulates key processes linked to cell growth and survival. Regulates cytoskeleton remodeling during cell differentiation, cell division, and cell adhesion. Localizes to dynamic actin structures, and phosphorylates CRK, CRKL, DOK1, and other proteins controlling cytoskeleton dynamics. Regulates DNA repair potentially by activating the proapoptotic pathway when the DNA damage is too severe to be repaired. Phosphorylates PSMA7 that leads to an inhibition of proteasomal activity and cell cycle transition blocks. | −29.6889 | −1.02112 |
| 1F8U | Acetylcholinesterase | ACHE | Terminates signal transduction at the neuromuscular junction by rapid hydrolysis of the acetylcholine released into the synaptic cleft. Role in neuronal apoptosis. | −30.5074 | −1.06074 |
| 1CVI | Prostatic acid phosphatase | ACPP | Catalyzes the conversion of orthophosphoric monoester to alcohol and orthophosphate. It is synthesized under androgen regulation and is secreted by the epithelial cells of the prostate gland. | −28.342 | −1.11964 |
| 1MC5_1 | Alcohol dehydrogenase class-3/alcohol dehydrogenase 5 | ADH5 | Remarkably ineffective in oxidizing ethanol, but it readily catalyzes the oxidation of long-chain primary alcohols and the oxidation of S-(hydroxymethyl) glutathione. | −29.9343 | −1.01848 |
| 1D1T | Alcohol dehydrogenase class 4 mu/sigma chain/alcohol dehydrogenase-7 | ADH7 | Could function in retinol oxidation for the synthesis of retinoic acid, a hormone important for cellular differentiation. Medium-chain (octanol) and aromatic (m-nitrobenzaldehyde) compounds are the best substrates. Ethanol is not a good substrate, but at the high ethanol concentrations reached in the digestive tract, it plays a role in the ethanol oxidation and contributes to the first-pass ethanol metabolism. | −30.8406 | −1.31692 |
| 1MRQ_1 | Aldo–keto reductase family 1 member C1 | AKR1C1 | Converts progesterone to its inactive form, 20α-dihydroxyprogesterone. In the liver and intestine, may have a role in the transport of bile. May have a role in monitoring the intrahepatic bile acid concentration. Has a low bile-binding ability. May play a role in myelin formation. | −33.8831 | −1.55345 |
| 1IHI_1 | Aldo–keto reductase family 1 member C2 | AKR1C2 | Works in concert with the 5α/5β-steroid reductases to convert steroid hormones into the 3α/5α and 3α/5β-tetrahydro steroids. Catalyzes the inactivation of the most potent androgen 5α-DHT to 5α-androstane-3-α,17-β-diol (3-α-diol). Has a high bile-binding ability. | −32.6523 | −1.3802 |
| 1XF0_1 | Aldo–keto reductase family 1 member C3 | AKR1C3 | Catalyzes the conversion of aldehydes and ketones to alcohols. Catalyzes the reduction of PGD2, PGH2, and PQ and the oxidation of 9-α,11-β-PGF2 to PGD2. Functions as a bidirectional 3-α-, 17-β-, and 20-α HSD. Can interconvert active androgens, estrogens, and progestins with their cognate inactive metabolites. Preferentially transforms androstenedione (4-dione) to testosterone. | −31.7713 | −0.89119 |
| 3CQW | RAC-α serine/threonine-protein kinase | AKT1/AKT | Plays a role as a key modulator of the AKT/mTOR signaling pathway controlling the tempo of the process of newborn neurons’ integration during adult neurogenesis, including correct neuron positioning, dendritic development, and synapse formation. General protein kinase capable of phosphorylating several known proteins. Phosphorylates TBC1D4. Signals downstream of phosphatidylinositol 3-kinase to mediate the effects of various growth factors such as platelet-derived growth factor, epidermal growth factor, insulin, and insulin-like growth factor I. Plays a role in glucose transport by mediating insulin-induced translocation of the GLUT4 glucose transporter to the cell surface. Mediates the antiapoptotic effects of insulin-like growth factor I. Mediates insulin-stimulated protein synthesis by phosphorylating TSC2 at Ser939 and Thr1462, thereby activating mTORC1 signaling and leading to both phosphorylation of 4E-BP1 and inactivation of RPS6KB1. Promotes glycogen synthesis by mediating the insulin-induced activation of glycogen synthase. | −29.4085 | −0.69225 |
| 2CFI | 10-Formyltetrahydrofolate dehydrogenase/aldehyde dehydrogenase 1 family, member L1 | ALDH1L1 | Catalyzes the conversion of 10-formyltetrahydrofolate, nicotinamide adenine dinucleotide phosphate, and water to tetrahydrofolate, NADPH, and carbon dioxide. Loss of function is associated with decreased apoptosis, increased cell motility, and cancer progression. | −33.6305 | −1.33666 |
| 1E3G | Androgen receptor | AR/NR3C4 | Ligand-activated transcription factors that regulate eukaryotic gene expression and affect cellular proliferation and differentiation in target tissues. Transcription factor activity is modulated by bound coactivator and corepressor proteins. | −37.3977 | −1.27842 |
| 2NZ2 | Argininosuccinate synthase | ASS1 | Catalyzes the penultimate step of the arginine biosynthetic pathway. Mutations in the chromosome 9 copy of this gene cause citrullinemia. | −31.9402 | −1.21218 |
| 1MUO | Serine/threonine-protein kinase 6 (aurora kinase A) | AURKA | Contributes to the regulation of cell cycle progression. Required for normal mitosis. Associates with the centrosome and the spindle microtubules during mitosis and functions in centrosome maturation, spindle assembly, maintenance of spindle bipolarity, centrosome separation, and mitotic checkpoint control. Phosphorylates numerous target proteins, including ARHGEF2, BRCA1, KIF2A, NDEL1, PARD3, PLK1, and BORA. Regulates KIF2A tubulin depolymerase activity. Required for normal axon formation. Plays a role in microtubule remodeling during neurite extension. Important for microtubule formation and/or stabilization. | −28.2549 | −1.02801 |
| 1KTA | Branched-chain amino acid aminotransferase, mitochondrial | BCAT2 | Catalyzes the first reaction in the catabolism of the essential branched-chain amino acids leucine, isoleucine, and valine. May also α function as a transporter of branched-chain α-keto acids. | −30.6742 | −1.15167 |
| 1M4U | Bone morphogenetic protein 7 | BMP7 | Induces cartilage and bone formation. May be the osteoinductive factor responsible for the phenomenon of epithelial osteogenesis. Plays a role in calcium regulation and bone homeostasis. | −25.3367 | −1.2551 |
| 1UWJ | B-Raf proto-oncogene serine/threonine-protein kinase | BRAF | Involved in the transduction of mitogenic signals from the cell membrane to the nucleus. May play a role in the postsynaptic responses of hippocampal neuron. | −31.2198 | −1.6682 |
| 1G54 | Carbonic anhydrase 4 | CA4 | Reversible hydration of carbon dioxide. May stimulate the sodium/bicarbonate transporter activity of SLC4A4. | −29.5529 | −1.66738 |
| 1OIQ | Cell division protein kinase 2 | CDKN2A | Involved in the control of the cell cycle. Interacts with cyclins A, B1, B3, D, or E. Activity of CDK2 is maximal during S phase and G2 | −27.8137 | −1.14124 |
| 1Z57 | Dual-specificity protein kinase CLK1/CDC-like kinase 1 | CLK1 | Phosphorylates serine- and arginine-rich proteins of the spliceosomal complex; may be a constituent of a network of regulatory mechanisms that enable serine- and arginine-rich proteins to control RNA splicing. Phosphorylates serine, threonine and tyrosine. | −31.366 | −1.30272 |
| 1CBS | Cellular retinoic acid-binding protein 2 | CRABP2 | Transports retinoic acid to the nucleus; regulates the access of retinoic acid to the nuclear retinoic acid receptors. | −29.0128 | −0.71732 |
| 1JWH | Casein kinase II subunit α | CSNK2A1 | Casein kinases are operationally defined by their preferential utilization of acidic proteins such as caseins as substrates. The α and α’ chains contain the catalytic site. Participates in Wnt signaling. CK2 phosphorylates Ser392 of p53/TP53 following UV irradiation. | −29.9356 | −1.43896 |
| 1BOZ | Dihydrofolate reductase | DHFR | Catalyzes an essential reaction for de novo glycine and purine synthesis, and for DNA precursor synthesis. | −29.5402 | −0.84524 |
| 1D3H_2 | Dihydroorotate dehydrogenase, mitochondrial | DHODH | Catalyzes the fourth enzymatic step, the ubiquinone-mediated oxidation of dihydroorotate to orotate, in de novo pyrimidine biosynthesis. | −29.4508 | −0.75461 |
| 1GWQ | Estrogen receptor | ESR1/NR3A1 | Involved in the regulation of eukaryotic gene expression and affects cellular proliferation and differentiation in target tissues. Can activate the transcriptional activity of TFF1. | −29.2912 | −0.84876 |
| 1QKM | Estrogen receptor-β | ESR2/NR3A2 | Nuclear receptor. Binds estrogens with an affinity similar to that of ESR1, and activates expression of reporter genes containing EREs in an estrogen-dependent manner. Isoform β-cx lacks ligand binding ability and has no or only very low ERE binding activity resulting in the loss of ligand-dependent transactivation ability. DNA binding by ESR1 and ESR2 is rapidly lost at 37°C in the absence of ligand, while in the presence of 17β-estradiol and 4-hydroxy-tamoxifen loss in DNA binding at elevated temperature is more gradual. | −30.3825 | −1.21536 |
| 1RFN | Coagulation factor IX | F9 | Factor IX is a vitamin K-dependent plasma protein that participates in the intrinsic pathway of blood coagulation by converting factor X to its active form in the presence of Ca2+ ions, phospholipids, and factor VIIIa. | −30.6835 | −1.68228 |
| 1EK5 | UDP-glucose 4-epimerase | GALE | Catalyzes two distinct but analogous reactions: the epimerization of UDP-glucose to UDP-galactose and the epimerization of UDP-N-acetylglucosamine to UDP-N-acetylgalactosamine. | −31.3478 | −0.71433 |
| 3JDW | Glycine amidinotransferase | GATM | Catalyzes the biosynthesis of guanidinoacetate, the immediate precursor of creatine. Creatine plays a vital role in energy metabolism in muscle tissues. May play a role in embryonic and central nervous system development. May be involved in the response to heart failure by elevating local creatine synthesis. | −28.7166 | −0.90147 |
| 1R47 | α-galactosidase A | GLA/GALA | Hydrolyses the terminal α-galactosyl moieties from glycolipids and glycoproteins; predominantly hydrolyzes ceramide trihexoside; catalyzes the hydrolysis of melibiose into galactose and glucose. Mutations of this gene cause Fabry disease, a rare lysosomal storage disorder. | −27.6865 | −0.62858 |
| 1NHZ | Glucocorticoid receptor | GR/NR3C1 | Has a dual mode of action: as a transcription factor that binds to glucocorticoid response elements and as a modulator of other transcription factors. Affects inflammatory responses, cellular proliferation, and differentiation in target tissues. Could act as a coactivator for STAT5-dependent transcription upon growth hormone stimulation and could reveal an essential role of hepatic GR in the control of body growth. Involved in chromatin remodeling. Plays a significant role in transactivation. Involved in nuclear translocation. | −28.5176 | −0.8712 |
| 2ZNT | Glutamate receptor, ionotropic kainate 1 | GRIK3 | Ionotropic glutamate receptor. L-glutamate acts as an excitatory neurotransmitter at many synapses in the central nervous system. Binding of the excitatory neurotransmitter L-glutamate induces a conformation change, leading to the opening of the cation channel, and thereby converts the chemical signal to an electrical impulse. The receptor then desensitizes rapidly and enters a transient inactive state, characterized by the presence of bound agonist. May be involved in the transmission of light information from the retina to the hypothalamus. | −33.5431 | −1.31118 |
| 1J1B | Glycogen synthase kinase-3β | GSK3B | Participates in the Wnt signaling pathway. Implicated in the hormonal control of several regulatory proteins including glycogen synthase, MYB, and the transcription factor JUN. Phosphorylates JUN at sites proximal to its DNA-binding domain, thereby reducing its affinity for DNA. Phosphorylates MUC1 in breast cancer cells, and decreases the interaction of MUC1 with CTNNB1/β-catenin. Phosphorylates CTNNB1/β-catenin and SNAI1. | −29.0253 | −0.69952 |
| 2HGS_1 | Glutathione synthetase | GSS | Glutathione is important for a variety of biological functions, including protection of cells from oxidative damage by free radicals, detoxification of xenobiotics, and membrane transport. The protein encoded by this gene functions as a homodimer to catalyze the second step of glutathione biosynthesis, which is the ATP-dependent conversion of γ-L-glutamyl-L-cysteine to glutathione. Defects in this gene are a cause of glutathione synthetase deficiency. | −31.6788 | −0.95445 |
| 2B7A | Janus kinase 2 | JAK2 | Non-receptor tyrosine kinase involved in various processes such as cell cycle progression, apoptosis, mitotic recombination, genetic instability, and histone modifications. In the cytoplasm, plays a pivotal role in signal transduction via its association with cytokine receptors, which constitutes an initiating step in signaling for many members of the cytokine receptor superfamily including the receptors for growth hormone, prolactin, leptin, erythropoietin, granulocyte-macrophage colony-stimulating factor, thrombopoietin, and multiple interleukins. Following stimulation with erythropoietin during erythropoiesis, it is autophosphorylated and activated, leading to its association with EPOR and tyrosine phosphorylation of residues in the EPOR cytoplasmic domain. Also involved in promoting the localization of EPOR to the plasma membrane. Also acts downstream of some G-protein coupled receptors. Plays a role in the control of body weight. In the nucleus, plays a key role in chromatin by specifically mediating phosphorylation of Tyr41 of histone H3, a specific tag that promotes exclusion of CBX5 (HP1α) | −30.6271 | −2.15016 |
| 1TVO | MAPK1 | MAPK1/ERK | Involved in both the initiation and regulation of meiosis, mitosis, and postmitotic functions in differentiated cells by phosphorylating a number of transcription factors such as ELK1. Phosphorylates EIF4EBP1; required for initiation of translation. Phosphorylates microtubule-associated protein 2. Phosphorylates SPZ1. Phosphorylates heat shock factor protein 4 and ARHGEF2. Acts as a transcriptional repressor. Binds to a[GC]AAA[GC] consensus sequence. Represses the expression of interferon-γ-induced genes. Seems to bind to the promoter of CCL5, DMP1, IFIH1, IFITM1, IRF7, IRF9, LAMP3, OAS1, OAS2, OAS3, and STAT1. | −28.8258 | −0.7549 |
| 1JNK | MAPK10 | MAPK10/JNK3 | Responds to activation by environmental stress and proinflammatory cytokines by phosphorylating a number of transcription factors, primarily components of AP-1 such as c-Jun and ATF2 and thus regulates AP-1 transcriptional activity. Required for stress-induced neuronal apoptosis and the pathogenesis of glutamate excitotoxicity. | −29.9606 | −1.32774 |
| 1NY3 | MAPK-activated protein kinase 2 | MAPKAPK2 | Its physiological substrate seems to be the small heat shock protein (HSP27/HSP25). In vitro can phosphorylate glycogen synthase at Ser7 and tyrosine hydroxylase (on Ser19 and Ser40). This kinase phosphorylates Ser in the peptide sequence, Hyd-X-R-X2 -S, where Hyd is a large hydrophobic residue. Mediates both Erk- and p38 MAPK/MAPK14-dependent neutrophil responses. Participates in TNF-α-stimulated exocytosis of secretory vesicles in neutrophils. Plays a role in phagocytosis-induced respiratory burst activity. | −29.8267 | −1.55836 |
| 1ZJK | Mannan-binding lectin serine protease 2 | MASP2 | Serum protease that plays an important role in the activation of the complement system via mannose-binding lectin. After activation by autocatalytic cleavage, it cleaves C2 and C4, leading to their activation and to the formation of C3 convertase. | −25.8813 | −1.18935 |
| 2DFD | Malate dehydrogenase, mitochondrial | MDH2 | Catalyzes the reversible oxidation of malate to oxaloacetate, utilizing the NAD/NADH cofactor system in the citric acid cycle. The protein encoded by this gene is localized to the mitochondria and may play pivotal roles in the malate-aspartate shuttle that operates in the metabolic coordination between cytosol and mitochondria. | −29.8464 | −0.69687 |
| 2B3K | Methionine aminopeptidase 1 | METAP1 | Removes the amino-terminal methionine from nascent proteins. Required for normal progression through the cell cycle. | −30.3432 | −1.37161 |
| 1EH8 | Methylated-DNA – protein-cysteine methyltransferase | MGMT | Involved in the cellular defense against the biological effects of O6-methylguanine in DNA. Repairs alkylated guanine in DNA by stoichiometrically transferring the alkyl group at the O6 position to a cysteine residue in the enzyme. This is a suicide reaction: the enzyme is irreversibly inactivated. | −27.4524 | −1.20465 |
| 1GCZ | Macrophage migration inhibitory | MIF | Proinflammatory cytokine. Involved in the innate immune response to bacterial pathogens. The expression of MIF at sites of inflammation suggests a role as mediator in regulating the function of macrophages in host defense. Counteracts the anti-inflammatory activity of glucocorticoids. Has phenylpyruvate tautomerase and dopachrome tautomerase activity, but the physiological substrate is unknown. | −27.1849 | −1.4819 |
| 1QIA | Stromelysin-1/matrix metallopeptidase 3 | MMP3 | Can degrade fibronectin, laminin, and gelatins of type I, III, IV, and V; and collagens III, IV, IX, and X, and cartilage proteoglycans. Activates procollagenase. | −29.935 | −0.6127 |
| 2IIP | Nicotinamide N-methyltransferase | NNMT | Catalyzes the N-methylation of nicotinamide and other pyridines to form pyridinium ions. This activity is important for biotransformation of many drugs and xenobiotic compounds. | −30.3551 | −0.70499 |
| 1PT9 | NAD(P) transhydrogenase, mitochondrial | NNT | The transhydrogenation between NADH and NADP is coupled to respiration and ATP hydrolysis and functions as a proton pump across the membrane. | −29.3546 | −0.62555 |
| 1OTH | Ornithine carbamoyltransferase, mitochondrial | OTC | A mitochondrial matrix enzyme. Missense, nonsense, and frameshift mutations in this enzyme lead to ornithine transcarbamylase deficiency, which causes hyperammonemia. May play a role in Duchenne muscular dystrophy. | −28.6524 | −0.75116 |
| 1TG2 | Phenylalanine-4-hydroxylase | PAH | Catalyzes phenylalanine hydroxylation, which is the rate-limiting step in phenylalanine catabolism. Deficiency of this enzyme activity results in the autosomal recessive disorder phenylketonuria. | −31.4902 | −0.8316 |
| 1U54 | CDC42/p21 activated kinase 1 | PAK1 | Downstream effector of CDC42 which mediates CDC42-dependent cell migration via phosphorylation of BCAR1. Binds to both poly- and monoubiquitin and regulates ligand-induced degradation of EGFR. Participates in clathrin-mediated endocytosis. May be involved both in adult synaptic function and plasticity and in brain development. | −28.6572 | −2.47751 |
| 1WOK | Poly (ADP-ribose) polymerase 1 | PARP1 | Involved in the base excision repair pathway by catalyzing the poly (ADP-ribosyl) ation of a limited number of acceptor proteins involved in chromatin architecture and in DNA metabolism. This modification follows DNA damages and appears as an obligatory step in a detection/signaling pathway leading to the reparation of DNA strand breaks. Mediates the poly (ADP-ribosyl) ation of APLF and CHFR. Positively regulates the transcription of MTUS1 and negatively regulates the transcription of MTUS2/TIP150. | −32.0029 | −0.97365 |
| 1NI4 | Pyruvate dehydrogenase E1 component subunit β mitochondrial | PDHB | The pyruvate dehydrogenase complex catalyzes the overall conversion of pyruvate to acetyl-CoA and CO2. It contains multiple copies of three enzymatic components: pyruvate dehydrogenase, dihydrolipoamide acetyltransferase, and lipoamide dehydrogenase. | −29.0795 | −1.65842 |
| 1ZUC | Progesterone receptor | PGR/NR3C3 | Involved in the regulation of eukaryotic gene expression and affects cellular proliferation and differentiation in target tissues. Progesterone receptor isoform B is involved in activation of c-SRC/MAPK signaling on hormone stimulation, but isoform A is inactive in stimulating c-Src/MAPK signaling on hormone stimulation. | −29.5457 | −0.792 |
| 1SQN | Progesterone receptor | PGR/NR3C3 | Involved in the regulation of eukaryotic gene expression and affect cellular proliferation and differentiation in target tissues. Progesterone receptor isoform B is involved in activation of c-SRC/MAPK signaling on hormone stimulation, but isoform A is inactive in stimulating c-Src/MAPK signaling on hormone stimulation. | −30.4747 | −0.77765 |
| 1DB4 | Phospholipase A2, membrane associated | PLA2G2A | Thought to participate in the regulation of the phospholipid metabolism in membranes including eicosanoid biosynthesis; catalyzes the calcium-dependent hydrolysis of the 2-acyl groups in 3-sn-phosphoglycerides. | −27.8998 | −0.67788 |
| 1B1C | NADPH–cytochrome P450 reductase | POR | This enzyme is required for electron transfer from NADP to cytochrome P450 in microsomes. It can also provide electron transfer to heme oxygenase and cytochrome b5 | −30.8935 | −1.33385 |
| 2P54 | Peroxisome proliferator-activated receptor-α | PPARA/NR1C1 | Ligand-activated transcription factor. Key regulator of lipid metabolism. Activated by the endogenous ligand 1-palmitoyl-2-oleoyl-sn-glycerol-3-phosphocholine (16:0/18:1-GPC). Activated by oleoylethanolamide, a naturally occurring lipid that regulates satiety. Receptor for peroxisome proliferators such as hypolipidemic drugs and fatty acids. Once activated by a ligand, the receptor binds to promoter elements of target genes. Regulates the peroxisomal β-oxidation pathway of fatty acids. Functions as transcription activator for the acyl-CoA oxidase gene. Transactivation activity is antagonized by NR2C2/TAK1. | −28.1316 | −0.95585 |
| 1LQV | Endothelial protein C receptor | PROCR | Binds activated protein C; enhances protein C activation by the thrombin–thrombomodulin complex; plays a role in the protein C pathway controlling blood coagulation. | −27.5302 | −0.83581 |
| 1L7X_1 | Glycogen phosphorylase, liver form | PYGL | An important allosteric enzyme involved in carbohydrate metabolism. | −31.1049 | −0.65468 |
| 1Z8D_2 | Glycogen phosphorylase, muscle form | PYGM | An important allosteric enzyme in carbohydrate metabolism. | −32.3638 | −0.86479 |
| 1Z8D_1 | Glycogen phosphorylase, muscle form | PYGM | An important allosteric enzyme in carbohydrate metabolism. | −31.4966 | −0.79743 |
| 1E96 | Ras-related C3 botulinum toxin substrate 1 | RAC1 | Plasma membrane-associated small GTPase which cycles between active GTP-bound and inactive GDP-bound states. In its active state, binds to a variety of effector proteins to regulate cellular responses such as secretory processes, phagocytosis of apoptotic cells, epithelial cell polarization, and growth-factor-induced formation of membrane ruffles. Isoform B has an accelerated GEF-independent GDP/GTP exchange and an impaired GTP hydrolysis, which is restored partially by GTPase-activating proteins. It is able to bind to the GTPase-binding domain of PAK but not full-length PAK in a GTP-dependent manner, suggesting that the insertion does not completely abolish effector interaction. | −27.1682 | −0.85255 |
| 1DKF | Retinoic acid receptor-α | RARA/NR1B1 | This is a receptor for retinoic acid. Retinoic acid has profound effects on vertebrate development, is a morphogen, and is a powerful teratogen. This receptor controls cell function by directly regulating gene expression. Regulates expression of target genes in a ligand-dependent manner by recruiting chromatin complexes containing MLL5. Mediates retinoic acid-induced granulopoiesis. | −29.6736 | −0.89133 |
| 1XAP | Retinoic acid receptor-β | RARB/NR1B2 | A nuclear receptor binding retinoic acid that has profound effects on vertebrate development. | −27.0574 | −0.64831 |
| 1EXX | Retinoic acid receptor-γ | RARG/NR1B3 | This is a receptor for retinoic acid. This metabolite has profound effects on vertebrate development. Retinoic acid is a morphogen and is a powerful teratogen. | −29.4941 | −1.4291 |
| 1FCZ | Retinoic acid receptor-γ | RARG/NR1B3 | A nuclear receptor for retinoic acid that has profound effects on vertebrate development. Retinoic acid is a morphogen and is a powerful teratogen. | −28.7291 | −0.95127 |
| 1QAB | Retinol-binding protein 4 | RBP4 | Delivers retinol from the liver stores to the peripheral tissues. In plasma, the RBP–retinol complex interacts with transthyretin; this prevents its loss by filtration through the kidney glomeruli. | −30.2192 | −1.27765 |
| 2Z7R | Ribosomal protein S6 kinase α-1 | RPS6KA1 | Serine/threonine kinase that may play a role in mediating the growth factor- and stress-induced activation of the transcription factor CREB. | −28.4728 | −0.88626 |
| 1MVC | Retinoic acid receptor RXR-α | RXRA/NR2B1 | A nuclear receptor involved in the retinoic acid response pathway. Binds 9-cis-retinoic acid. | −27.1395 | −0.68618 |
| 1UHL_1 | Retinoic acid receptor RXR-β | RXRB/NR2B2 | Nuclear receptor involved in the retinoic acid response pathway. Binds 9-cis-retinoic acid. | −29.0851 | −0.96647 |
| 1P5J | L-serine dehydratase | SDS | Converts L-serine to pyruvate and ammonia and requires pyridoxal phosphate as a cofactor. The encoded protein can also metabolize threonine to NH4+ and 2-ketobutyrate. | −31.6342 | −1.29486 |
| 1A7C_2 | Plasminogen activator inhibitor 1/serpin peptidase inhibitor, clade E | SERPINE1 | This inhibitor acts as “bait” for tissue plasminogen activator, urokinase, and protein C. Its rapid interaction with TPA may function as a major control point in the regulation of fibrinolysis. | −30.616 | −1.53161 |
| 1A7C_1 | Plasminogen activator inhibitor 1 | SERPINE1 | This inhibitor acts as “bait” for tissue plasminogen activator, urokinase, and protein C. Its rapid interaction with TPA may function as a major control point in the regulation of fibrinolysis. | −31.43 | −1.06494 |
| 1F5F | Sex hormone-binding globulin | SHBG | Functions as an androgen transport protein, but may also be involved in receptor-mediated processes. Each dimer binds one molecule of steroid. Specific for 5-α-dihydrotestosterone, testosterone, and 17-β-estradiol. Regulates the plasma metabolic clearance rate of steroid hormones by controlling their plasma concentration. | −30.9243 | −0.70607 |
| 1YOL | Proto-oncogene tyrosine-protein kinase Src | SRC | May play a role in the regulation of embryonic development and cell growth. Its activity can be inhibited by c-SRC kinase-mediated phosphorylation. Mutations in this gene could be involved in the malignant progression of colon cancer. | −26.2819 | −0.67574 |
| 1Q1Z | Sulfotransferase family cytosolic 2B member 1 | SULT2B1 | Catalyzes the sulfate conjugation of many hormones, neurotransmitters, drugs, and xenobiotic compounds. Sulfates hydroxysteroids like DHEA. Isoform 1 preferentially sulfonates cholesterol, and isoform 2 avidly sulfonates pregnenolone but not cholesterol. | −29.977 | −1.15111 |
| 1NAX | Thyroid hormone receptor-β | THRB/NR1A2 | High-affinity receptor for triiodothyronine. Mutations in this gene are known to be a cause of generalized thyroid hormone resistance, a syndrome characterized by goiter and high levels of circulating thyroid hormone (T3–T4), with normal or slightly elevated thyroid stimulating hormone. | −28.4322 | −0.60455 |
| 1A8M | Tumor necrosis factor-α | TNFA/TNF | Cytokine that binds to TNFRSF1A/TNFR1 and TNFRSF1B/TNFBR. It is mainly secreted by macrophages and can induce cell death of certain tumor cell lines. It is a potent pyrogen causing fever by direct action or by stimulation of interleukin-1 secretion and is implicated in the induction of cachexia. Under certain conditions it can stimulate cell proliferation and induce cell differentiation. | −31.0431 | −0.65976 |
| 1MLW | Tryptophan 5-hydroxylase 1 | TPH1 | A member of the aromatic amino acid hydroxylase family. The encoded protein catalyzes the first and rate-limiting step in the biosynthesis of serotonin, an important hormone and neurotransmitter. Mutations in this gene have been associated with an elevated risk for a variety of diseases and disorders, including schizophrenia, somatic anxiety, anger-related traits, bipolar disorder, suicidal behavior, addictions, and others. | −34.3634 | −2.08069 |
| 2H11 | Thiopurine S-methyltransferase | TPMT | Catalyzes the S-methylation of thiopurine drugs such as 6-mercaptopurine. | −29.2844 | −0.77004 |
| 1OIZ | α-tocopherol transfer protein | TTPA | Binds α-tocopherol and enhances its transfer between membranes. | −27.3985 | −0.64683 |
| 1UOU | Thymidine phosphorylase | TYMP | May have a role in maintaining the integrity of the blood vessels. Has growth-promoting activity on endothelial cells, angiogenic activity in vivo, and chemotactic activity on endothelial cells in vitro. Catalyzes the reversible phosphorolysis of thymidine. The produced molecules are then utilized as carbon and energy sources or in the rescue of pyrimidine bases for nucleotide synthesis. | −31.8117 | −0.98915 |
| 1R6T | Tryptophanyl-tRNA synthetase, cytoplasmic | WARS | Isoform 1, isoform 2, and T1-TrpRS have aminoacylation activity while T2-TrpRS lacks it. Isoform 2, T1-TrpRS, and T2-TrpRS possess angiostatic activity whereas isoform 1 lacks it. T2-TrpRS inhibits fluid shear stress-activated responses of endothelial cells. Regulates ERK, Akt, and eNOS activation pathways that are associated with angiogenesis, cytoskeletal reorganization, and shear stress-responsive gene expression. | −34.3616 | −1.55099 |
| 1Q11 | Tyrosyl-tRNA synthetase | YARS | Catalyzes the attachment of tyrosine to tRNA Tyr in a two-step reaction: tyrosine is first activated by ATP to form Tyr-AMP and then transferred to the acceptor end of tRNA Tyr. | −32.9796 | −2.08471 |
Abbreviations: 4E-BP1, 4E binding protein 1; 5α-DHT, 5α-dihydrotestosterone; ADH, alcohol dehydrogenase; AKR, aldo-keto reductase; Akt1, v-Akt murine thymoma viral oncogene homolog 1; ALDH, aldehyde dehydrogenase; APLF, aprataxin and PNKP-like factor; ARHGEF2, Rho/Rac guanine nucleotide exchange factor (GEF) 2; AP-1, activating protein-1; ATF2, activating transcription factor 2; AURKA, aurora kinase A; BORA, aurora kinase A activator; BRCA1, BRCA1/BRCA2-containing complex, subunit 1; CBX5, chromobox homolog 5; CCL5, chemokine (C-C motif) ligand 5; CDC42, cell division cycle 42; CDK2, cyclin-dependent kinase 2; CHFR, checkpoint with forkhead and RING finger domains; CRK, v-Crk avian sarcoma virus CT10 oncogene homolog; CRKL, v-Crk avian sarcoma virus CT10 oncogene homolog-like; DHEA, dehydroepiandrosterone; DMP1, dentin matrix acidic phosphoprotein 1; DOK1, docking protein 1; EIF4EBP1, eukaryotic translation initiation factor 4E binding protein 1; ELK1, ETS domain-containing protein Elk-1; eNOS, endothelial nitric oxide synthase; EPOR, erythropoietin receptor; ERE, estrogen response element; ERK, extracellular signal-regulated kinase; ESR, estrogen receptor; GLUT4, glucose transporter type 4; GR, glucocorticoid receptor; HSD, hydroxysteroid dehydrogenase; HSP, heat shock protein; ICAM, intercellular adhesion molecule; ID, identification; IFITM1, interferon-induced transmembrane protein 1; IFIH1, interferon-induced helicase C domain 1; IRF, interferon regulatory factor; RPS6KB1, ribosomal protein S6 kinase, polypeptide 1; JUN, Jun proto-oncogene; KIF2A, kinesin heavy-chain member 2A; LAMP3, lysosomal-associated membrane protein 3; MYB, v-myb avian myeloblastosis viral oncogene homolog; MLL5, mixed lineage leukemia 5; MRPP, mitochondrial ribonuclease P; mTOR, mammalian target of rapamycin; MUC1, mucin 1; MAPK, mitogen-activated protein kinase; NDEL1, nudE neurodevelopment protein 1-like 1; OAS, 2′-5′-oligoadenylate synthetase; PAK, p21 protein (Cdc42/Rac)-activated kinase; PARD3, par-3 family cell polarity regulator; PDB, Protein Data Bank; PGH2, prostaglandin H2; PLB, plumbagin; PLK1, polo-like kinase 1; PQ, phenanthrenequinone; SLC4A4, solute carrier family 4, member 4; SNAI1, snail family zinc finger 1; SPZ1, spermatogenic leucine zipper 1; STAT1, signal transducer and activator of transcription 1; TBC1D4, TBC1 domain family, member 4; TFF1, trefoil factor 1; TNFR, tumor necrosis factor receptor; TPA, tissue plasminogen activator; TPMT, thiopurine S-methyltransferase; TSC2, tuberous sclerosis 2; UDP, uridine diphosphate; UV, ultraviolet; YARS, tyrosyl-tRNA synthetase.
Table 2.
Molecular interactions of PLB with selected potential target proteins
| Target protein | PDB ID | CDOCKER interaction energy (CIE kcal/mol) | H-bond number | Residues involved in H-bond formation | Charge interactions | Residues involved in charge interactions | π-π stacking | Residues involved in π-π stacking |
|---|---|---|---|---|---|---|---|---|
| ABL1 | 1OPL | 18.9346 | 1 | O-Asn316 | 0 | – | 0 | – |
| ACPP | 1CVI | 26.6927 | 3 | O-Arg4011, O-Tyr4178, O-Tyr4278 | 0 | – | 1 | Tyr4182 |
| ADH5 | 1M6H | 18.8434 | 0 | – | 0 | – | 0 | – |
| ADH7 | 1D1T | 22.8913 | 0 | – | 0 | – | 1 | Phe93 |
| AKR1C1 | 1IHI | 24.3975 | 1 | O-Gln | 1 | Lys84 | 1 | Tyr216 |
| AKR1C3 | 1YRO | 25.8425 | 1 | O-Asn128 | 0 | – | 0 | – |
| Akt1/Akt | 3CQW | 24.9918 | 0 | – | 0 | – | 0 | – |
| ALDH1L1 | 1S3I | 26.7855 | 1 | O-His106 | 0 | – | 0 | – |
| AR/NR3C4 | 1E3G | 28.3581 | 0 | – | 0 | – | 0 | – |
| ASS1 | 2NZ2 | 19.5889 | 1 | O-Lys176 | 0 | – | 0 | – |
| AURKA | 1MUO | 24.3512 | 3 | O-Lys141, O-Arg220, O-Trp277 | 0 | – | 0 | – |
| BCAT2 | 1KTA | 25.82 | 3 | H-Ala314, O-Lys79, O-Gln316 | 0 | – | 0 | – |
| BMP7 | 1M4U | 19.8572 | 0 | – | 0 | – | 0 | – |
| BRAF | 1UWJ | 23.1585 | 0 | – | 0 | – | 0 | – |
| CA4 | 1G54 | 27.6704 | 1 | O-His96 | 0 | – | 0 | – |
| CDKN2A | 1OIQ | 31.8477 | 2 | H-Asp145, O-Lys33 | 0 | – | 0 | – |
| CLK1 | 1Z57 | 29.7806 | 1 | O-Lys191 | 0 | – | 0 | – |
| CRABP2 | 1CBS | 25.3587 | 2 | O-Arg55, O-Arg111 | 0 | – | 0 | – |
| ESR1/NR3A1 | 1GWQ | 26.8968 | 1 | H-Leu346 | 0 | – | 0 | – |
| ESR2/NR3A2 | 1QKM | 28.2648 | 0 | – | 0 | – | 0 | – |
Abbreviations: ABL1, c-abl oncogene 1; ACPP, prostate acid phosphatase; ADH, alcohol dehydrogenase; AKR, aldo–keto reductase; Akt, v-Akt murine thymoma viral oncogene homolog; ALDH, aldehyde dehydrogenase; AR, androgen receptor; ASS, argininosuccinate synthase; AURKA, aurora kinase A; BCAT, mitochondrial branched-chain amino-acid transaminase; BMP, bone morphogenetic protein; BRAF, v-Raf murine sarcoma viral oncogene homolog B; CA, carbonic anhydrase; CDKN, cyclin-dependent kinase inhibitor; CLK, CDC-like kinase; CRABP, cellular retinoic acid binding protein; ESR, estrogen receptor; ID, identification; PDB, Protein Data Bank; PLB, plumbagin.
As shown in Table 3, ten functional clusters were identified to be significantly enriched (enrichment score >3) in the target list derived from molecular docking calculations. The cluster 2 is NADPH oxidation and reduction. It has been proved that PLB could bind to Nox-4, a renal NADPH oxidase, and inhibit its activity. Cluster 6, the regulation of apoptosis, indicates that PLB could inhibit cell growth by inducing cell apoptosis.
Table 3.
The top enriched clusters (Enrich score >3) by the DAVID database for the target list of PLB derived from molecular docking calculations
| Category | Term | Count | Fold enrichment | P-value | FDR |
|---|---|---|---|---|---|
| Cluster 1 | Enrichment score: 7.89 | ||||
| GOTERM_BP_FAT | Response to organic substance | 22 | 5.16 | 5.44×10⁻¹⁰ | 9.05×10⁻⁹ |
| GOTERM_BP_FAT | Response to endogenous stimulus | 17 | 7.10 | 1.19×10⁻⁹ | 1.98×10⁻⁸ |
| GOTERM_BP_FAT | Response to hormone stimulus | 16 | 7.37 | 2.66×10⁻⁹ | 4.42×10⁻⁸ |
| Cluster 2 | Enrichment score: 5.86 | ||||
| SP_PIR_KEYWORDS | Oxidoreductase | 16 | 6.60 | 1.31×10⁻⁸ | 1.72×10⁻⁷ |
| GOTERM_BP_FAT | Oxidation reduction | 16 | 4.23 | 3.57×10⁻⁶ | 5.93×10⁻⁵ |
| SP_PIR_KEYWORDS | NADP | 7 | 10.40 | 5.44×10⁻⁵ | 7.13×10⁻⁴ |
| Cluster 3 | Enrichment score: 4.70 | ||||
| UP_SEQ_FEATURE | Active site: proton acceptor | 20 | 7.00 | 3.18×10⁻¹¹ | 4.25×10⁻¹⁰ |
| SP_PIR_KEYWORDS | Transferase | 27 | 4.49 | 5.82×10⁻¹¹ | 7.62×10⁻¹⁰ |
| SP_PIR_KEYWORDS | ATP | 13 | 12.77 | 3.42×10⁻¹⁰ | 4.48×10⁻⁹ |
| Cluster 4 | Enrichment score: 3.91 | ||||
| SP_PIR_KEYWORDS | NAD | 9 | 11.04 | 1.44×10⁻⁶ | 1.88×10⁻⁵ |
| UP_SEQ_FEATURE | Nucleotide phosphate-binding region: NAD | 6 | 18.18 | 1.87×10⁻⁵ | 2.50×10⁻⁴ |
| UP_SEQ_FEATURE | Binding site: NAD | 4 | 18.42 | 1.29×10⁻³ | 1.71×10⁻² |
| Cluster 5 | Enrichment score: 3.83 | ||||
| SMART | ZnF-C4 | 11 | 54.28 | 2.21×10⁻¹⁵ | 1.97×10⁻¹⁴ |
| UP_SEQ_FEATURE | DNA-binding region: nuclear receptor | 11 | 56.29 | 3.34×10⁻¹⁵ | 4.45×10⁻¹⁴ |
| UP_SEQ_FEATURE | Zinc finger region: NR C4-type | 11 | 56.29 | 3.34×10⁻¹⁵ | 4.45×10⁻¹⁴ |
| Cluster 6 | Enrichment score: 3.56 | ||||
| GOTERM_BP_FAT | Regulation of apoptosis | 18 | 3.79 | 2.98×10⁻⁶ | 4.96×10⁻⁵ |
| GOTERM_BP_FAT | Regulation of programmed cell death | 18 | 3.75 | 3.41×10⁻⁶ | 5.67×10⁻⁵ |
| GOTERM_BP_FAT | Regulation of cell death | 18 | 3.73 | 3.58×10⁻⁶ | 5.96×10⁻⁵ |
| Cluster 7 | Enrichment score: 3.52 | ||||
| UP_SEQ_FEATURE | Binding site: substrate | 12 | 9.30 | 5.58×10⁻⁸ | 7.46×10⁻⁷ |
| GOTERM_MF_FAT | Steroid dehydrogenase activity, acting on the CH-OH group of donors, NAD or NADP as acceptor | 5 | 29.32 | 2.21×10⁻⁵ | 2.99×10⁻⁴ |
| GOTERM_MF_FAT | Steroid dehydrogenase activity | 5 | 25.54 | 3.89×10⁻⁵ | 5.26×10⁻⁴ |
| Cluster 8 | Enrichment score: 3.42 | ||||
| GOTERM_BP_FAT | Hexose metabolic process | 10 | 8.81 | 1.69×10⁻⁶ | 2.82×10⁻⁵ |
| GOTERM_BP_FAT | Glucose metabolic process | 9 | 9.95 | 2.95×10⁻⁶ | 4.90×10⁻⁵ |
| GOTERM_BP_FAT | Monosaccharide metabolic process | 10 | 7.62 | 5.58×10⁻⁶ | 9.28×10⁻⁵ |
| Cluster 9 | Enrichment score: 3.35 | ||||
| GOTERM_MF_FAT | Identical protein binding | 14 | 3.46 | 1.53×10⁻⁴ | 2.06×10⁻³ |
| GOTERM_MF_FAT | Protein dimerization activity | 12 | 3.51 | 5.19×10⁻⁴ | 6.99×10⁻³ |
| GOTERM_MF_FAT | Protein homodimerization activity | 9 | 4.27 | 1.10×10⁻³ | 1.49×10⁻² |
| Cluster 10 | Enrichment score: 3.26 | ||||
| GOTERM_MF_FAT | Vitamin binding | 7 | 8.53 | 1.58×10⁻⁴ | 2.13×10⁻³ |
| GOTERM_MF_FAT | Retinoid binding | 4 | 30.16 | 2.87×10⁻⁴ | 3.87×10⁻³ |
| GOTERM_BP_FAT | Diterpenoid metabolic process | 4 | 29.41 | 3.12×10⁻⁴ | 5.18×10⁻³ |
Notes: Clusters were sorted by the enrichment score. Only the top three terms in each cluster were listed.
Abbreviations: FDR, false discovery rate; NAD, nicotineamide adenine dinucleotide; NADP, nicotinamide adenine dinucleotide phosphate; PLB, plumbagin.
As shown in Table 4, ten KEGG pathways significantly enriched (FDR <0.1) in the target list were discovered. The first significant pathway reported by DAVID database is “Metabolism of xenobiotics by cytochrome P450” (the enrichment fold is 7.48 and FDR =0.012). Six proteins, AKR1C1, AKR1C2, AKR1C3, ADH5, ADH7, and GSTM4, were included in this pathway.
Table 4.
The top enriched KEGG pathways (FDR <0.1) by the DAVID database for the target list of PLB derived from molecular docking calculations
| Pathway | Gene count | Fold enrichment | P-value | FDR |
|---|---|---|---|---|
| Metabolism of xenobiotics by cytochrome P450 | 6 | 7.48 | 0.0011 | 0.012 |
| Progesterone-mediated oocyte maturation | 7 | 6.09 | 8.58×10⁻⁴ | 0.010 |
| ErbB signaling pathway | 7 | 6.02 | 9.12×10⁻⁴ | 0.010 |
| VEGF signaling pathway | 6 | 5.98 | 0.0029 | 0.033 |
| Fc epsilon RI signaling pathway | 6 | 5.75 | 0.0034 | 0.039 |
| Neurotrophin signaling pathway | 9 | 5.43 | 1.95×10⁻⁴ | 0.002 |
| Colorectal cancer | 6 | 5.34 | 0.0047 | 0.053 |
| Prostate cancer | 6 | 5.04 | 0.0060 | 0.068 |
| Insulin signaling pathway | 7 | 3.88 | 0.0083 | 0.092 |
| MAPK signaling pathway | 10 | 2.80 | 0.0078 | 0.086 |
Note: Clusters were sorted by the enrichment fold.
Abbreviations: FDR, false discovery rate; KEGG, Kyoto Encyclopedia of Genes and Genomes; PLB, plumbagin.
KEGG pathway analysis and the enriched gene cluster 8 (glucose metabolism) also suggested the antidiabetic effect of PLB. Seven drug targets in the insulin signaling pathway, MAP3K1, AKT1, BRAF, PYGM, GSK3B, MAPK10, and PYGL, showed high binding affinities with PLB. It agrees well with previous observations that PLB could significantly reduce the blood glucose and restore plasma insulin levels in diabetic rat models.45 Actually, PLB is isolated from the roots of Philodendron scandens and that herb is widely used to treat type II diabetes in Asia. Importantly, five of the top enriched KEGG pathways were associated with cancer. These include ErbB/EGFR/HER signaling, VEGF signaling, MAPK signaling, and colorectal cancer and prostate cancer pathways. This provides a basis for our following bench-marking experiments where PLB would be used to kill prostate cancer cells.
Our proteomic study reveals that PLB regulates a large number of functional proteins
Overview of proteomic response to PLB treatment in PC-3 and DU145 cells
To verify the above bioinformatic data, we further carried out proteomic experiments to evaluate and compare the interactome of PLB in PC-3 and DU145 cells treated with PLB at 5 μM. There were 1,225 and 267 protein molecules identified as the potential targets of PLB in PC-3 and DU145 cells (Figures 6 and 7), respectively. These included a number of molecules involved in cell proliferation, cell metabolism, cell migration, cell invasion, cell survival, and cell death, such as CDK1/CDC2, MAPK, mTOR, PI3K, Akt, and E-cadherin. PLB increased the expression level of 533 protein molecules, but decreased the expression level of 682 protein molecules in PC-3 cells (Figure 6). In DU145 cells, PLB enhanced the expression of 73 protein molecules, but suppressed the expression of 193 protein molecules (Figure 7). Subsequently, these proteins were subject to IPA pathway analysis. As shown in Figures 8 and 9 and Tables 5 and 6, 341 and 107 signaling pathways and cellular functions were potentially regulated by PLB in PC-3 and DU145 cells, respectively.
Figure 6.

Proteomic analysis revealed molecular interactome regulated by PLB in PC-3 cells.
Notes: PC-3 cells were treated with 5 μM PLB for 24 hours and the protein samples were subject to quantitative proteomic analysis. There were 1,225 molecules and 341 related pathways regulated by PLB in PC-3 cells. Red indicates an upregulation; green indicates a downregulation; brown indicates a predicted activation; and blue indicates a predicted inhibition. The intensity of green and red molecule colors indicates the degree of down- or upregulation, respectively. Solid arrows indicate direct interaction and dashed arrows indicate indirect interaction.
Abbreviation: PLB, plumbagin.
Figure 7.

Proteomic analysis revealed molecular interactome regulated by PLB in DU145 cells.
Notes: DU145 cells were treated with 5 μM PLB for 24 hours and the protein samples were subject to quantitative proteomic analysis. There were 267 molecules and 107 related pathways regulated by PLB in DU145 cells. Red indicates an upregulation; green indicates a downregulation; brown indicates a predicted activation; and blue indicates a predicted inhibition. The intensity of green and red molecule colors indicates the degree of down- or upregulation, respectively. Solid arrows indicate direct interaction and dashed arrows indicate indirect interaction.
Abbreviation: PLB, plumbagin.
Figure 8.

Proteomic analysis revealed a network of signaling pathways regulated by PLB in PC-3 cells.
Notes: A network of signaling pathways was analyzed by IPA according to the 1,225 molecules and 341 related pathways which were regulated by PLB in PC-3 cells.
Abbreviations: IPA, Ingenuity Pathway Analysis; PLB, plumbagin; TCA, tricarboxylic acid cycle.
Figure 9.

Proteomic analysis revealed networks of signaling pathways regulated by PLB in DU145 cells.
Notes: Networks of signaling pathways were analyzed by IPA according to 267 molecules and 107 related pathways which were regulated by PLB in DU145 cells.
Abbreviations: cAMP, cyclic adenosine monophosphate; IPA, Ingenuity Pathway Analysis; PLB, plumbagin.
Table 5.
Potential molecular targets, signaling pathways, and cellular functions regulated by PLB in PC-3 cells
| Ingenuity canonical pathways | logP | Protein molecules |
|---|---|---|
| γ-Glutamyl cycle | 6.54×10⁻¹ | GGCT and GSS |
| γ-Linolenate biosynthesis II (animals) | 5.74×10⁻¹ | ACSL3 and CYB5R3 |
| 14-3-3-mediated signaling | 4.78 | TUBB3, YWHAG, YWHAH, MAPK1, YWHAE, YWHAB, RRAS, TUBB4B, PDIA3, TUBB2A, YWHAZ, TUBA4A, VIM, TUBB, TUBA1B, YWHAQ, TUBA1A, TUBA1C, SFN, and PDCD6IP |
| 2-Ketoglutarate dehydrogenase complex | 3.1 | DLST, DLD, and OGDH |
| 2-Oxobutanoate degradation I | 5.8×10⁻¹ | DLD |
| 5-Aminoimidazole ribonucleotide biosynthesis I | 7.76×10⁻¹ | GART |
| Α-adrenergic signaling | 2.71 | GNB1, CALM1 (includes others), CALML5, MAPK1, RRAS, ITPR3, GNB2L1, GNB2, PRKAR2A, PYGL, PYGB, GNG12, and PRKAR1A |
| Acetyl-CoA biosynthesis I (pyruvate dehydrogenase complex) | 3.78 | PDHA1, DLAT, DLD, and PDHB |
| Actin cytoskeleton signaling | 6.87 | PFN1, ARPC1B, MAPK1, MYL6, ACTA2, TLN1, CDC42, IQGAP1, ACTR3, CFL2, FLNA, EZR, PFN2, ARPC3, VCL, TMSB10/TMSB4X, GNG12, ACTN1, NCKAP1, ITGB1, ACTR2, PXN, PAK2, CFL1, RRAS, ITGA2, RDX, RAC1, ACTG1, MYL12B, MYH9, ACTN4, ARPC4, and MSN |
| Actin nucleation by Arp–WASP complex | 4.75 | ITGB1, ACTR2, ARPC1B, RRAS, RHOC, ITGA2, RAC1, CDC42, ACTR3, RHOG, ARPC3, ARPC4, and VASP |
| Activation of IRF by cytosolic pattern recognition receptors | 2.86×10⁻¹ | PPIB, MAVS, ADAR, and ISG15 |
| Acyl-CoA hydrolysis | 2.84×10⁻¹ | ACOT9 |
| Adenine and adenosine salvage I | 2.46 | PNP and APRT |
| Adenine and adenosine salvage III | 1.22 | PNP and HPRT1 |
| Agranulocyte adhesion and diapedesis | 3.81×10⁻¹ | ITGB1, IL18, CLDN4, MYL6, EZR, ACTA2, ITGA2, ITGA6, RDX, MYH9, ACTG1, and MSN |
| Agrin interactions at neuromuscular junction | 3.23 | ITGB1, PXN, PAK2, MAPK1, RRAS, ACTA2, ITGA2, RAC1, ITGA6, CDC42, ACTG1, and CTTN |
| Aldosterone signaling in epithelial cells | 3.14 | MAPK1, DNAJC9, PDIA3, HSPH1, SLC12A2, HSPA9, HSPD1, DNAJA1, HSPA5, HSPA8, HSPA4, HSP90B1, HSP90AB1, DNAJB11, HSPE1, ITPR3, HSP90AA1, DNAJB1, HSPB1, and AHCY |
| AMPK signaling | 5.55×10⁻¹ | AK1, PPP2R1A, CPT1A, MAPK1, PPP2CA, FASN, PRKAR2A, PFKP, PPM1G, and PRKAR1A |
| Amyloid processing | 2.01 | CAPNS1, MAPK1, CSNK2A1, PRKAR2A, CSNK1A1, CAPN2, CSNK2B, and PRKAR1A |
| Amyotrophic lateral sclerosis signaling | 6.34×10⁻¹ | SOD1, CAPNS1, CAT, GPX1, RAC1, CAPN2, CYCS, and SSR4 |
| Androgen signaling | 2.6 | GNB1, HSPA4, CALM1 (includes others), CALR, CALML5, MAPK1, POLR2E, GNB2L1, GNB2, PRKAR2A, POLR2H, HSP90AA1, DNAJB1, GNG12, and PRKAR1A |
| Antigen presentation pathway | 1.69 | CALR, PSMB5, HLA-A, PDIA3, CANX, and PSMB6 |
| Antiproliferative role of somatostatin receptor 2 | 1.08 | RAP1B, GNB1, MAPK1, RRAS, GNB2L1, GNB2, and GNG12 |
| Antiproliferative role of TOB in T-cell signaling | 7.05×10⁻¹ | PABPC1, MAPK1, and SKP1 |
| Apoptosis signaling | 1.83 | ACIN1, CAPNS1, MAPK1, RRAS, LMNA, CAPN2, SPTAN1, CYCS, CDK1, PARP1, and AIFM1 |
| Arginine biosynthesis IV | 1.35 | OAT and GLUD1 |
| Arginine degradation I (arginase pathway) | 6.64×10⁻¹ | OAT |
| Arginine degradation VI (arginase 2 pathway) | 2.44 | OAT, PYCR2, and PYCR1 |
| Arsenate detoxification I (glutaredoxin) | 6.64×10⁻¹ | PNP |
| Aryl hydrocarbon receptor signaling | 2.06 | MGST1, MAPK1, NQO1, ALDH9A1, PTGES3, CTSD, HSP90B1, HSP90AB1, ALDH1A3, ALDH3A2, HSP90AA1, ALDH18A1, GSTP1, MCM7, HSPB1, and GSTK1 |
| Asparagine biosynthesis I | 1.23 | ASNS |
| Aspartate biosynthesis | 2 | GOT1 and GOT2 |
| Aspartate degradation II | 3.78 | GOT1, MDH1, MDH2, and GOT2 |
| Assembly of RNA polymerase I complex | 3.74×10⁻¹ | POLR1C |
| Assembly of RNA polymerase II complex | 2.4×10⁻¹ | POLR2E, POLR2H, and TAF15 |
| Assembly of RNA polymerase III complex | 2.61×10⁻¹ | SF3A1 |
| ATM signaling | 5.5×10⁻¹ | SMC3, TRIM28, H2AFX, CBX5, and CDK1 |
| Axonal guidance signaling | 2.21 | RAP1B, DPYSL2, PFN1, ARPC1B, MAPK1, MYL6, PDIA3, GNB2L1, CDC42, TUBB, GNB1, ACTR3, CFL2, PFN2, ARPC3, TUBA1C, VASP, GNG12, ITGB1, ACTR2, PXN, TUBB3, PAK2, CFL1, TUBB4B, RRAS, ITGA2, TUBB2A, PRKAR2A, TUBA4A, RAC1, TUBA1B, TUBA1A, MYL12B, RTN4, GNB2, EPHA2, ARPC4, and PRKAR1A |
| Bile acid biosynthesis, neutral pathway | 2.61×10⁻¹ | SCP2 |
| BMP signaling pathway | 3.27×10⁻¹ | MAGED1, MAPK1, RRAS, PRKAR2A, and PRKAR1A |
| Branched-chain α-keto acid dehydrogenase complex | 6.64×10⁻¹ | DLD |
| Breast cancer regulation by stathmin 1 | 4.99 | PPP1CC, MAPK1, PPP2CA, GNB2L1, TUBB, CDC42, PPP1R14B, GNB1, STMN1, TUBA1C, GNG12, CALML5, TUBB3, RRAS, TUBB4B, TUBB2A, RAC1, TUBA4A, PRKAR2A, TUBA1B, CDK1, CALM1 (includes others), PPP2R1A, TUBA1A, ITPR3, GNB2, CAMK2G, PRKAR1A |
| Calcium signaling | 1.98 | RAP1B, RAP2B, CALR, CALML5, LETM1, MYL6, MAPK1, HDAC2, ACTA2, PRKAR2A, TPM3, ATP2A2, CALM1 (includes others), ITPR3, MYH9, ASPH, TPM4, PRKAR1A, and CAMK2G |
| Calcium transport I | 3.4×10⁻¹ | ATP2A2 |
| Calcium-induced T-lymphocyte apoptosis | 7.96×10⁻¹ | CALM1 (includes others), CALML5, HDAC2, ITPR3, CAPN2, and ATP2A2 |
| Cardiac hypertrophy signaling | 7.42×10⁻¹ | CALML5, MYL6, MAPK1, RHOC, RRAS, PDIA3, GNB2L1, PRKAR2A, EIF2B2, GNB1, CALM1 (includes others), RHOG, MYL12B, GNB2, GNG12, PRKAR1A, and HSPB1 |
| Cardiac β-adrenergic signaling | 1.86 | AKAP12, PPP1CC, AKAP8, PPP2CA, GNB2L1, PRKAR2A, PPP1R14B, ATP2A2, GNB1, PPP2R1A, PKIB, GNB2, APEX1, GNG12, and PRKAR1A |
| Caveolar-mediated endocytosis signaling | 6.67 | ITGB1, FLNB, COPZ1, ARCN1, HLA-A, ACTA2, ITGA2, COPA, COPE, ITGA6, COPB2, COPB1, ACTG1, COPG1, CD55, FLNC, FLNA, and PTPN1 |
| CCR3 signaling in eosinophils | 1.73 | GNB1, CALM1 (includes others), CALML5, PAK2, CFL2, CFL1, MAPK1, RRAS, ITPR3, GNB2L1, GNB2, RAC1, and GNG12 |
| CCR5 signaling in macrophages | 9.22×10⁻¹ | GNB1, CALM1 (includes others), CALML5, MAPK1, GNB2L1, GNB2, and GNG12 |
| CD28 signaling in T helper cells | 8.25×10⁻¹ | CALM1 (includes others), ACTR2, CALML5, ACTR3, ARPC1B, ITPR3, RAC1, ARPC3, CDC42, and ARPC4 |
| CDC42 signaling | 1.53 | ITGB1, ACTR2, PAK2, MYL6, ARPC1B, MAPK1, CFL1, HLA-A, ITGA2, IQGAP1, CDC42, ACTR3, CFL2, MYL12B, ARPC3, and ARPC4 |
| CDK5 signaling | 1.83 | ITGB1, PPP1CC, PPP2R1A, MAPK1, PPP2CA, RRAS, ITGA2, ITGA6, PRKAR2A, PPP1R14B, and PRKAR1A |
| Cell cycle control of chromosomal replication | 6.4×10⁻¹ | MCM3, MCM6, and MCM7 |
| Cell cycle regulation by BGT family proteins | 4.64×10⁻¹ | PPP2R1A, PPP2CA, and PRMT1 |
| Cell cycle: G1/S checkpoint regulation | 7.09×10⁻¹ | RPL11, RPL5, HDAC2, PA2G4, GNL3, and SKP1 |
| Cell cycle: G2/M DNA damage checkpoint regulation | 3.7 | YWHAQ, PRKDC, YWHAG, YWHAE, YWHAH, YWHAB, YWHAZ, SFN, SKP1, and CDK1 |
| Cellular effects of sildenafil (Viagra) | 8.45×10⁻¹ | CALM1 (includes others), CALML5, MYL6, PDIA3, MYL12B, ACTA2, ITPR3, PRKAR2A, MYH9, ACTG1, and PRKAR1A |
| Ceramide signaling | 2.87×10⁻¹ | CTSD, PPP2R1A, PPP2CA, RRAS, and CYCS |
| Chemokine signaling | 6.5×10⁻¹ | CALM1 (includes others), CALML5, MAPK1, CFL1, RRAS, and CAMK2G |
| Cholecystokinin/gastrin-mediated signaling | 4.08×10⁻¹ | PXN, IL18, RHOG, MAPK1, RRAS, RHOC, and ITPR3 |
| Cholesterol biosynthesis I | 7.5×10⁻¹ | NSDHL and DHCR7 |
| Cholesterol biosynthesis II (via 24,25-dihydrolanosterol) | 7.5×10⁻¹ | NSDHL and DHCR7 |
| Cholesterol biosynthesis III (via desmosterol) | 7.5×10⁻¹ | NSDHL and DHCR7 |
| Chondroitin sulfate degradation (metazoa) | 2.41×10⁻¹ | CD44 |
| Citrulline biosynthesis | 2.03 | GLS, OAT, and ALDH18A1 |
| Clathrin-mediated endocytosis signaling | 2.49 | ITGB1, ACTR2, AP2B1, AP2A1, ARPC1B, CLTC, ACTA2, RAB7A, RAC1, CDC42, ACTG1, HSPA8, ACTR3, RAB11B, CLTA, CSNK2A1, TFRC, ARPC3, CSNK2B, CTTN, and ARPC4 |
| Cleavage and polyadenylation of pre-mRNA | 2.38 | CPSF6, NUDT21, PABPN1, and CSTF3 |
| CMP-N-acetylneuraminate biosynthesis I (eukaryotes) | 5.8×10⁻¹ | CMAS |
| Colanic acid building blocks biosynthesis | 7×10⁻¹ | GPI and UGDH |
| Complement system | 5.08×10⁻¹ | CD55, CD59, and C6 |
| Corticotropin-releasing hormone signaling | 4.51×10⁻¹ | RAP1B, CALM1 (includes others), CALML5, MAPK1, ITPR3, PRKAR2A, KRT1, and PRKAR1A |
| CREB signaling in neurons | 1.02 | CALML5, MAPK1, RRAS, PDIA3, GNB2L1, PRKAR2A, GNB1, CALM1 (includes others), POLR2E, ITPR3, GNB2, POLR2H, GNG12, CAMK2G, and PRKAR1A |
| Crosstalk between dendritic cells and natural killer cells | 5.47×10⁻¹ | IL18, HLA-A, FSCN1, ACTA2, TLN1, ACTG1, and CAMK2G |
| CTLA4 signaling in cytotoxic T-lymphocytes | 5.76×10⁻¹ | AP2B1, AP2A1, PPP2R1A, PPP2CA, HLA-A, CLTA, and CLTC |
| CXCR4 signaling | 1.15 | PXN, PAK2, MAPK1, MYL6, RHOC, RRAS, GNB2L1, RAC1, GNB1, RHOG, MYL12B, ITPR3, GNB2, and GNG12 |
| Cyclins and cell cycle regulation | 4.73×10⁻¹ | PPP2R1A, HDAC2, PA2G4, PPP2CA, SKP1, and CDK1 |
| Cysteine biosynthesis III (Mammalia) | 1.72 | PRMT5, MAT2A, PRMT1, and AHCY |
| Cytotoxic T-lymphocyte-mediated apoptosis of target cells | 2.42×10⁻¹ | HLA-A and CYCS |
| Dermatan sulfate degradation (metazoa) | 2.22×10⁻¹ | CD44 |
| D-glucuronate degradation I | 6.64×10⁻¹ | AKR1A1 |
| Diphthamide biosynthesis | 7.76×10⁻¹ | EEF2 |
| D-myo-inositol (1,4,5)-trisphosphate degradation | 5.39×10⁻¹ | IMPA1 and BPNT1 |
| DNA damage-induced 14-3-3σ signaling | 5.06×10⁻¹ | SFN and CDK1 |
| DNA double-strand break repair by non-homologous end joining | 2.12 | PRKDC, XRCC6, XRCC5, and PARP1 |
| DNA methylation and transcriptional repression signaling | 4.76×10⁻¹ | HDAC2 and RBBP4 |
| Dopamine degradation | 7.77×10⁻¹ | ALDH1A3, ALDH3A2, and ALDH9A1 |
| Dopamine receptor signaling | 1.45 | PPP1CC, PPP2R1A, PPP2CA, PRKAR2A, SPR, PPP1R14B, PCBD1, QDPR, and PRKAR1A |
| Dopamine-DARPP32 feedback in cAMP signaling | 5.86×10⁻¹ | PPP1CC, CALM1 (includes others), CALML5, PPP2R1A, PPP2CA, PDIA3, ITPR3, PRKAR2A, CSNK1A1, PPP1R14B, ATP2A2, and PRKAR1A |
| dTMP de novo biosynthesis | 5.8×10⁻¹ | SHMT2 |
| EGF signaling | 3.71×10⁻¹ | MAPK1, ITPR3, CSNK2A1, and CSNK2B |
| EIF2 signaling | 6.5×10⁻¹ | RPL11, RPL22, RPL27A, MAPK1, EIF1, EIF3C/EIF3CL, RPS23, RPS11, EIF2A, RPS7, RPS3A, EIF3B, EIF4G2, RPL7A, EIF3D, EIF5, RPL19, RPL36, RPS20, RPL12, RPL8, PABPC1, RPL3, RRAS, RPL27, RPL23A, EIF3E, RPLP0, RPL10A, EIF3M, RPS6, RPL15, RPS4X, EIF4A3, RPL10, RPS15, RPS25, RPS15A, RPLP1, RPL13A, RPS27A, RPSA, RPL24, PPP1CC, RPS18, RPS13, RPS8, RPL14, RPS21, EIF2S1, EIF4G1, RPS17/RPS17L, EIF2B2, RPL7, RPL6, RPL35, RPS27, RPL18A, RPS9, EIF2S3, EIF3A, RPLP2, RPS3, RPS5, RPL18, RPL31, RPL29, RPL13, RPS24, RPL4, EIF3H, RPS2, RPS28, RPL17, RPS19, RPL30, EIF3J, RPL23, RPL21, RPL9, RPS12, EIF3G, EIF2S2, EIF3F, RPS16, RPL5, RPS26, RPL28, EIF4A1, RPL32, EIF3I, RPL38, EIF3L, and RPS14 |
| Endoplasmic reticulum stress pathway | 5.39×10⁻¹ | EIF2S1 and HSPA5 |
| eNOS signaling | 1.05 | HSPA8, CALM1 (includes others), HSPA4, CALML5, HSP90B1, HSP90AB1, HSPA9, ITPR3, PRKAR2A, HSP90AA1, HSPA5, and PRKAR1A |
| Ephrin A signaling | 8.15×10⁻¹ | CFL2, CFL1, RAC1, CDC42, and EPHA2 |
| Ephrin B signaling | 4.01 | PXN, MAPK1, CFL1, GNB2L1, RAC1, CDC42, HNRNPK, GNB1, CFL2, ACP1, GNB2, CAP1, CTNNB1, and GNG12 |
| Ephrin receptor signaling | 3.16 | RAP1B, ITGB1, ACTR2, PXN, PAK2, CFL1, MAPK1, ARPC1B, RRAS, GNB2L1, ITGA2, RAC1, CDC42, GNB1, ACTR3, CFL2, ACP1, GNB2, ARPC3, EPHA2, GNG12, and ARPC4 |
| Epithelial adherent junction signaling | 7.53 | RAP1B, MYL6, ARPC1B, ACTA2, IQGAP1, TUBB, CDC42, ACTR3, ARPC3, TUBA1C, VCL, CTNNB1, ACTN1, ACTR2, TUBB3, LMO7, TUBB4B, RRAS, TUBB2A, TUBA4A, RAC1, ACTG1, TUBA1B, TUBA1A, MYH9, ZYX, ACTN4, and ARPC4 |
| Erk/MAPK signaling | 2.41 | RAP1B, ITGB1, PPP1CC, PXN, YWHAG, PAK2, YWHAH, MAPK1, YWHAB, PPP2CA, RRAS, ITGA2, YWHAZ, RAC1, PRKAR2A, TLN1, PPP1R14B, YWHAQ, PPP2R1A, HSPB1, and PRKAR1A |
| Erk5 signaling | 1.46 | YWHAQ, YWHAG, YWHAE, YWHAH, RRAS, YWHAB, YWHAZ, and SFN |
| Estrogen receptor signaling | 8.78×10⁻¹ | PRKDC, DDX5, PCK2, MAPK1, RRAS, POLR2E, PHB2, POLR2H, HNRNPD, RBFOX2, and TAF15 |
| Estrogen-dependent breast cancer signaling | 2.86×10⁻¹ | HSD17B10, MAPK1, RRAS, and HSD17B4 |
| Ethanol degradation II | 3.27 | ADH5, HSD17B10, AKR1A1, ACSL3, DHRS9, ALDH1A3, ALDH3A2, and ALDH9A1 |
| Ethanol degradation IV | 2.49 | ACSL3, ALDH1A3, ALDH3A2, CAT, and ALDH9A1 |
| Eumelanin biosynthesis | 1.71 | MIF and DDT |
| FAK signaling | 2.75 | ITGB1, PXN, CAPNS1, PAK2, MAPK1, RRAS, ITGA2, ACTA2, RAC1, CAPN2, TLN1, VCL, and ACTG1 |
| Fatty acid activation | 2.61×10⁻¹ | ACSL3 |
| Fatty acid biosynthesis initiation II | 9.39×10⁻¹ | FASN |
| Fatty acid α-oxidation | 1.19 | ALDH1A3, ALDH3A2, and ALDH9A1 |
| Fatty acid β-oxidation II | 6.24 | HSD17B10, HADHB, ACSL3, ECHS1, ACAA1, ECI2, HSD17B4, ACADM, ECI1, HADHA, and HADH |
| Fatty acid β-oxidation III (unsaturated, odd number) | 2 | ECI2 and ECI1 |
| Fcγ receptor-mediated phagocytosis in macrophages and monocytes | 3.98 | ACTR2, PXN, MAPK1, ARPC1B, ACTA2, RAC1, TLN1, CDC42, ACTG1, ACTR3, RAB11B, EZR, VAMP3, ARPC3, VASP, and ARPC4 |
| fMLP signaling in neutrophils | 3.17 | ACTR2, CALML5, MAPK1, ARPC1B, RRAS, GNB2L1, RAC1, CDC42, GNB1, CALM1 (includes others), ACTR3, ITPR3, GNB2, ARPC3, ARPC4, and GNG12 |
| Folate polyglutamylation | 1.22 | MTHFD1 and SHMT2 |
| Folate transformations I | 1.74 | MTHFD2, MTHFD1, and SHMT2 |
| Formaldehyde oxidation II (glutathione-dependent) | 2.46 | ADH5 and ESD |
| G protein signaling mediated by tubby | 8.55×10⁻¹ | GNB1, GNB2L1, GNB2, and GNG12 |
| GABA receptor signaling | 8.42×10⁻¹ | NSF, AP2B1, AP2A1, UBQLN1, and ALDH9A1 |
| Gadd45 signaling | 4.76×10⁻¹ | PCNA and CDK1 |
| Gap junction signaling | 2.65 | DBN1, TUBB3, MAPK1, RRAS, TUBB4B, PDIA3, TUBB2A, ACTA2, CSNK1A1, TUBA4A, PRKAR2A, TUBB, TUBA1B, ACTG1, TUBA1A, ITPR3, TUBA1C, CTNNB1, and PRKAR1A |
| GAS signaling | 3.03×10⁻¹ | GNB1, MAPK1, GNB2L1, GNB2, PRKAR2A, GNG12, and PRKAR1A |
| GDNF family ligand-receptor interactions | 4.24×10⁻¹ | MAPK1, RRAS, ITPR3, RAC1, and CDC42 |
| GDP-glucose biosynthesis | 1.22 | PGM3 and PGM1 |
| GDP-mannose biosynthesis | 5.13×10⁻¹ | GPI |
| Germ cell-Sertoli cell junction signaling | 6.34 | MAPK1, ACTA2, IQGAP1, TUBB, CDC42, RHOG, TUBA1C, CTNNB1, ACTN1, ITGB1, PLS1, PXN, TUBB3, PAK2, RHOC, RRAS, TUBB4B, ITGA2, TUBB2A, ITGA6, TUBA4A, RAC1, ACTG1, TUBA1B, TUBA1A, ZYX, and ACTN4 |
| Glioblastoma multiforme signaling | 2.94×10⁻¹ | RHOG, MAPK1, RRAS, PDIA3, RHOC, ITPR3, RAC1, CDC42, and CTNNB1 |
| Glioma invasiveness signaling | 5.87×10⁻¹ | RHOG, MAPK1, RRAS, RHOC, and CD44 |
| Glioma signaling | 4.79×10⁻¹ | CALM1 (includes others), CALML5, MAPK1, PA2G4, RRAS, IGF2R, and CAMK2G |
| Glucocorticoid receptor signaling | 6.84×10⁻¹ | YWHAH, MAPK1, RRAS, HSPA9, RAC1, HSPA5, PTGES3, HSPA8, HSPA4, HSP90B1, HSP90AB1, PCK2, POLR2E, ANXA1, FKBP4, POLR2H, HSP90AA1, TAF15, and UBE2I |
| Gluconeogenesis I | 6.54 | PGK1, ENO1, GPI, GAPDH, ME2, ALDOA, ME1, MDH1, MDH2, and ALDOC |
| Glucose and glucose-1-phosphate degradation | 1.11 | PGM3 and PGM1 |
| Glutamate biosynthesis II | 9.39×10⁻¹ | GLUD1 |
| Glutamate degradation II | 2 | GOT1 and GOT2 |
| Glutamate degradation X | 9.39×10⁻¹ | GLUD1 |
| Glutamate receptor signaling | 3.32×10⁻¹ | GNB1, CALM1 (includes others), CALML5, and GLS |
| Glutamine degradation I | 9.39×10⁻¹ | GLS |
| Glutaryl-CoA degradation | 4.54 | HSD17B10, HADHB, ACAT1, HSD17B4, HADHA, and HADH |
| Glutathione biosynthesis | 7.76×10⁻¹ | GSS |
| Glutathione redox reactions I | 1.8 | MGST1, GPX1, PRDX6, and GSTK1 |
| Glutathione-mediated detoxification | 6.4×10⁻¹ | MGST1, GSTP1, and GSTK1 |
| Glycerol degradation I | 5.8×10⁻¹ | GPD2 |
| Glycerol-3-phosphate shuttle | 7.76×10⁻¹ | GPD2 |
| Glycine betaine degradation | 3.4×10⁻¹ | SHMT2 |
| Glycine biosynthesis I | 9.39×10⁻¹ | SHMT2 |
| Glycine cleavage complex | 1.35 | GCSH and DLD |
| Glycogen degradation II | 2.72 | PGM3, PGM1, PYGB, and PYGL |
| Glycogen degradation III | 2.38 | PGM3, PGM1, PYGB, and PYGL |
| Glycolysis I | 5.3 | PGK1, ENO1, GPI, TPI1, PKM, GAPDH, ALDOA, PFKP, and ALDOC |
| GM-CSF signaling | 2.86×10⁻¹ | MAPK1, RRAS, GNB2L1, and CAMK2G |
| GnRH signaling | 4.39×10⁻¹ | PAK2, MAPK1, RRAS, ITPR3, RAC1, PRKAR2A, CDC42, PRKAR1A, and CAMK2G |
| Granzyme A signaling | 5.21 | H1F0, HIST1H1C, NME1, HIST1H1E, HIST1H1D, SET, APEX1, and HMGB2 |
| Granzyme B signaling | 3.69 | PRKDC, NUMA1, LMNB2, CYCS, LMNB1, and PARP1 |
| Guanine and guanosine salvage I | 2.46 | PNP and HPRT1 |
| Guanosine nucleotides degradation III | 2.61×10⁻¹ | PNP |
| Gα12/13signaling | 3.98×10⁻¹ | PXN, MAPK1, MYL6, RRAS, MYL12B, CDH20, CDC42, and CTNNB1 |
| Gαi signaling | 3.6×10⁻¹ | GNB1, MAPK1, RRAS, GNB2L1, GNB2, PRKAR2A, GNG12, and PRKAR1A |
| Gαq signaling | 4.19×10⁻¹ | GNB1, CALM1 (includes others), CALML5, RHOG, MAPK1, RHOC, GNB2L1, ITPR3, GNB2, and GNG12 |
| Gβγ signaling | 1.09 | GNB1, MAPK1, RRAS, GNB2L1, GNB2, PRKAR2A, CDC42, GNG12, and PRKAR1A |
| Hereditary breast cancer signaling | 6.03×10⁻¹ | NPM1, HDAC2, RFC4, RRAS, POLR2E, H2AFX, POLR2H, SFN, and CDK1 |
| HGF signaling | 2.62×10⁻¹ | RAP1B, PXN, MAPK1, RRAS, RAC1, and CDC42 |
| HIF1α signaling | 1.08 | MAPK1, CUL2, RRAS, RBX1, HSP90AA1, TCEB2, TCEB1, APEX1, LDHA, and LDHB |
| Histamine degradation | 1.42 | ALDH1A3, ALDH3A2, and ALDH9A1 |
| Histidine degradation III | 1.11 | MTHFD2 and MTHFD1 |
| HMGB1 signaling | 3.23×10⁻¹ | RHOG, MAPK1, RRAS, RHOC, RAC1, and CDC42 |
| Huntington’s disease signaling | 3.48 | MAPK1, GNB2L1, HSPA5, VTI1B, GNB1, NSF, CTSD, HSPA4, VAMP3, POLR2H, DNAJB1, GNG12, CASP14, ATP5J, SDHA, HDAC2, GLS, HSPA9, CLTC, HSPA8, DYNC1I2, CAPNS1, ATP5B, POLR2E, GNB2, CAPN2, and CYCS |
| Hypoxia signaling in the cardiovascular system | 2.8 | P4HB, HSP90B1, UBE2M, HSP90AB1, UBE2N, NQO1, HSP90AA1, UBE2E2, LDHA, UBE2C, and UBE2I |
| Hypusine biosynthesis | 7.76×10⁻¹ | EIF5A |
| IGF-1 signaling | 2.77 | YWHAQ, PXN, YWHAG, MAPK1, YWHAE, YWHAH, YWHAB, RRAS, CSNK2A1, PRKAR2A, YWHAZ, CSNK2B, SFN, and PRKAR1A |
| IL-1 signaling | 5.05×10⁻¹ | GNB1, MAPK1, GNB2L1, GNB2, PRKAR2A, GNG12, and PRKAR1A |
| IL-2 signaling | 4.15×10⁻¹ | MAPK1, RRAS, CSNK2A1, and CSNK2B |
| IL-8 signaling | 6.59×10⁻¹ | PAK2, MAPK1, RHOC, RRAS, GNB2L1, RAC1, IQGAP1, CSTB, GNB1, RHOG, MYL12B, GNB2, GNG12, and VASP |
| ILK signaling | 4.36 | ITGB1, FLNB, PXN, CFL1, MAPK1, MYL6, RHOC, PPP2CA, FERMT2, ACTA2, VIM, CDC42, ACTG1, PPP1R14B, PPP2R1A, RHOG, CFL2, FLNC, FLNA, MYH9, KRT18, ACTN4, TMSB10/TMSB4X, CTNNB1, ACTN1, and NACA |
| Induction of apoptosis by HIV1 | 5.68×10⁻¹ | SLC25A6, SLC25A3, SLC25A10, CYCS, and SLC25A5 |
| iNOS signaling | 5.81×10⁻¹ | CALM1 (includes others), CALML5, MAPK1, and HMGA1 |
| Inosine-5′-phosphate biosynthesis II | 2 | PAICS and ATIC |
| Insulin receptor signaling | 2.8×10⁻¹ | PPP1CC, MAPK1, RRAS, PTPN1, PRKAR2A, PPP1R14B, EIF2B2, and PRKAR1A |
| Integrin signaling | 6.73 | RAP1B, RAP2B, ARPC1B, MAPK1, ACTA2, TLN1, CDC42, RHOG, ACTR3, ARF4, ARPC3, VCL, VASP, ACTN1, ITGB1, ACTR2, PXN, PAK2, RHOC, RRAS, ITGA2, RAC1, ITGA6, ACTG1, CAPNS1, ARF3, MYL12B, ZYX, CAPN2, ACTN4, CTTN, and ARPC4 |
| Isoleucine degradation I | 3.87 | HSD17B10, HADHB, ECHS1, ACAT1, DLD, and HADHA |
| Ketogenesis | 1.62 | HADHB, ACAT1, and HADHA |
| Ketolysis | 2.72 | HADHB, ACAT1, OXCT1, and HADHA |
| L-carnitine biosynthesis | 7.76×10⁻¹ | ALDH9A1 |
| L-cysteine degradation I | 1.71 | GOT1 and GOT2 |
| L-cysteine degradation III | 9.39×10⁻¹ | GOT1 |
| Leucine degradation I | 3.74×10⁻¹ | ACADM |
| Leukocyte extravasation signaling | 2.47 | RAP1B, ITGB1, PXN, MYL6, MAPK1, ACTA2, ITGA2, RDX, ITGA6, RAC1, CDC42, ACTG1, CLDN4, EZR, CD44, VCL, ACTN4, CTNNB1, CTTN, VASP, ACTN1, and MSN |
| Leukotriene biosynthesis | 2.22×10⁻¹ | LTA4H |
| Lipid antigen presentation by CD1 | 2.45 | AP2B1, CALR, AP2A1, PDIA3, PSAP, and CANX |
| LPS-/IL-1-mediated inhibition of RXR function | 3.59×10⁻¹ | MGST1, ACSL3, CPT1A, ACOX1, ALDH9A1, IL18, ALDH1A3, ALDH3A2, CAT, XPO1, ALDH18A1, FABP5, GSTP1, and GSTK1 |
| Macropinocytosis signaling | 4.24×10⁻¹ | ITGB1, RRAS, RAC1, ACTN4, and CDC42 |
| Mechanisms of viral exit from host cells | 2.08 | CHMP4B, ACTA2, XPO1, LMNB2, PDCD6IP, ACTG1, and LMNB1 |
| Melatonin signaling | 9.22×10⁻¹ | CALM1 (includes others), CALML5, MAPK1, PDIA3, PRKAR2A, PRKAR1A, and CAMK2G |
| Methionine degradation I (to homocysteine) | 1.9 | PRMT5, MAT2A, PRMT1, and AHCY |
| Methylglyoxal degradation III | 2.22×10⁻¹ | AKR1A1 |
| Mevalonate pathway I | 1.26 | HADHB, ACAT1, and HADHA |
| MIF-mediated glucocorticoid regulation | 2.29×10⁻¹ | MIF and MAPK1 |
| Mismatch repair in eukaryotes | 1.19 | PCNA, RFC4, and FEN1 |
| Mitochondrial dysfunction | 1.93×101 | HSD17B10, UQCRH, ATP5D, PRDX5, ATP5L, UQCRB, MT-CO2, ATP5H, VDAC2, PDHA1, NDUFA5, SOD2, PARK7, GPD2, NDUFAB1, CYB5R3, NDUFB6, OGDH, ATP5F1, COX4I1, AIFM1, SDHA, ATP5J, COX7A2, COX6B1, COX17, ATP5O, CPT1A, ATP5A1, VDAC3, NDUFS3, ATP5C1, FIS1, MT-ND1, PRDX3, NDUFB11, ATP5B, NDUFS8, UQCR10, CAT, UQCRC2, CYC1, COX5A, CYCS, VDAC1, UQCRC1, and COX5B |
| Mitochondrial L-carnitine shuttle pathway | 5.74×10⁻¹ | ACSL3 and CPT1A |
| Mitotic roles of polo-like kinase | 1.36 | SLK, SMC3, HSP90B1, PPP2R1A, HSP90AB1, PPP2CA, HSP90AA1, and CDK1 |
| mTOR signaling | 2.2×101 | MAPK1, PPP2CA, RPS23, EIF3C/EIF3CL, RPS11, RPS7, RHOG, RPS3A, EIF3B, EIF4G2, EIF3D, RPS20, EIF4B, RRAS, RAC1, EIF3E, EIF3M, RPS6, PPP2R1A, RPS4X, EIF4A3, RPS15, RPS25, RPS15A, RPSA, RPS27A, RPS18, RPS8, RPS13, FKBP1A, RPS21, EIF4G1, RPS17/RPS17L, RPS27, RPS9, EIF3A, RPS3, RPS5, RPS24, EIF3H, RHOC, RPS28, RPS2, RPS19, EIF3J, RPS12, EIF3G, EIF3F, RPS16, RPS26, EIF4A1, EIF3I, EIF3L, and RPS14 |
| Myc-mediated apoptosis signaling | 2.17 | YWHAQ, YWHAG, YWHAE, YWHAH, RRAS, YWHAB, YWHAZ, CYCS, and SFN |
| Myo-inositol biosynthesis | 6.64×10⁻¹ | IMPA1 |
| N-acetylglucosamine degradation I | 6.64×10⁻¹ | GNPDA1 |
| N-acetylglucosamine degradation II | 5.8×10⁻¹ | GNPDA1 |
| NAD biosynthesis III | 5.8×10⁻¹ | NAMPT |
| NAD phosphorylation and dephosphorylation | 2.84×10⁻¹ | ACP1 |
| NADH repair | 7.76×10⁻¹ | GAPDH |
| Netrin signaling | 3.88×10⁻¹ | RAC1, PRKAR2A, and PRKAR1A |
| Neuregulin signaling | 8.25×10⁻¹ | ITGB1, RPS6, HSP90B1, MAPK1, HSP90AB1, RRAS, ITGA2, and HSP90AA1 |
| Neuropathic pain signaling in dorsal horn neurons | 2.62×10⁻¹ | MAPK1, PDIA3, ITPR3, PRKAR2A, PRKAR1A, and CAMK2G |
| Neuroprotective role of THOP1 in Alzheimer’s disease | 6.77×10⁻¹ | YWHAE, HLA-A, PRKAR2A, and PRKAR1A |
| NF-κB activation by viruses | 3.49×10⁻¹ | ITGB1, MAPK1, RRAS, ITGA2, and ITGA6 |
| Nitric oxide signaling in the cardiovascular system | 1.12 | CALM1 (includes others), CALML5, HSP90B1, MAPK1, HSP90AB1, ITPR3, PRKAR2A, HSP90AA1, ATP2A2, and PRKAR1A |
| nNOS signaling in neurons | 5.19×10⁻¹ | CALM1 (includes others), CALML5, CAPNS1, and CAPN2 |
| nNOS signaling in skeletal muscle cells | 6.54×10⁻¹ | CALM1 (includes others), and CALML5 |
| Non-small cell lung cancer signaling | 2.66×10⁻¹ | MAPK1, PA2G4, RRAS, and ITPR3 |
| Noradrenaline and adrenaline degradation | 2.34 | ADH5, HSD17B10, AKR1A1, DHRS9, ALDH1A3, ALDH3A2, and ALDH9A1 |
| Nrf2-mediated oxidative stress response | 8.82 | USP14, MAPK1, PRDX1, PPIB, ACTA2, DNAJA1, CLPP, AKR1A1, SOD2, VCP, UBE2K, DNAJA3, DNAJA2, TXN, DNAJB1, CBR1, GSTK1, MGST1, SOD1, DNAJC9, RRAS, NQO1, ACTG1, TXNRD1, ERP29, STIP1, RBX1, DNAJB11, CAT, CCT7, SQSTM1, PTPLAD1, GSTP1, and FTH1 |
| Nur77 signaling in T-lymphocytes | 3.85×10⁻¹ | CALM1 (includes others), CALML5, HDAC2, and CYCS |
| Oncostatin M signaling | 4.85×10⁻¹ | MT2A, MAPK1, and RRAS |
| Oxidative ethanol degradation III | 1.9 | ACSL3, ALDH1A3, ALDH3A2, and ALDH9A1 |
| Oxidative phosphorylation | 1.31×101 | UQCRH, ATP5D, ATP5L, UQCRB, MT-CO2, ATP5H, NDUFA5, NDUFAB1, NDUFB6, ATP5F1, COX4I1, SDHA, ATP5J, COX7A2, COX6B1, COX17, ATP5O, ATP5A1, NDUFS3, ATP5C1, MT-ND1, NDUFB11, ATP5B, NDUFS8, UQCR10, CYC1, UQCRC2, COX5A, CYCS, UQCRC1, and COX5B |
| Oxidized GTP and dGTP detoxification | 7.76×10⁻¹ | RUVBL2 |
| P2Y purigenic receptor signaling pathway | 5.27×10⁻¹ | GNB1, MAPK1, RRAS, PDIA3, GNB2L1, GNB2, PRKAR2A, GNG12, and PRKAR1A |
| p53 signaling | 4.42×10⁻¹ | PRKDC, PCNA, GNL3, SERPINB5, SFN, ST13, and CTNNB1 |
| p70S6K signaling | 2.31 | YWHAG, YWHAH, YWHAE, MAPK1, EEF2, PPP2CA, RRAS, PDIA3, YWHAB, YWHAZ, YWHAQ, RPS6, PPP2R1A, SFN, and BCAP31 |
| PAK signaling | 2.25 | ITGB1, PXN, PAK2, CFL2, MAPK1, CFL1, MYL6, RRAS, MYL12B, ITGA2, RAC1, and CDC42 |
| Palmitate biosynthesis I (animals) | 9.39×10⁻¹ | FASN |
| Parkinson’s signaling | 1.9 | UCHL1, MAPK1, PARK7, and CYCS |
| Paxillin signaling | 3.06 | ITGB1, PXN, PAK2, MAPK1, RRAS, ACTA2, ITGA2, RAC1, ITGA6, TLN1, CDC42, ACTG1, VCL, ACTN4, and ACTN1 |
| PDGF signaling | 3.16×10⁻¹ | MAPK1, RRAS, ACP1, CSNK2A1, and CSNK2B |
| Pentose phosphate pathway | 2.54 | PGD, TKT, PGLS, and TALDO1 |
| Pentose phosphate pathway (non-oxidative branch) | 1.35 | TKT and TALDO1 |
| Pentose phosphate pathway (oxidative branch) | 1.51 | PGD and PGLS |
| Phenylalanine degradation I (aerobic) | 1.51 | PCBD1 and QDPR |
| Phenylalanine degradation IV (mammalian, via side chain) | 1.34 | ALDH3A2, GOT1, and GOT2 |
| Phenylethylamine degradation I | 6.64×10⁻¹ | ALDH3A2 |
| Phospholipase C signaling | 1.42 | PEBP1, RAP1B, ITGB1, CALML5, MYL6, MAPK1, HDAC2, RHOC, RRAS, GNB2L1, ITGA2, RAC1, GNB1, CALM1 (includes others), RHOG, AHNAK, MYL12B, ITPR3, GNB2, MARCKS, and GNG12 |
| PI3K signaling in B lymphocytes | 4.59×10⁻¹ | CD81, CALM1 (includes others), CALML5, MAPK1, RRAS, PDIA3, ITPR3, RAC1, and CAMK2G |
| PI3K/Akt signaling | 3.48 | ITGB1, CDC37, YWHAG, YWHAH, MAPK1, YWHAE, PPP2CA, RRAS, YWHAB, ITGA2, YWHAZ, YWHAQ, PPP2R1A, HSP90B1, HSP90AB1, HSP90AA1, SFN, and CTNNB1 |
| Polyamine regulation in colon cancer | 8.59×10⁻¹ | PSME1, CTNNB1, and PSME3 |
| PPAR signaling | 3.14×10⁻¹ | HSP90B1, IL18, MAPK1, HSP90AB1, RRAS, and HSP90AA1 |
| PPARΑ/RXRΑ activation | 7.8×10⁻¹ | CAND1, HSP90B1, HSP90AB1, MAPK1, ACAA1, GPD2, PDIA3, RRAS, FASN, ACOX1, PRKAR2A, HSP90AA1, GOT2, and PRKAR1A |
| Proline biosynthesis I | 3.1 | ALDH18A1, PYCR2, and PYCR1 |
| Proline biosynthesis II (from arginine) | 2.44 | OAT, PYCR2, and PYCR1 |
| Prostanoid biosynthesis | 1.02 | PTGES2 and PTGES3 |
| Prostate cancer signaling | 9.29×10⁻¹ | HSP90B1, MAPK1, PA2G4, HSP90AB1, RRAS, HSP90AA1, CTNNB1, and GSTP1 |
| Protein kinase A signaling | 4.07 | RAP1B, AKAP12, HIST1H1C, FLNB, PPP1CC, AKAP8, MAPK1, MYL6, YWHAH, PDIA3, GNB2L1, TIMM50, PPP1R14B, GNB1, YWHAQ, FLNA, PTPN1, CTNNB1, APEX1, VASP, GNG12, H1F0, PXN, CALML5, YWHAG, HIST1H1E, YWHAE, YWHAB, YWHAZ, PRKAR2A, PYGL, PYGB, CALM1 (includes others), FLNC, MYL12B, ACP1, ITPR3, GNB2, HIST1H1D, SFN, PRKAR1A, and CAMK2G |
| Protein ubiquitination pathway | 2.14×101 | PSMA3, USP5, PSMA7, SKP1, HSPA5, TCEB1, PSMC5, USP7, HSPA4, SUGT1, PSMC2, PSMA2, PSMA6, PSMB5, DNAJC9, HSPA9, PSMD5, PSMC4, PSMD6, TCEB2, PSMD3, HSPA8, PSMD11, PSMB2, RBX1, PSMD12, PSMA5, PSMB1, PSMA4, HSP90AA1, PSMD1, UBE2I, UBE2C, HSPB1, PSMB3, USP14, HLA-A, UBE2N, DNAJA1, PSMB6, USO1, UCHL1, HSP90B1, HSP90AB1, PSMC6, HSPE1, DNAJB1, PSMB4, UCHL3, UBE2M, PSMD13, HSPH1, PSMA1, HSPD1, PSMC1, PSME1, CUL2, PSMD2, DNAJB11, UBE2E2, UBA1, and PSMC3 |
| PTEN signaling | 7.92×10⁻¹ | ITGB1, MAPK1, YWHAH, RRAS, ITGA2, CSNK2A1, RAC1, CSNK2B, CDC42, and IGF2R |
| Purine nucleotides de novo biosynthesis II | 4.54 | ADSS, GMPS, IMPDH2, PAICS, ATIC, and GART |
| Purine nucleotides degradation II (aerobic) | 4.76×10⁻¹ | IMPDH2 and PNP |
| Purine ribonucleosides degradation to ribose-1-phosphate | 4.13×10⁻¹ | PNP |
| Putrescine degradation III | 1.12 | ALDH1A3, ALDH3A2, and ALDH9A1 |
| PXR/RXR activation | 4.38×10⁻¹ | CPT1A, PCK2, ALDH3A2, PRKAR2A, and PRKAR1A |
| Pyridoxal 5′-phosphate salvage pathway | 4.52×10⁻¹ | PDXK, PAK2, MAPK1, CSNK1A1, and CDK1 |
| Pyrimidine deoxyribonucleotides de novo biosynthesis I | 1.92 | DUT, AK1, NME1, RRM2, and RRM1 |
| Pyrimidine ribonucleotides de novo biosynthesis | 2.7×10⁻¹ | AK1 and NME1 |
| Pyrimidine ribonucleotides interconversion | 3.01×10⁻¹ | AK1 and NME1 |
| Pyruvate fermentation to lactate | 1.51 | LDHA and LDHB |
| Rac signaling | 3.91 | ITGB1, ACTR2, PAK2, CFL1, MAPK1, ARPC1B, RRAS, ITGA2, RAC1, IQGAP1, CDC42, ACTR3, CFL2, CD44, ARPC3, ARPC4, and NCKAP1 |
| Ran signaling | 1.27×101 | KPNB1, KPNA4, CSE1L, RCC1, TNPO1, KPNA2, RANGAP1, RAN, RANBP2, XPO1, RANBP1, KPNA1, and IPO5 |
| RAR activation | 7.8×10⁻¹ | MAPK1, RDH11, RAC1, PRKAR2A, SNW1, PSMC5, PARP1, PRMT1, DHRS9, RPL7A, ALDH1A3, CSNK2A1, CSNK2B, and PRKAR1A |
| Regulation of actin-based motility by Rho | 5.22 | ACTR2, PAK2, PFN1, MYL6, ARPC1B, CFL1, RHOC, ACTA2, RAC1, CDC42, ACTR3, RHOG, MYL12B, ARPC3, PFN2, ARHGDIA, and ARPC4 |
| Regulation of cellular mechanics by calpain protease | 5.37 | ITGB1, PXN, MAPK1, RRAS, ITGA2, TLN1, CDK1, CAPNS1, EZR, CAPN2, CAST, ACTN4, VCL, and ACTN1 |
| Regulation of EIF4 and p70S6K signaling | 3.32×101 | EIF1AY, MAPK1, PPP2CA, EIF1, RPS23, EIF3C/EIF3CL, RPS11, EIF2A, RPS7, RPS3A, EIF3B, EIF4G2, EIF3D, RPS20, PABPC1, RRAS, EIF3E, EIF3M, RPS6, PPP2R1A, RPS4X, EIF4A3, RPS15, RPS25, RPS15A, RPSA, RPS27A, RPS18, RPS8, RPS13, RPS21, RPS17/RPS17L, EIF4G1, EIF2S1, EIF2B2, RPS27, RPS9, EIF2S3, EIF3A, RPS3, RPS5, RPS24, ITGB1, EIF3H, RPS28, RPS2, ITGA2, RPS19, EIF3J, RPS12, EIF3G, EIF2S2, EIF3F, RPS16, RPS26, EIF4A1, EIF3I, EIF3L, and RPS14 |
| Regulation of IL-2 expression in activated and anergic T-lymphocytes | 2.96×10⁻¹ | CALM1 (includes others), CALML5, MAPK1, RRAS, and RAC1 |
| Relaxin signaling | 3.73×10⁻¹ | RAP1B, GNB1, MAPK1, GNB2L1, GNB2, PRKAR2A, APEX1, GNG12, and PRKAR1A |
| Remodeling of epithelial adherent junctions | 1.25×101 | ACTR2, NME1, TUBB3, ARPC1B, TUBB4B, MAPRE1, TUBB2A, ACTA2, RAB7A, TUBA4A, IQGAP1, TUBB, ACTG1, TUBA1B, ACTR3, TUBA1A, ARPC3, ZYX, TUBA1C, VCL, ACTN4, CTNNB1, ARPC4, and ACTN1 |
| Renal cell carcinoma signaling | 2.1 | PAK2, MAPK1, CUL2, RRAS, RBX1, RAC1, TCEB2, CDC42, FH, and TCEB1 |
| Renin-angiotensin signaling | 3.29×10⁻¹ | PAK2, MAPK1, RRAS, ITPR3, RAC1, PRKAR2A, and PRKAR1A |
| Retinoate biosynthesis I | 5.32×10⁻¹ | DHRS9, RDH11, and ALDH1A3 |
| Retinoic acid mediated apoptosis signaling | 2.47×10⁻¹ | ZC3HAV1, DAP3, CYCS, and PARP1 |
| Retinol biosynthesis | 4.64×10⁻¹ | DHRS9, RDH11, and ESD |
| RhoA signaling | 4.45 | ACTR2, PFN1, MYL6, CFL1, SEPT9, ARPC1B, ACTA2, SEPT7, RDX, ACTG1, KTN1, ACTR3, CFL2, MYL12B, EZR, PFN2, ARPC3, SEPT2, ARPC4, and MSN |
| RhoGDI signaling | 6.93 | GDI1, ARPC1B, MYL6, ACTA2, GNB2L1, CDC42, GNB1, ACTR3, RHOG, CFL2, EZR, ARPC3, GNG12, ITGB1, ACTR2, PAK2, CFL1, RHOC, ITGA2, RAC1, RDX, GDI2, ACTG1, MYL12B, CDH20, CD44, GNB2, ARHGDIA, ARPC4, and MSN |
| Role of CHK proteins in cell cycle checkpoint control | 6.47×10⁻¹ | PCNA, PPP2R1A, RFC4, PPP2CA, and CDK1 |
| Role of NFAT in cardiac hypertrophy | 9.11×10⁻¹ | CALML5, HDAC2, MAPK1, RRAS, PDIA3, GNB2L1, CSNK1A1, PRKAR2A, GNB1, CALM1 (includes others), ITPR3, GNB2, GNG12, CAMK2G, and PRKAR1A |
| Role of NFAT in regulation of the immune response | 3.63×10⁻¹ | GNB1, CALM1 (includes others), CALML5, MAPK1, RRAS, GNB2L1, ITPR3, GNB2, CSNK1A1, XPO1, and GNG12 |
| Role of p14/p19ARF in tumor suppression | 1 | NPM1, NPM3, RAC1, and SF3A1 |
| Role of tissue factor in cancer | 6.75×10⁻¹ | ITGB1, P4HB, CFL2, MAPK1, CFL1, RRAS, RAC1, ITGA6, and CDC42 |
| S-adenosyl-l-methionine biosynthesis | 7.76×10⁻¹ | MAT2A |
| Salvage pathways of pyrimidine deoxyribonucleotides | 3.74×10⁻¹ | CDA |
| Salvage pathways of pyrimidine ribonucleotides | 4.79×10⁻¹ | AK1, NME1, PAK2, MAPK1, CSNK1A1, CDA, and CDK1 |
| Selenocysteine biosynthesis II (archaea and eukaryotes) | 5.13×10⁻¹ | SARS |
| Semaphorin signaling in neurons | 2.5 | ITGB1, DPYSL2, RHOG, PAK2, CFL2, MAPK1, CFL1, RHOC, and RAC1 |
| Serine biosynthesis | 1.71 | PSAT1 and PHGDH |
| Serotonin degradation | 1.17 | ADH5, HSD17B10, AKR1A1, DHRS9, ALDH1A3, ALDH3A2, and ALDH9A1 |
| Serotonin receptor signaling | 5.08×10⁻¹ | SPR, PCBD1, and QDPR |
| Sertoli cell-Sertoli cell junction signaling | 4.78 | SPTBN1, MAPK1, ACTA2, TUBB, CDC42, CLDN4, TUBA1C, CTNNB1, ACTN1, ITGB1, PLS1, TUBB3, TUBB4B, RRAS, ITGA2, TUBB2A, TUBA4A, RAC1, PRKAR2A, YBX3, ACTG1, TUBA1B, TUBA1A, SPTAN1, ACTN4, and PRKAR1A |
| Signaling by Rho family GTPases | 5.41 | ARPC1B, SEPT9, MAPK1, MYL6, GNB2L1, ACTA2, CDC42, IQGAP1, GNB1, STMN1, RHOG, ACTR3, CFL2, EZR, ARPC3, GNG12, ITGB1, ACTR2, PAK2, CFL1, RHOC, SEPT7, ITGA2, RDX, RAC1, VIM, ACTG1, MYL12B, CDH20, GNB2, SEPT2, ARPC4, and MSN |
| S-methyl-5′-thioadenosine degradation II | 9.39×10⁻¹ | MTAP |
| Sonic hedgehog signaling | 5.83×10⁻¹ | PRKAR2A, CDK1, and PRKAR1A |
| Sorbitol degradation I | 1.23 | SORD |
| Sperm motility | 5.64×10⁻¹ | CALM1 (includes others), CALML5, TWF1, PDIA3, SLC12A2, ITPR3, PRKAR2A, PRDX6, and PRKAR1A |
| Spliceosomal cycle | 2.46 | U2AF2, and U2AF1 |
| Stearate biosynthesis I (animals) | 8.22×10⁻¹ | ACSL3, FASN, ELOVL1, and ACOT9 |
| Sucrose degradation V (mammalian) | 2.03 | TPI1, ALDOA, and ALDOC |
| Superoxide radicals degradation | 3.78 | SOD1, SOD2, CAT, and NQO1 |
| Superpathway of cholesterol biosynthesis | 1.52 | HADHB, NSDHL, DHCR7, ACAT1, and HADHA |
| Superpathway of citrulline metabolism | 1.34 | GLS, OAT, and ALDH18A1 |
| Superpathway of D-myo-inositol (1, 4, 5)-trisphosphate metabolism | 3.77×10⁻¹ | IMPA1 and BPNT1 |
| Superpathway of geranylgeranyl diphosphate biosynthesis I (via mevalonate) | 1 | HADHB, ACAT1, and HADHA |
| Superpathway of methionine degradation | 2.73 | PRMT5, DLD, GOT1, MAT2A, GOT2, PRMT1, and AHCY |
| Superpathway of serine and glycine biosynthesis I | 2.44 | PSAT1, PHGDH, and SHMT2 |
| Synaptic long term potentiation | 1.28 | RAP1B, PPP1CC, CALM1 (includes others), CALML5, MAPK1, RRAS, PDIA3, ITPR3, PRKAR2A, PPP1R14B, PRKAR1A, and CAMK2G |
| Systemic lupus erythematosus signaling | 2.18 | PRPF19, SNRPC, MAPK1, SNRPB, SNRPE, RRAS, HLA-A, PRPF8, SNRPF, HNRNPA2B1, LSM2, IL18, EFTUD2, SNRNP200, SNRNP70, SF3B4, SNRPD1, PRPF40A, SNRPD2, SNRPD3, NHP2L1, C6, and HNRNPC |
| TCA cycle II (eukaryotic) | 1.05×101 | SDHA, SUCLA2, CS, SUCLG1, DLST, ACO2, DLD, IDH3A, OGDH, MDH2, FH, MDH1, and IDH3B |
| Tec kinase signaling | 4.95×10⁻¹ | ITGB1, GNB1, RHOG, PAK2, RHOC, ACTA2, GNB2L1, ITGA2, GNB2, ACTG1, and GNG12 |
| Telomerase signaling | 1.12 | HSP90B1, PPP2R1A, HDAC2, MAPK1, HSP90AB1, PPP2CA, RRAS, DKC1, HSP90AA1, and PTGES3 |
| Telomere extension by telomerase | 2.01 | HNRNPA1, XRCC6, HNRNPA2B1, and XRCC5 |
| Tetrahydrobiopterin biosynthesis I | 7.76×10⁻¹ | SPR |
| Tetrahydrobiopterin biosynthesis II | 7.76×10⁻¹ | SPR |
| Tetrahydrofolate salvage from 5,10-methenyltetrahydrofolate | 2.72 | MTHFD2, MTHFD1, and GART |
| The visual cycle | 6.54×10⁻¹ | DHRS9 and RDH11 |
| Thioredoxin pathway | 1.35 | TXN and TXNRD1 |
| Thrombin signaling | 4.64×10⁻¹ | GNB1, RHOG, MYL6, MAPK1, MYL12B, RHOC, PDIA3, RRAS, ITPR3, GNB2L1, GNB2, GNG12, and CAMK2G |
| Thymine degradation | 6.64×10⁻¹ | DPYSL2 |
| Thyroid cancer signaling | 3.71×10⁻¹ | MAPK1, RRAS, and CTNNB1 |
| Thyroid hormone biosynthesis | 7.76×10⁻¹ | CTSD |
| Tight junction signaling | 4 | MYL6, PPP2CA, HSF1, ACTA2, VAPA, PRKAR2A, RAC1, YBX3, CDC42, ACTG1, CPSF6, PPP2R1A, CLDN4, NUDT21, MYH9, SAFB, VCL, SPTAN1, CTNNB1, CSTF3, VASP, and PRKAR1A |
| TNFR1 signaling | 2.74×10⁻¹ | PAK2, CYCS, and CDC42 |
| tRNA charging | 1.21×101 | CARS, IARS2, GARS, TARS, QARS, MARS, EPRS, FARSA, NARS, LARS, WARS, RARS, YARS, KARS, DARS, AARS, SARS, and IARS |
| Tryptophan degradation III (eukaryotic) | 2.97 | HSD17B10, HADHB, ACAT1, HSD17B4, HADHA, and HADH |
| Tryptophan degradation X (mammalian, via tryptamine) | 1.72 | AKR1A1, ALDH1A3, ALDH3A2, and ALDH9A1 |
| Tumoricidal function of hepatic natural killer cells | 7.77×10⁻¹ | M6PR, CYCS, and AIFM1 |
| Tyrosine biosynthesis IV | 6.64×10⁻¹ | PCBD1 |
| UDP-D-xylose and UDP-D-glucuronate biosynthesis | 9.39×10⁻¹ | UGDH |
| UDP-N-acetyl-D-galactosamine biosynthesis II | 2.72 | GNPNAT1, GNPDA1, GPI, and PGM3 |
| UDP-N-acetyl-D-glucosamine biosynthesis II | 1.35 | GNPNAT1 and PGM3 |
| Uracil degradation II (reductive) | 6.64×10⁻¹ | DPYSL2 |
| Urate biosynthesis/inosine 5′-phosphate degradation | 7×10⁻¹ | IMPDH2 and PNP |
| UVA-induced MAPK signaling | 3.43×10⁻¹ | MAPK1, RRAS, PDIA3, ZC3HAV1, CYCS, and PARP1 |
| Valine degradation I | 2.49 | HADHB, ECHS1, HIBADH, DLD, and HADHA |
| VEGF signaling | 4.6 | EIF1AY, PXN, MAPK1, YWHAE, RRAS, EIF1, ACTA2, EIF2S1, EIF2B2, ACTG1, ELAVL1, EIF2S2, EIF2S3, VCL, ACTN4, SFN, and ACTN1 |
| Virus entry via endocytic pathways | 5.41 | ITGB1, FLNB, AP2B1, AP2A1, RRAS, HLA-A, CLTC, ACTA2, ITGA2, ITGA6, RAC1, CDC42, ACTG1, CD55, FLNA, FLNC, CLTA, and TFRC |
| Vitamin-C transport | 7×10⁻¹ | TXN and TXNRD1 |
| Xanthine and xanthosine salvage | 1.23 | PNP |
| Xenobiotic metabolism signaling | 7.37×10⁻¹ | MGST1, MAPK1, PPP2CA, RRAS, NQO1, ALDH9A1, PTGES3, ESD, PPP2R1A, HSP90B1, HSP90AB1, ALDH1A3, RBX1, ALDH3A2, CAT, HSP90AA1, ALDH18A1, GSTP1, GSTK1, and CAMK2G |
| Zymosterol biosynthesis | 5.13×10⁻¹ | NSDHL |
Abbreviations: Akt, protein kinase B; ALDH, aldehyde dehydrogenase; AMPK, AMP-activated protein kinase; Arp–WASP, actin-related protein/Wiskott–Aldrich syndrome protein; ATM, ataxia telangiectasia-mutated; BMP, bone morphogenetic protein; cAMP, cyclic adenosine monophosphate; CCR, C-C chemokine receptor; CDC, cell division cycle; CDK, cyclin-dependent kinase; CHK, C-terminal Src kinase-homologous kinase; CTLA4, cytotoxic T-lymphocyte antigen 4; CXCR4, C-X-C chemokine receptor type 4; CREB, cAMP response element-binding protein; DARPP, dopamine- and cAMP-regulated phosphoprotein; dTMP, thymidine monophosphate; EGF, epidermal growth factor; EIF, eukaryotic initiation factor; eNOS, endothelial nitric oxide synthase; FAK, focal adhesion kinase; fMLP, N-formyl-methionyl-leucyl-phenylalanine; GABA, γ-aminobutyric acid; Gadd45, growth arrest DNA damage 45; GAS, interferon-γ activated sequence; GDNF, glial cell-derived neurotrophic factor; GM-CSF, granulocyte-macrophage colony-stimulating factor; GnRH, gonadotropin-releasing hormone; HGF, hepatocyte growth factor; HIF, hypoxia-inducible factor; HMGB1, high mobility group protein B1; HSP, heat shock protein; IGF, insulin-like growth factor; IL, interleukin; ILK, integrin-linked kinase; iNOS, inducible nitric oxide synthase; LPS, lipopolysaccharide; MAPK, mitogen-activated protein kinase; MIF, migration inhibitory factor; mTOR, mammalian target of rapamycin; NADPH, nicotinamide adenine dinucleotide phosphate; NAMPT, nicotinamide phosphoribosyltransferase; NFAT, nuclear factor of activated T-cell; NF-κB, nuclear factor-κB; nNOS, neuronal nitric oxide synthase; NQO1, NADPH: quinone oxidoreductase 1; Nrf2, Kelch-like ECH-associated protein 1 and Cullin 3; P2Y, purinergic G protein-coupled receptor; PAK, p21-activated kinase; PDGF, platelet-derived growth factor; PI3K, phosphoinositide 3-kinase; PLB, plumbagin; PPAR, peroxisome proliferator-activated receptor; PTEN, phosphatase and tensin-like protein; PXR, pregnane X receptor; RAR, retinoic acid receptor; RhoA, Ras homolog gene family, member A; RhoGDI, Rho GDP-dissociation inhibitor; RPS, ribosomal protein S; RXR, retinoid X receptor; S6K, S6 kinase; SOD, superoxide dismutase; THOP1, thimet oligopeptidase 1; TNFR, tumor necrosis factor receptor; TOB, transducer of ErbB2; UDP, uridine diphosphate; UVA, ultraviolet A; VEGF, vascular endothelial growth factor.
Table 6.
Potential molecular targets, signaling pathways, and cellular functions regulated by PLB in DU145 cells
| Ingenuity canonical pathways | LogP | Protein molecules |
|---|---|---|
| γ-Glutamyl cycle | 1.41 | GCLC |
| 14-3-3-mediated signaling | 5.5×10⁻¹ | PLCD1 |
| 3-Phosphoinositide biosynthesis | 4.52×10⁻¹ | PPP1R14B |
| 3-Phosphoinositide degradation | 4.78×10⁻¹ | PPP1R14B |
| Actin cytoskeleton signaling | 1.63 | PFN1, TMSB10/TMSB4X, and MSN |
| Adenine and adenosine salvage I | 2.25 | PNP |
| Adenine and adenosine salvage III | 1.71 | PNP |
| Adenosine nucleotides degradation II | 1.33 | PNP |
| Agranulocyte adhesion and diapedesis | 3.82×10⁻¹ | MSN |
| Aldosterone signaling in epithelial cells | 2.04 | PLCD1, DNAJB11, and HSP90AA1 |
| AMPK signaling | 4.98×10⁻¹ | FASN |
| Amyotrophic lateral sclerosis signaling | 6.16×10⁻¹ | SOD1 |
| Androgen signaling | 1.41 | CALML5 and HSP90AA1 |
| Antioxidant action of vitamin C | 6.2×10⁻¹ | PLCD1 |
| Arsenate detoxification I (glutaredoxin) | 1.95 | PNP |
| Aryl hydrocarbon receptor signaling | 4.85×10⁻¹ | HSP90AA1 |
| Aspartate biosynthesis | 2.07 | GOT2 |
| Aspartate degradation II | 1.71 | GOT2 |
| Axonal guidance signaling | 4.63×10⁻¹ | PLCD1 and PFN1 |
| B-cell receptor signaling | 4.06×10⁻¹ | CALML5 |
| Breast cancer regulation by stathmin 1 | 9.96×10⁻¹ | CALML5 and PPP1R14B |
| Calcium signaling | 1.05 | CALML5 and TPM3 |
| Calcium-induced T-lymphocyte apoptosis | 7.81×10⁻¹ | CALML5 |
| cAMP-mediated signaling | 3.35×10⁻¹ | CALML5 |
| Cardiac hypertrophy signaling | 8.85×10⁻¹ | PLCD1 and CALML5 |
| Cardiac β-adrenergic signaling | 5.03×10⁻¹ | PPP1R14B |
| Caveolar-mediated endocytosis signaling | 7.35×10⁻¹ | COPA |
| CCR3 signaling in eosinophils | 5.5×10⁻¹ | CALML5 |
| CCR5 signaling in macrophages | 7.52×10⁻¹ | CALML5 |
| CD28 signaling in T helper cells | 5.47×10⁻¹ | CALML5 |
| CDK5 signaling | 6.12×10⁻¹ | PPP1R14B |
| Cellular effects of sildenafil (Viagra) | 1.29 | PLCD1 and CALML5 |
| Chemokine signaling | 7.4×10⁻¹ | CALML5 |
| Citrulline biosynthesis | 1.65 | GLS |
| Clathrin-mediated endocytosis signaling | 3.89×10⁻¹ | CLTA |
| Corticotropin releasing hormone signaling | 5.66×10⁻¹ | CALML5 |
| CREB signaling in neurons | 1.08 | PLCD1 and CALML5 |
| CTLA4 signaling in cytotoxic T-lymphocytes | 6.57×10⁻¹ | CLTA |
| Dendritic cell maturation | 4×10⁻¹ | PLCD1 |
| D-myo-inositol (3,4,5,6)-tetrakisphosphate biosynthesis | 5.23×10⁻¹ | PPP1R14B |
| D-myo-inositol-5-phosphate metabolism | 1.22 | PLCD1 and PPP1R14B |
| D-myo-inositol (1,4,5)-trisphosphate biosynthesis | 1.13 | PLCD1 |
| D-myo-inositol (1,4,5,6)-tetrakisphosphate biosynthesis | 5.23×10⁻¹ | PPP1R14B |
| Dopamine receptor signaling | 7.04×10⁻¹ | PPP1R14B |
| Dopamine-DARPP32 feedback in cAMP signaling | 1.98 | PLCD1, CALML5, and PPP1R14B |
| EIF2 signaling | 7.34 | RPS28, RPL22, EIF4A3, RPL29, RPL21, RPS12, RPS14, and RPL10A |
| Endothelin-1 signaling | 4.14×10⁻¹ | PLCD1 |
| eNOS signaling | 1.22 | CALML5 and HSP90AA1 |
| Erk/MAPK signaling | 3.86×10⁻¹ | PPP1R14B |
| Eumelanin biosynthesis | 1.95 | MIF |
| Fatty acid biosynthesis initiation II | 2.25 | FASN |
| fMLP signaling in neutrophils | 5.8×10⁻¹ | CALML5 |
| FXR/RXR activation | 5.2×10⁻¹ | FASN |
| Gap junction signaling | 4.49×10⁻¹ | PLCD1 |
| Glioblastoma multiforme signaling | 4.7×10⁻¹ | PLCD1 |
| Glioma signaling | 6.28×10⁻¹ | CALML5 |
| Glucocorticoid receptor signaling | 2.81×10⁻¹ | HSP90AA1 |
| Gluconeogenesis I | 1.17 | ALDOA |
| Glutamate degradation II | 2.07 | GOT2 |
| Glutamate receptor signaling | 1.95 | CALML5 and GLS |
| Glutamine degradation I | 2.25 | GLS |
| Glutathione biosynthesis | 2.07 | GCLC |
| Glycolysis I | 1.17 | ALDOA |
| Granulocyte adhesion and diapedesis | 4.04×10⁻¹ | MSN |
| Granzyme A signaling | 4.63 | HIST1H1B, HIST1H1C, and HIST1H1E |
| Guanine and guanosine salvage I | 2.25 | PNP |
| Guanosine nucleotides degradation III | 1.44 | PNP |
| Gαq signaling | 4.68×10⁻¹ | CALML5 |
| HIF1α signaling | 5.97×10⁻¹ | HSP90AA1 |
| Huntington’s disease signaling | 8.63×10⁻¹ | CLTA and GLS |
| Hypoxia signaling in the cardiovascular system | 7.75×10⁻¹ | HSP90AA1 |
| ICOS–ICOSL signaling in T helper cells | 5.8×10⁻¹ | CALML5 |
| IL-8 signaling | 3.93×10⁻¹ | CSTB |
| ILK signaling | 1.81 | KRT18, TMSB10/TMSB4X, and PPP1R14B |
| iNOS signaling | 9.32×10⁻¹ | CALML5 |
| Insulin receptor signaling | 5.01×10⁻¹ | PPP1R14B |
| L-cysteine degradation I | 1.95 | GOT2 |
| Leptin signaling in obesity | 7.24×10⁻¹ | PLCD1 |
| Leukocyte extravasation signaling | 3.67×10⁻¹ | MSN |
| LXR/RXR activation | 5.38×10⁻¹ | FASN |
| Melatonin signaling | 1.78 | PLCD1 and CALML5 |
| MIF regulation of innate immunity | 9.61×10⁻¹ | MIF |
| MIF-mediated glucocorticoid regulation | 1.05 | MIF |
| Mitochondrial dysfunction | 4.16×10⁻¹ | VDAC2 |
| Mitotic roles of polo-like kinase | 7.69×10⁻¹ | HSP90AA1 |
| mTOR signaling | 3.73 | RPS28, EIF4A3, FKBP1A, RPS12, and RPS14 |
| Neuregulin signaling | 6.57×10⁻¹ | HSP90AA1 |
| Neuropathic pain signaling in dorsal horn neurons | 6.08×10⁻¹ | PLCD1 |
| Nitric oxide signaling in the cardiovascular system | 1.5 | CALML5 and HSP90AA1 |
| nNOS signaling in skeletal muscle cells | 1.38 | CALML5 |
| nNOS signaling in neurons | 9.05×10⁻¹ | CALML5 |
| Nrf2-mediated oxidative stress response | 1.85 | SOD1, DNAJB11, and GCLC |
| Nur77 signaling in T-lymphocytes | 8.28×10⁻¹ | CALML5 |
| Oncostatin M signaling | 1.04 | MT2A |
| P2Y purigenic receptor signaling pathway | 5.44×10⁻¹ | PLCD1 |
| p70S6K signaling | 5.44×10⁻¹ | PLCD1 |
| Palmitate biosynthesis I (animals) | 2.25 | FASN |
| Pentose phosphate pathway | 1.51 | G6PD |
| Pentose phosphate pathway (oxidative branch) | 1.85 | G6PD |
| Phenylalanine degradation IV (mammalian, via side chain) | 1.41 | GOT2 |
| Phospholipase C signaling | 3.07×10⁻¹ | CALML5 |
| Phospholipases | 8.28×10⁻¹ | PLCD1 |
| PI3K signaling in B-lymphocytes | 1.3 | PLCD1 and CALML5 |
| PI3K/Akt signaling | 5.32×10⁻¹ | HSP90AA1 |
| PPAR signaling | 6.32×10⁻¹ | HSP90AA1 |
| PPARΑ/RXRΑ activation | 3.83 | PLCD1, HELZ2, FASN, HSP90AA1, and GOT2 |
| Production of nitric oxide and reactive oxygen species in macrophages | 3.98×10⁻¹ | PPP1R14B |
| Prostate cancer signaling | 6.84×10⁻¹ | HSP90AA1 |
| Protein kinase A signaling | 3.15 | PLCD1, HIST1H1B, HIST1H1C, CALML5, HIST1H1E, and PPP1R14B |
| Protein ubiquitination pathway | 7.92×10⁻¹ | DNAJB11 and HSP90AA1 |
| Purine nucleotides degradation II (aerobic) | 1.26 | PNP |
| Purine ribonucleosides degradation to ribose-1-phosphate | 1.65 | PNP |
| RANK signaling in osteoclasts | 6.57×10⁻¹ | CALML5 |
| Regulation of actin-based motility by Rho | 6.44×10⁻¹ | PFN1 |
| Regulation of EIF4 and p70S6K signaling | 3.12 | RPS28, EIF4A3, RPS12, and RPS14 |
| Regulation of IL-2 expression in activated and anergic T-lymphocytes | 6.99×10⁻¹ | CALML5 |
| RhoA signaling | 1.33 | PFN1 and MSN |
| RhoGDI signaling | 4.12×10⁻¹ | MSN |
| Role of macrophages, fibroblasts, and endothelial cells in rheumatoid arthritis | 1.29 | PLCD1, CALML5, and MIF |
| Role of NFAT in cardiac hypertrophy | 1.04 | PLCD1 and CALML5 |
| Role of NFAT in regulation of the immune response | 4.16×10⁻¹ | CALML5 |
| Role of osteoblasts, osteoclasts and chondrocytes in rheumatoid arthritis | 3.35×10⁻¹ | CALML5 |
| Signaling by Rho Family GTPases | 3.14×10⁻¹ | MSN |
| Sperm motility | 1.35 | PLCD1 and CALML5 |
| Sphingosine-1-phosphate signaling | 5.76×10⁻¹ | PLCD1 |
| Stearate biosynthesis I (animals) | 1.03 | FASN |
| Sucrose degradation V (mammalian) | 1.6 | ALDOA |
| Superoxide radicals degradation | 1.78 | SOD1 |
| Superpathway of citrulline metabolism | 1.38 | GLS |
| Superpathway of inositol phosphate compounds | 9.96×10⁻¹ | PLCD1 and PPP1R14B |
| Superpathway of methionine degradation | 1.08 | GOT2 |
| Synaptic long-term depression | 4.8×10⁻¹ | PLCD1 |
| Synaptic long-term potentiation | 2.34 | PLCD1, CALML5, and PPP1R14B |
| Systemic lupus erythematosus signaling | 3.32×10⁻¹ | LSM2 |
| T-cell receptor signaling | 6.2×10⁻¹ | CALML5 |
| Telomerase signaling | 6.12×10⁻¹ | HSP90AA1 |
| Thrombin signaling | 3.79×10⁻¹ | PLCD1 |
| TR/RXR activation | 6.7×10⁻¹ | FASN |
| tRNA charging | 9.82×10⁻¹ | GARS |
| Urate biosynthesis/inosine 5′-phosphate degradation | 1.41 | PNP |
| UVA-induced MAPK signaling | 6.57×10⁻¹ | PLCD1 |
| Virus entry via endocytic pathways | 6.53×10⁻¹ | CLTA |
| Xanthine and xanthosine salvage | 2.55 | PNP |
| Xenobiotic metabolism signaling | 7.51×10⁻¹ | HSP90AA1 and GCLC |
| α-adrenergic signaling | 6.61×10⁻¹ | CALML5 |
Abbreviations: Akt, protein kinase B; ALDOA, fructose-bisphosphate aldolase A; AMPK, AMP-activated protein kinase; cAMP, cyclic adenosine monophosphate; CALML, calmodulin-like protein; CCR, C-C chemokine receptor; CDK, cyclin-dependent kinase; CREB, cAMP response element-binding protein; CTLA4, cytotoxic T-lymphocyte antigen 4; G6PD, glucose-6-phosphate 1-dehydrogenase; EIF, eukaryotic initiation factor; FASN, fatty acid synthase; fMLP, N-formyl-methionyl-leucyl-phenylalanine; FXR, farnesoid X receptor; HIF, hypoxia-inducible factor; HSP, heat shock protein; ICOS, inducible co-stimulator; ICOSL, ICOS ligand; IL, interleukin; ILK, integrin-linked kinase; iNOS, inducible nitric oxide synthase; LXR, liver X receptor; MAPK, mitogen-activated protein kinase; MIF, migration inhibitory factor; mTOR, mammalian target of rapamycin; NFAT, nuclear factor of activated T-cell; nNOS, neuronal nitric oxide synthase; Nrf2, Kelch-like ECH-associated protein 1 and Cullin 3; PI3K, phosphoinositide 3-kinase; PLB, plumbagin; PLCD, 1-phosphatidylinositol 4,5-bisphosphate phosphodiesterase-δ1; PPAR, peroxisome proliferator-activated receptor; RANK, receptor activator of nuclear factor-κB; RhoA, Ras homolog gene family, member A; RhoGDI, Rho GDP-dissociation inhibitor; RPS, ribosomal protein S; RXR, retinoid X receptor; SOD, superoxide dismutase; TR, thyroid hormone receptor; UVA, ultraviolet A.
PLB regulates cell cycle regulators of PC-3 cells
It has been reported that PLB-induced cell cycle arrest is an important contributor to PLB’s anticancer effect.30,46 We treated PC-3 and DU145 cells with 5 μM PLB for 24 hours and then cell samples were subject to quantitative proteomic analysis. The results showed that PLB regulated cell cycle at G1/S and G2/M DNA damage checkpoints in PC-3 cells with the involvement of a number of functional proteins (Table 5). These included RPL11, RPL5, HDAC2, PA2G4, GNL3, and SKP1 at G1/S checkpoint and YWHAQ, PRKDC, YWHAG, YWHAE, YWHAH, YWHAB, YWHAZ, SFN, SKP1, and CDK1 at G2/M checkpoint (Figure 10). However, the proteomic analysis did not reveal any remarkable effect of PLB on proteins that regulate cell cycle in DU145 cells.
Figure 10.

PLB regulates cell cycle at G2/M checkpoint in PC-3 cells.
Notes: PC-3 cells were treated with 5 μM PLB for 24 hours and the protein samples were subject to quantitative proteomic analysis. Red indicates an upregulation; green indicates a downregulation; brown indicates a predicted activation. The intensity of green and red molecule colors indicates the degree of down- or upregulation, respectively. Solid arrows indicates direct interaction.
Abbreviations: PLB, plumbagin; UV, ultraviolet.
PLB regulates apoptosis and autophagy in PC-3 and DU145 cells
Apoptosis and autophagy are two predominant programmed cell death pathways and they have been considered to be promising targets for the treatment of cancer via regulating mitochondria-dependent, mitochondria-independent, or PI3K/Akt/mTOR-mediated pathways.47–51 As shown in Tables 5 and 6, PLB regulated apoptotic signaling pathway and mitochondrial function involving a number of functional proteins. These included ACIN1, CAPNS1, MAPK1, RRAS, LMNA, CAPN2, SPTAN1, CYCS, CDK1, PARP1, AIFM1, HSD17B10, UQCRH, ATP5D, PRDX5, ATP5L, UQCRB, MT-CO2, ATP5H, VDAC2, PDHA1, NDUFA5, SOD2, PARK7, GPD2, NDUFAB1, CYB5R3, NDUFB6, OGDH, ATP5F1, COX4I1, AIFM1, SDHA, ATP5J, COX7A2, COX6B1, COX17, ATP5O, CPT1A, ATP5A1, VDAC3, NDUFS3, ATP5C1, FIS1, MT-ND1, PRDX3, NDUFB11, ATP5B, NDUFS8, UQCR10, CAT, UQCRC2, CYC1, COX5A, CYCS, VDAC1, UQCRC1, and COX5B. Notably, the proteomic analysis revealed a regulatory effect of PLB on apoptotic signaling pathways in PC-3 cells (Figure 11) but not in DU145 cells.
Figure 11.

PLB regulates apoptosis signaling pathway in PC-3 cells.
Notes: PC-3 cells were treated with 5 μM PLB for 24 hours and the protein samples were subject to quantitative proteomic analysis. Red indicates an upregulation; green indicates a downregulation. The intensity of green and red molecule colors indicates the degree of down- or upregulation, respectively. Solid arrows indicate direct interaction and dashed arrows indicate indirect interaction.
Abbreviation: PLB, plumbagin.
Moreover, Akt/mTOR signaling pathway plays a central role in the regulation of cell metabolism, growth, proliferation, and survival through the integration of both intracellular and extracellular signals.52 mTOR complex 1 and 2 are two distinct complexes in mTOR signaling pathway that transduce a variety of signals to downstream targets, including Akt, p70S6K, Atgs, eIF4G, PPAR-α, and PPAR-γ, to modulate cell growth, cell proliferation, energy metabolism, and autophagy.52 Aberrant mTOR signaling pathway has been implicated in the pathogenesis of many diseases including cancer, and targeting mTOR signaling pathway may be a promising strategy for cancer therapy.53 As showed in Figures 12 and 13, PLB exhibited a capability of modulating mTOR signaling pathway in both cell lines. The results showed that PLB decreased the expression of FKBP1, Rho, Rac, eIF3, eIF4B, and eIF4G, but increased the expression of Erk1/2, Ras, PP2, and eIF4A in PC-3 cells (Figure 12), whereas there were less targets regulated by PLB in DU145 cells, ie, only FKBP1, eIF4A, and 40S ribosome (Figure 13). Taken together, the results suggest that the regulatory effects of PLB on apoptosis, mitochondrial function, and mTOR signaling pathway contribute to the cancer cell killing of PLB in PC-3 and DU145 cells.
Figure 12.

mTOR signaling pathway regulated by PLB in PC-3 cells.
Notes: PC-3 cells were treated with 5 μM PLB for 24 hours and the protein samples were subject to quantitative proteomic analysis. Red indicates an upregulation; green indicates a downregulation. The intensity of green and red molecule colors indicates the degree of down- or upregulation, respectively. Solid arrows indicate direct interaction and dashed arrows indicate indirect interaction.
Abbreviation: PLB, plumbagin.
Figure 13.

mTOR signaling pathway regulated by PLB in DU145 cells.
Notes: DU145 cells were treated with 5 μM PLB for 24 hours and the protein samples were subject to quantitative proteomic analysis. Red indicates an upregulation; green indicates a downregulation. The intensity of green and red molecule colors indicates the degree of down- or upregulation, respectively. Solid arrows indicate direct interaction and dashed arrows indicate indirect interaction.
Abbreviation: PLB, plumbagin.
PLB regulates EMT pathways in PC-3 cells
EMT has a close association with cell migration and invasion and it plays an important role in cancer metastasis.21 Suppressing the progress of EMT will be clinically helpful for cancer therapy. We analyzed the effect of PLB on EMT-related proteins and signaling pathways using SILAC-based proteomic approach. The proteomic data showed that PLB regulated epithelial adherent junction signaling pathway in PC-3 cells involving a number of functional proteins. These included RAP1B, MYL6, ARPC1B, ACTA2, IQGAP1, TUBB, CDC42, ACTR3, ARPC3, TUBA1C, VCL, CTNNB1, ACTN1, ACTR2, TUBB3, LMO7, TUBB4B, RRAS, TUBB2A, TUBA4A, RAC1, ACTG1, TUBA1B, TUBA1A, MYH9, ZYX, ACTN4, and ARPC4 (Table 5; Figure 14); whereas the proteomic analysis did not show remarkable regulatory effect of PLB on EMT-associated proteins and signaling pathways in DU145 cells.
Figure 14.

PLB regulates epithelial adherent junction signaling pathway in PC-3 cells.
Notes: PC-3 cells were treated with 5 μM PLB for 24 hours and the protein samples were subject to quantitative proteomic analysis. Red indicates an upregulation; green indicates a downregulation; brown indicates a predicted activation. The intensity of green and red molecule colors indicates the degree of down- or upregulation, respectively. Solid arrows indicate direct interaction and dashed arrows indicate indirect interaction.
Abbreviation: PLB, plumbagin.
PLB regulates Sirt1-mediated pathways in PC-3 and DU145 cells
The Sirt family of proteins (Sirt1–7) encode a group of evolutionarily conserved, class III, and NAD+-dependent histone deacetylases involving many critical cellular processes, including cell cycle regulation, cell differentiation, genomic stability, tumorigenesis, oxidative stress response, aging, and energy metabolism through PPAR-, p53-, nuclear factor-κB (NF-κB)-, AMPK-, and mTOR-mediated signaling pathways.54 The proteomic data showed that PLB regulated NAD biosynthesis, phosphorylation, and dephosphorylation with the involvement of ACP1 and nicotinamide phosphoribosyltransferase (NAMPT) in PC-3 cells (Table 5). NAMPT, also known as pre-B-cell colony-enhancing factor 1 or visfatin, is a rate-limiting step in the NAD+ biosynthesis salvage pathway, and NAD+ is an essential substrate for Sirt1.55 Moreover, PLB treatment regulated the p53 signaling pathway with the involvement of PRKDC, PCNA, GNL3, SERPINB5, SFN, ST13, and CTNNB1, and modulated NF-κB signaling pathway with the involvement of ITGB1, MAPK1, RRAS, ITGA2, and ITGA6 in PC-3 cells (Table 5). Notably, PLB treatment regulated PPAR signaling pathway in both PC-3 and DU145 cells involving a number of protein molecules, such as HSP90B1, IL18, MAPK1, HSP90AB1, RRAS, and HSP90AA1(Tables 5 and 6). Taken together, the proteomic data suggest that PLB may exhibit a regulatory effect on Sirt1-mediated signaling pathways in both PC-3 and DU145 cells.
PLB regulates redox homeostasis involving ROS- and Nrf2-mediated signaling pathways in both PC-3 and DU145 cells
Our previous study has shown that induction of ROS generation and modulation of related signaling pathways contribute to the anticancer effects of PLB.30 In this study, we observed that PLB regulated several critical signaling pathways related to ROS generation and redox homeostasis in PC-3 and DU145 cells. Our quantitative proteomic study showed that PLB treatment regulated oxidative phosphorylation, nuclear factor erythroid 2-related factor 2 (Nrf2)-mediated oxidative stress response (Figures 15 and 16), and superoxide radical degradation in PC-3 and DU145 cells (Tables 5 and 6). A number of functional proteins – SOD1/2, GSTK1, GSTP1, MGST1, HSD17B10, DHRS9, AKR1A1, ADH5, ESD, ALDH1A3, 1L1, 3A2, 9A1 – were found to be involved in these pathways as well as 18A1, NQO1, and mitochondria complexes. Notably, Nrf2-mediated signaling pathway plays a critical role in the maintenance of intracellular redox homeostasis in response to various stimuli via regulating antioxidant responsive elements in the target genes.56,57 The proteomic data indicate that modulation of the expression of functional proteins involved in Nrf2-mediated signaling pathway may be an important contributor to the anticancer effect of PLB.
Figure 15.

PLB-regulated Nrf2-mediated oxidative stress response in PC-3 cells.
Notes: PC-3 cells were treated with 5 μM PLB for 24 hours and the protein samples were subject to quantitative proteomic analysis. Red indicates an upregulation; green indicates a downregulation; brown indicates a predicted activation. The intensity of green and red molecule colors indicates the degree of down- or upregulation, respectively. Solid arrows indicate direct interaction and dashed arrows indicate indirect interaction.
Abbreviations: PLB, plumbagin; UV, ultraviolet.
Figure 16.

PLB-regulated Nrf2-mediated oxidative stress response in DU145 cells.
Notes: DU145 cells were treated with 5 μM PLB for 24 hours and the protein samples were subject to quantitative proteomic analysis. Red indicates an upregulation; green indicates a downregulation. The intensity of green and red molecule colors indicates the degree of down- or upregulation, respectively. Solid arrows indicate direct interaction and dashed arrows indicate indirect interaction.
Abbreviations: PLB, plumbagin; UV, ultraviolet.
Differential responses to PLB treatment in PC-3 and DU145 cells
There were substantial differences in the response to PLB treatment between PC-3 and DU145 cells. In PC-3 cells, the PLB-regulated network of signaling pathways included granzyme A signaling pathway, remodeling of epithelial adherent junctions, Rho signaling pathway, endocytosis signaling pathway, integrin signaling pathway, protein ubiquitination signaling pathway, EIF4/p70 S6K signaling pathway, Nrf2-mediated signaling pathway, EIF2 signaling pathway, mTOR signaling pathway, mitochondrial dysfunction, fatty acid β-oxidation, tricarboxylic acid cycle, and glycolysis (Figure 8). These signaling pathways played a critical role in the regulation of cell proliferation, migration, and programmed cell death. In DU145 cells, different network of signaling pathways in response to the PLB treatment was observed. These mainly included palmitate biosynthesis, fatty acid biosynthesis, aspirate biosynthesis, L-cysteine degradation, glutamate degradation, PPAR-α/RXRα activation, protein kinase A signaling pathway, granzyme A signaling pathway, glutamate receptor signaling pathway, Nrf2-mediated signaling pathway, EIF2 signaling pathway, mTOR signaling pathway, and EIF4/p70 S6K signaling pathway. These pathways played important roles in the regulation of cell and energy metabolism, cell growth, cell survival, and programmed cell death.
Moreover, the proteomic data showed differences in the top five signaling pathways in response to PLB treatment in both cell lines (Tables 7 and 8). In PC-3 cells, the top five signaling pathways were EIF2 signaling pathway, EIF4/p70 S6K signaling pathway, mTOR signaling pathway, protein ubiquitination signaling pathway, and mitochondrial dysfunction signaling pathway (Table 7). In DU145 cells, the top five signaling pathways were EIF2 signaling pathway, granzyme A signaling pathway, PPAR-α/RXRα signaling pathway, mTOR signaling pathway, and protein kinase A signaling pathway (Table 8). mTOR signaling pathway was regulated by PLB in both cell lines, indicating that it may play a central role in the antiproliferative and autophagy-inducing effects of PLB in PC-3 and DU145 cells.
Table 7.
Top five canonical pathways regulated by PLB in PC-3 cells
| Ingenuity canonical pathways | P-value | Ratio (H/L) |
|---|---|---|
| EIF2 signaling | 9.19×10−66 | 94/201 (0.468) |
| Regulation of EIF4 and p70S6K signaling | 6.24×10⁻³⁴ | 59/175 (0.337) |
| mTOR signaling | 9.78×10⁻²³ | 54/213 (0.254) |
| Protein ubiquitination pathway | 4.1×10⁻²² | 62/270 (0.23) |
| Mitochondrial dysfunction | 5.53×10⁻²⁰ | 47/215 (0.219) |
Abbreviations: EIF, eukaryotic initiation factor; H, medium supplemented with stable isotope-labeled L-arginine and L-lysine; L, medium supplemented with normal L-arginine and L-lysine; mTOR, mammalian target of rapamycin; PLB, plumbagin.
Table 8.
Top five canonical pathways regulated by PLB in DU145 cells
| Ingenuity canonical pathways | P-value | Ratio (H/L) |
|---|---|---|
| EIF2 signaling | 4.61×10⁻⁸ | 8/185 (0.043) |
| Granzyme A signaling | 2.33×10⁻⁵ | 3/20 (0.15) |
| PPAR-α/RXRα activation | 1.47×10⁻⁴ | 5/179 (0.028) |
| mTOR signaling | 1.84×10⁻⁴ | 5/188 (0.027) |
| Protein kinase A signaling | 7.13×10⁻⁴ | 6/384 (0.016) |
Abbreviations: EIF, eukaryotic initiation factor; H, medium supplemented with stable isotope-labeled L-arginine and L-lysine; L, medium supplemented with normal L-arginine and L-lysine; mTOR, mammalian target of rapamycin; PLB, plumbagin; PPAR, peroxisome proliferator-activated receptor; RXR, retinoid X receptor.
Taken together, our proteomic study has revealed that a number of important proteins and their associated signaling pathways are regulated in PC-3 and DU145 cells in response to PLB. These cellular signaling pathways play pivotal roles in the regulation of cell cycle, apoptosis, autophagy, EMT, and oxidative stress with the involvement of a number of critical functional proteins, such as PI3K, mTOR, Akt, MAPK, CDKs, cytochrome c, and E-cadherin.
Verification of molecular targets of PLB in PC-3 and DU145 cells by Western blot assay
Our above bioinformatic and quantitative proteomic studies have predicted and shown that PLB can modulate a number of signaling pathways related to cell proliferation, cell migration, cell death, and cell survival. In the next set of functional validation experiments, in order to further verify the quantitative proteomic data, we tested how PLB affected the cell cycle, apoptosis, autophagy, EMT, and redox homeostasis and the related signaling pathways in PC-3 and DU145 cells.
PLB inhibits the proliferation of PC-3 and DU145 cells, and induces G2/M arrest in PC-3 cells and G1 arrest in DU145 cells via regulation of cyclin B1, cyclin D1, CDK1/CDC2, CDK2, p21 Waf1/Cip1, p27 Kip1, and p53
First, we examined the effect of PLB on cell cycle distribution using a flow cytometer in both cell lines. PLB showed differential effects on the cell cycle distribution in PC-3 and DU145 cells (Figure 17A and B). In PC-3 cells, PLB significantly induced a G2/M phase arrest. Compared with the control cells (20.1%), the percentage of PC-3 cells in G2/M phase was increased in a concentration-dependent manner after PLB treatment (Figure 17A and B). The percentage was 25.4%, 28.1%, 32.3%, and 38.5% when treated with PLB at 0.1, 1, 5, and 10 μM, respectively. PLB significantly decreased the percentage of PC-3 cells in G1 phase in comparison to the control cells. The basal level of PC-3 cells in G1 phase was 60.9%; after treatment with PLB at 0.1, 1, 5, and 10 μM for 24 hours, the percentage of PC-3 cells in G1 phase was 53.2%, 53.9%, 52.5%, and 47.5%, respectively. However, there was no significant difference observed in the number of cells in S phase in PC-3 cells when treated with PLB (Figure 17A and B).
Figure 17.

PLB inhibits the proliferation of PC-3 and DU145 cells, and induces G2/M arrest in PC-3 cells and G1 arrest in DU145 cells.
Notes: Cell cycle distribution of PC-3 and DU145 cells with the treatment of PLB at 0.1 to 10 μM for 24 hours. (A) Representative flow cytometric plots of cell cycle distribution of PC-3 and DU145, and (B) bar graphs showing the percentage of PC-3 and DU145 cells in G1, S, and G2 phases. Data are the mean ± standard deviation of three independent experiments. *P<0.05; **P<0.01; and ***P<0.001 by one-way analysis of variance.
Abbreviations: PI, propidium iodide; PLB, plumbagin.
We further conducted separate experiments to evaluate the effect of PLB treatment at 5 μM on cell cycle distribution in PC-3 cells over 72 hours. Compared to the control cells, the percentage of PC-3 cells in G2/M phase was increased from 23.5% at basal level to 28.6%, 28.8%, and 28.9% after 4, 8, and 12 hours treatment with 5 μM PLB and declined to 25.4%, 18.1%, and 17.6% after 24, 48, and 72 hours treatment of PLB, respectively (Figure 18A and B). While 5 μM PLB treatment decreased the percentage of PC-3 cells in G1 phase from 62.9% at basal level to 55.9%, 57.0%, and 56.0% after 4, 8, and 12 hours treatment and was increased to 59.3%, 72.4%, and 79.4% after 24, 48, and 72 hours drug treatment, respectively (Figure 18A and B). There was a significant decrease in the percentage of PC-3 cells in S phase after treatment with PLB for 48 and 72 hours.
Figure 18.

Inhibitory effect of PLB on the proliferation of PC-3 and DU145 cells over 72 hours.
Notes: The time course of PLB-induced cell cycle change over 72 hours in PC-3 and DU145 cells. (A) Representative flow cytometric plots of cell cycle distribution of PC-3 and DU145, and (B) bar graphs showing the percentage of PC-3 and DU145 cells in G1, S, and G2 phases. Data are the mean ± standard deviation of three independent experiments. *P<0.05; **P<0.01; and ***P<0.001 by one-way analysis of variance.
Abbreviations: PI, propidium iodide; PLB, plumbagin.
PLB exhibited a differential effect on the cell cycle distribution of DU145 cells. PLB significantly induced G1 arrest with an increase in the percentage of DU145 cells in G1 phase (Figure 17A and B). In comparison to the control cells (57.3%), the percentage of DU145 cells in G1 phase was increased in a concentration-dependent manner. The values were 58.6%, 55.2%, 67.8%, and 80.4% with the PLB treatment at concentrations of 0.1, 1, 5, and 10 μM, respectively. A significant reduction of the number of cells in G2/M phase was also observed after PLB treatment for 24 hours. The percentage was decreased from 28.9% (control) to 13.8% (10 μM PLB). In addition, when DU145 cells were treated with PLB at 1 and 5 μM for 24 hours, we observed a significant increase in the number of the cell population in S phase; however, incubation with 10 μM of PLB reduced the cell population in S phase (14.0% versus 5.9%) (P<0.001; Figure 17A and B).
In addition, treatment of DU145 cells with 5 μM PLB for 4, 8, 12, 24, 48, or 72 hours significantly increased the percentage of cells in S phase from 7.3% at basal level to 10.6%, 11.4%, 9.7%, 10.0%, 10.2%, and 12.7%, respectively (Figure 18A and B). Although there was no significant change in the percentage of DU145 cells in G2/M and G1 phase, there was an 8.8% and 22.9% decrease in the percentage of DU145 cells in G2/M phase observed when the cells were treated with 5 μM PLB for 48 and 72 hours, respectively.
To explore the mechanisms for PLB-induced effects on cell cycle arrest in PC-3 and DU145 cells, the expression levels of key regulators responsible for G1 and G2 checkpoints were examined using Western blot assay. Cyclin B1 and CDK1/CDC2 are two key regulators for G2 to M phase transition55 and thus their expression levels were determined in PC-3 cells. The expression of cyclin B1 was significantly suppressed in PC-3 cells with the treatment of PLB at concentrations of 0.1, 1, and 5 μM for 24 hours (P<0.001; Figure 19A and B). In comparison to the control cells, the expression level of cyclin B1 in PC-3 cells was decreased 2.1-fold when treated with 5 μM PLB for 24 hours. There was a 21.3% and 23.5% reduction in the expression level of CDK1/CDC2 in PC-3 cells incubated with PLB at 1 and 5 μM for 24 hours, respectively (P<0.05 and P<0.01, respectively; Figure 19A and B). However, there was no significant change in the expression level of CDK2 and cyclin D1 when PC-3 cells were treated with PLB at 0.1, 1, and 5 μM for 24 hours (P>0.05; Figure 19A and B).
Figure 19.

PLB regulates the expression of CDK1/CDC2, cyclin B1, CDK2, cyclin D1, p21 Waf1/Cip1, p27 Kip1, and p53 in PC-3 cells.
Notes: PC-3 cells were treated with PLB at 0.1, 1, and 5 μM for 24 hours and protein samples were subject to Western blot assay. (A) Representative blots of CDK1/CDC2, cyclin B1, CDK2, cyclin D1, p21 Waf1/Cip1, p27 Kip1, p53, and β-actin in PC-3 cells, and (B) bar graphs showing the relative levels of CDK1/CDC2, cyclin B1, CDK2, cyclin D1, p21 Waf1/Cip1, p27 Kip1, and p53 in PC-3 cells. Data are the mean ± standard deviation of three independent experiments. *P<0.05; **P<0.01; and ***P<0.001 by one-way analysis of variance.
Abbreviation: PLB, plumbagin.
In DU145 cells, the expression levels of key regulators for G1 to S transition including CDK2 and cyclin D1 were determined. A significant inhibitory effect of PLB on the expression of CDK2 and cyclin D1 was observed, which was in a concentration-dependent manner (Figure 20A and B). Treatment of DU145 cells with PLB at 1 and 5 μM for 24 hours resulted in a 42.1% and 42.0% decrease in the expression of cyclin D1, respectively (P<0.05). A similar inhibitory effect on the expression of CDK2 was also observed (P<0.01; Figure 20A and B). A low concentration of PLB (0.1 μM) only slightly decreased the expression of cyclin D1 and CDK2 in DU145 cells. Incubation of DU145 cells with PLB did not significantly alter the expression level of cyclin B1 and CDC2 (P<0.05; Figure 20A and B).
Figure 20.

PLB regulates the expression of CDK1/CDC2, cyclin B1, CDK2, cyclin D1, p21 Waf1/Cip1, p27 Kip1, and p53 in DU145 cells.
Notes: DU145 cells were treated with PLB at 0.1, 1, and 5 μM for 24 hours and protein samples were subject to Western blot assay. (A) Representative blots of CDK1/CDC2, cyclin B1, CDK2, cyclin D1, p21 Waf1/Cip1, p27 Kip1, p53, and β-actin in DU145 cells, and (B) bar graphs showing the relative levels of CDK1/CDC2, cyclin B1, CDK2, cyclin D1, p21 Waf1/Cip1, p27 Kip1, and p53 in DU145 cells. Data are the mean ± standard deviation of three independent experiments. *P<0.05; **P<0.01; and ***P<0.001 by one-way analysis of variance.
Abbreviation: PLB, plumbagin.
These results have demonstrated that PLB could downregulate CDK1/CDC2, CDK2, cyclin B1, and cyclin D1 in PC-3 and DU145 cells with differential effects. This would contribute to the cell cycle arrest in both cell lines when exposed to PLB.
To further elucidate the mechanisms for the effect of PLB on cell cycle, the expression levels of p21 Waf1/Cip1, p27 Kip1, and p53 in PC-3 and DU145 cells treated with PLB were determined using Western blot assay. The tumor suppressor protein p21 Waf1/Cip1 acts as an inhibitor of cell cycle progression, and it serves to inhibit kinase activity and block progression through G1/S in association with CDK2 complexes.59 During cell cycle stages when CDC2/cyclin B or CDK2/cyclin A are active, p53 is phosphorylated and upregulates p21 Waf1/Cip1 transcription via a p53-responsive element. p27 Kip1 is a member of the Cip/Kip family of cyclin-dependent kinase inhibitors.60 Like p57 Kip2 and p21 Waf1/Cip1, p27 Kip1 enforces the G1 restriction point via its inhibitory binding to CDK2/cyclin E and other CDK/cyclin complexes.60 p53 is a tumor suppressor protein that plays a major role in cellular response to DNA damage and other genomic aberrations.61 Activation of p53 can lead to either cell cycle arrest and DNA repair or apoptosis. p53 is phosphorylated at multiple sites and by several different protein kinases. DNA damage induces phosphorylation of p53 at Ser15 and Ser20 and leads to a reduced interaction between p53 and its negative regulator, mouse double minute 2 homolog.61 As shown in Figure 19A and B, the expression level of p21 Waf1/Cip1 was concentration-dependently increased in PC-3 cells when treated with PLB for 24 hours. In comparison to the control cells, there was a 1.7- and 1.9-fold increase in the expression of p21 Waf1/Cip1 in PC-3 cells treated with PLB at 1 and 5 μM for 24 hours, respectively (P<0.05; Figure 19A and B), and the expression level of p27 Kip1 was increased 1.5- and 1.8-fold in DU145 cells treated with PLB at 1 and 5 μM, respectively. In addition, there was a significant increase (greater than twofold) in the expression level of p21 Waf1/Cip1 in DU145 cells after treatment with PLB at 5 μM for 24 hours (P<0.05; Figure 20A and B). Moreover, there was a 2.9- and 1.9-fold increase in the expression level of p53 in PC-3 and DU145 cells when treated with 5 μM PLB for 24 hours, respectively (P<0.01; Figures 19 and 20).
These results demonstrate that PLB can upregulate p21 Waf1/Cip1, p27 Kip1, and p53 in PC-3 and DU145 cells. This will contribute to the cell cycle arrest and apoptosis induced by PLB. Importantly, these results have confirmed the regulatory effect of PLB on cell proliferation-related signaling pathways which was predicted by our bioinformatic study and revealed by our SILAC-based proteomic experiment.
PLB induces apoptosis via mitochondrial pathway and autophagy via modulation of PI3K/Akt/mTOR pathway
Apoptosis and autophagy, two types of predominant programmed cell death, have been found to be potential targets of PLB for its cancer cell killing effect.30 We have observed that PLB significantly induces apoptosis and autophagy in PC-3 and DU145 cells in concentration- and time-dependent manners. The apoptosis and autophagy inducing effects of PLB may be through mitochondrial- and mTOR-mediated pathways. It has been reported that PI3K, mTOR, Akt, and p38MAPK are the upstream regulatory factors of apoptosis and autophagy, and cytochrome c is a responsive effector to the variations in PI3K/Akt/mTOR and p38MAPK signaling pathways initiating mitochondria-dependent apoptosis.47,62,63 Released cytochrome c triggers the activation of caspase family, such as caspase 9 and its downstream caspase 3, and shifting the balance of antiapoptotic to proapoptotic status with the involvement of Bcl-2 family proteins contributes to apoptosis. Inhibition of PI3K/Akt/mTOR axis can remarkably promote autophagy.
Following the verification of the inhibitory effect of PLB on cell cycle, we further tested the effect of PLB on the expression and phosphorylation of PI3K, mTOR, Akt, p38MAPK, cytochrome c, caspase 9, caspase 3, Bcl-2, and BAX in PC-3 and DU145 cells. Cells were treated with PLB at concentrations of 0.1, 1, and 5 μM for 24 hours. There was a significant decrease in the phosphorylation level of PI3K, mTOR, and Akt (Figures 21 and 22) after PC-3 and DU145 cells were treated with PLB. In PC-3 cells with the treatment of PLB at 0.1, 1, and 5 μM, the phosphorylation level of PI3K decreased 26.6%, 34.9%, and 35.5%, the phosphorylation level of Akt reduced 20.1%, 28.4%, and 34.3%, and phosphorylation level of mTOR dropped 12.9%, 11.5%, and 31.3%, respectively (Figure 21A and B). Similarly, the phosphorylation level of PI3K reduced 13.4%, 28.1%, and 35.4%, the phosphorylation level of Akt dropped 46.9%, 58.7%, and 58.0%, and phosphorylation level of mTOR decreased 26.9%, 27.9%, and 36.0%, respectively (Figure 22A and B). Moreover, the phosphorylation of p38MAPK decreased 25.0%, 40.0%, and 50.7% in PC-3 cells (Figure 21A and B) and 37.6%, 57.4%, and 63.9% in DU145 cells (Figure 22A and B) when treated with PLB at 0.1, 1, and 5 μM, respectively, for 24 hours.
Figure 21.


Effects of PLB treatment on the expression and phosphorylation levels of PI3K, Akt, mTOR, p38MAPK, and cytochrome c in PC-3 cells.
Notes: PC-3 cells were treated with PLB at 0.1, 1, and 5 μM for 24 hours and protein samples were subject to Western blot assay. (A) Representative blots of p- and t-PI3K, p- and t-Akt, p- and t-mTOR, p- and t-p38MAPK, and cytochrome c in PC-3 cells, and (B) bar graphs showing the relative levels of p/t-PI3K, p/t-Akt, p/t-mTOR, p/tp38MAPK, and cytochrome c in PC-3 cells. Data are the mean ± standard deviation of three independent experiments. *P<0.05; **P<0.01; and ***P<0.001 by one-way analysis of variance.
Abbreviation: PLB, plumbagin.
Figure 22.
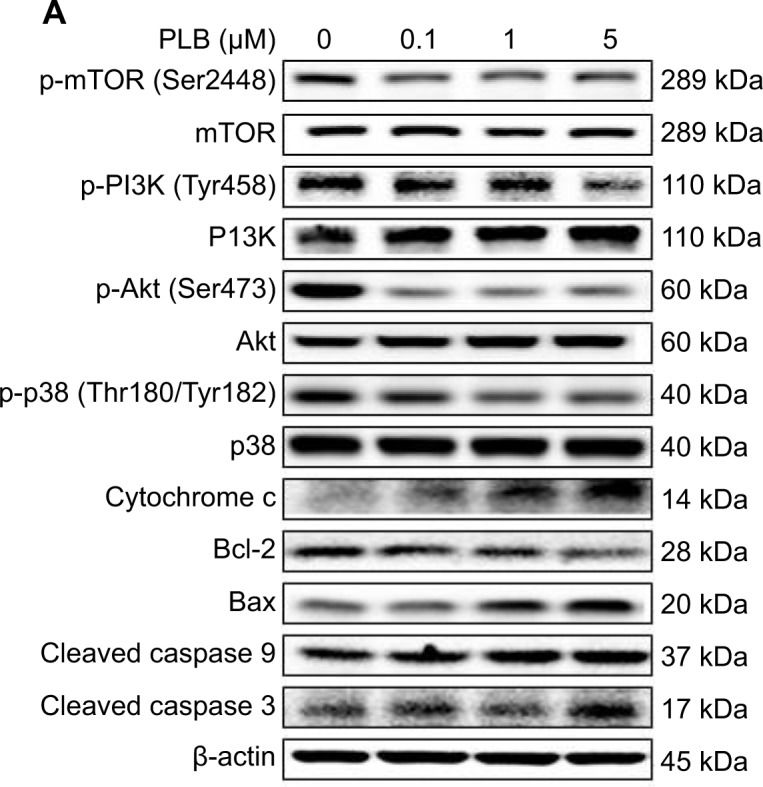

Effects of PLB treatment on the expression and phosphorylation levels of PI3K, Akt, mTOR, p38MAPK, and cytochrome c in DU145 cells.
Notes: DU145 cells were treated with PLB at 0.1, 1, and 5 μM for 24 hours and protein samples were subject to Western blot assay. (A) Representative blots of p- and t-PI3K, p- and t-Akt, p- and t-mTOR, p- and t-p38MAPK, and cytochrome c in DU145 cells, and (B) bar graphs showing the relative levels of p/t-PI3K, p/t-Akt, p/t-mTOR, p/tp38MAPK, and cytochrome c in DU145 cells. Data are the mean ± standard deviation of three independent experiments. *P<0.05; **P<0.01 by one-way analysis of variance.
Abbreviation: PLB, plumbagin.
On the other hand, the expression of cytochrome c was significantly increased in PC-3 and DU145 cells with the treatment of PLB (Figures 21 and 22). Increased release of cytochrome c initiates mitochondria-dependent apoptosis through the sequential activation of caspase family and interruption of the balance of antiapoptotic (Bcl-2) and proapoptotic (BAX) proteins. As shown in Figures 21 and 22, incubation of PC-3 and DU145 cells with PLB significantly increased the cleaved level of caspase 9 and caspase 3. In PC3 cells, there was 1.6-, 2.1-, and 2.6-fold increase in cleaved level of caspase 9, and 1.3-, 1.3-, and 1.8-fold rise in cleaved level of caspase 3 when treated with PLB at 0.1, 1, and 5 μM, respectively (Figure 21A and B). Similarly, when DU145 cells were treated with PLB at 0.1, 1, and 5 μM, there was 1.2-, 1.4-, and 1.9-fold increase in cleaved level of caspase 9, and 1.1-, 1.4-, and 2.0-fold elevation in cleaved level of caspase 3, respectively (Figure 22A and B). Moreover, the ratio of Bcl2 over BAX was significantly decreased in both cells treated with PLB. The ratio was decreased 42.4%, 52.0%, and 63.7% in PC-3 cells (Figure 21A and B) and 21.2%, 70.5%, and 80.9% in DU145 cells (Figure 22A and B) with the treatment of PLB at 0.1, 1, and 5 μM, respectively. These results clearly showed that PLB induced apoptosis via mitochondrial pathway and autophagy via PI3K/mTOR pathway in PC-3 and DU145 cells, and these data are in agreement with our proteomic findings.
PLB inhibits EMT in PC-3 and DU145 cells
EMT is a critical process involving the initiation, growth, invasion, and metastasis of cancer.20,21,64 EMT depends on a reduction in expression of cell adhesion molecules. E-cadherin is considered an active suppressor of invasion and growth of many epithelial cancers. Tight junctions, or zonula occludens, form a continuous barrier to fluids across the epithelium and endothelium.20,21,64 They function in regulation of paracellular permeability and in the maintenance of cell polarity, blocking the movement of transmembrane proteins between the apical and the basolateral cell surfaces. Tight junctions are composed of claudin and occludin proteins, which join the junctions to the cytoskeleton. ZO-1, 2, and 3 are peripheral membrane adaptor proteins that link junctional transmembrane proteins such as occludin and claudin to the actin cytoskeleton.20–22,64 Cadherins are a superfamily of transmembrane glycoproteins that contain cadherin repeats of approximately 100 residues in their extracellular domain. They mediate calcium-dependent cell–cell adhesion and the classic cadherin subfamily includes N-, P-, R-, B-, and E-cadherins.20,21 The cytoplasmic domain of classical cadherins interacts with β-catenin, γ-catenin, and p120 catenin. Cancer cells often have upregulated N-cadherin in addition to loss of E-cadherin.20–22 Herein, we examined the effect of PLB treatment on EMT-associated markers in PC-3 and DU145 cells using Western blot assay. Incubation of PC-3 cells with PLB resulted in a concentration-dependent increase in the expression level of E-cadherin and decrease in the expression level of N-cadherin (Figure 23A and B). There was a 1.3- and 1.4-fold increase in the expression of E-cadherin when treated with 1 and 5 μM PLB for 24 hours, respectively; whereas 5 μM PLB suppressed 30.3% expression level of N-cadherin (P<0.05; Figure 23A and B). Consequently, with increasing concentration of PLB, an increased ratio of E-cadherin over N-cadherin was observed. The E-cadherin/N-cadherin ratio was increased from 1.4 at basal level to 1.7, 2.4, and 3.0, when PC-3 cells were treated with 0.1, 1 and 5 μM PLB for 24 hours, respectively (P<0.05; Figure 23A and B). In DU145 cells, there was a 1.6- and 1.5-fold increase in the expression of E-cadherin when cells were treated with 1 and 5 μM PLB, respectively (Figure 24A and B). Meanwhile, PLB decreased the expression of N-cadherin, but no significant effect was observed. However, the E-cadherin/N-cadherin ratio was increased from 1.1 to 1.4, 1.9, and 2.0, when DU145 cells were treated with 0.1, 1, and 5 μM PLB, respectively (P<0.05; Figure 24A and B).
Figure 23.

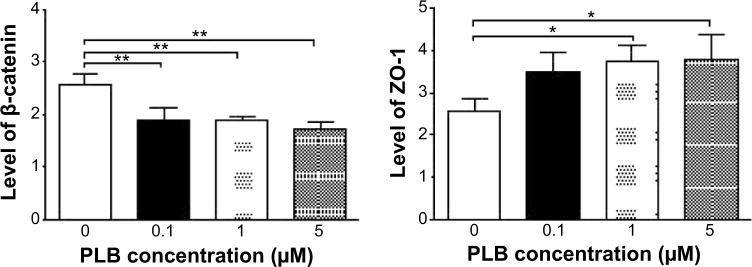
Dose effect of PLB on the expression level of selected EMT markers in PC-3 cells.
Notes: PC-3 cells were treated with PLB at 0.1, 1, and 5 μM for 24 hours and protein samples were subject to Western blot assay. (A) Representative blots of E-cadherin, N-cadherin, snail, slug, TCF-8/ZEB1, vimentin, β-catenin, ZO-1, and β-actin in PC-3 cells treated with PLB at 0.1, 1, and 5 μM for 24 hours, and (B) bar graphs showing the levels of E-cadherin, N-cadherin, snail, slug, TCF-8/ZEB1, vimentin, β-catenin, and ZO-1 in PC-3 cells. Data represent the mean ± standard deviation of three independent experiments.*P<0.05; **P<0.01; ***P<0.001 by one-way analysis of variance.
Abbreviations: EMT, epithelial–mesenchymal transition; PLB, plumbagin.
Figure 24.


Dose-effect of PLB on the expression level of selected EMT markers in DU145 cells.
Notes: DU145 cells were treated with PLB at 0.1, 1, and 5 μM for 24 hours and protein samples were subject to Western blot assay. (A) Representative blots of E-cadherin, N-cadherin, snail, slug, TCF-8/ZEB1, vimentin, β-catenin, ZO-1, and β-actin in DU145 cells treated with PLB at 0.1, 1, and 5 μM for 24 hours, and (B) bar graphs showing the levels of E-cadherin, N-cadherin, snail, slug, TCF-8/ZEB1, vimentin, β-catenin, and ZO-1 in DU145 cells. Data represent the mean ± standard deviation of three independent experiments. *P<0.05; **P<0.01; ***P<0.001 by one-way analysis of variance.
Abbreviations: EMT, epithelial–mesenchymal transition; PLB, plumbagin.
In order to further examine the effect of PLB on EMT in PC-3 and DU145 cells, we measured the expression levels of several key regulators of E-cadherin. Snail and slug (both zinc finger transcriptional factors) together with TCF8/ZEB1 are suppressors of E-cadherin in EMT.20,21 In addition, snail blocks the cell cycle and confers resistance to cell death, and slug protects damaged cells from apoptosis by repressing p53-induced transcription of the proapoptotic Bcl-2 family protein PUMA.20,21 PLB significantly reduced the expression level of snail and slug in both cell lines (Figures 23 and 24). In PC-3 cells, 5 μM PLB significantly suppressed the expression level of snail by 19.6%, 30.8%, and 35.4%, and of slug by 29.2%, 40.0%, and 37.6% when treated with 0.1, 1, and 5 μM PLB for 24 hours, respectively (P<0.01; Figure 23A and B). In DU145 cells, 1 and 5 μM PLB significantly suppressed the expression level of snail by 21.8% and 28.9%, respectively. Treatment of cells with 5 μM PLB for 24 hours significantly reduced the expression level of slug by 38.1% (P<0.05; Figure 24A and B). Furthermore, PLB induced a concentration-dependent reduction in the expression level of TCF-8/ZEB1 in PC-3 and DU145 cells. In PC-3 cells, 1 and 5 μM PLB significantly suppressed the expression level of TCF-8/ZEB1 by 36.2% and 51.7%, respectively (Figure 23A and B). Similarly, there was a 57.5% reduction in the expression of TCF-8/ZEB1 in DU145 cells treated with 5 μM of PLB (P<0.001; Figure 24A and B).
Vimentin is a type III intermediate filament protein that is expressed in mesenchymal cells.20–22,64 β-catenin can act as an integral component of a protein complex in adherent junctions that helps cells maintain epithelial layers, and β-catenin participates in the Wnt signaling pathway as a downstream target.22,64 Treatment of cells with 5 μM PLB significantly suppressed the expression level of vimentin by 36.0% in PC-3 cells (P<0.05; Figure 23A and B). PLB at 0.1 and 1 μM reduced vimentin level by 23.8%−26.4%, but did not achieve statistical significance. In DU145 cells, treatment with PLB at 0.1, 1, and 5 μM for 24 hours resulted in a 10.0%, 19.3%, and 29.7% reduction in vimentin expression levels, respectively (P<0.05–0.001; Figure 24A and B).
There was a significant reduction in the expression level of β-catenin in both cell lines treated with PLB at 0.1, 1, and 5 μM for 24 hours. PLB at 0.1, 1, and 5 μM significantly decreased the expression level of β-catenin by 25.7%, 26.2%, and 32.6% in PC-3 cells, respectively (Figure 23A and B), and 1 and 5 μM PLB significantly reduced β-catenin expression by 21.0% and 47.5% in DU145 cells, respectively (Figure 24A and B).
Furthermore, we examined the time course of the effect of PLB on the expression of selected EMT markers in PC-3 and DU145 cells over 48 hours. There was a significant inhibitory effect of PLB on EMT in both cells (Figures 25 and 26). In comparison to the control cells, treatment of PC-3 cells with 5 μM PLB significantly increased the expression of E-cadherin by 1.7- and 2.4-fold, while the expression of N-cadherin was decreased by 49.2% and 58.1% after 24 and 48 hours, respectively, which in turn led to a significant increase in the ratio of E-cadherin over N-cadherin. The expression of vimentin was significantly decreased by 40.0% and 51.4% with the 5 μM PLB treatment for 24 and 48 hours, respectively. Moreover, the expression of β-catenin was reduced by 4.06% and 41.7% with the 5 μM PLB treatment for 24 and 48 hours, respectively (Figure 25A and B). In DU145 cells, incubation with 5 μM PLB for 24 and 48 hours led to a 2.0- and 2.3-fold increase in the expression of E-cadherin, respectively, and resulted in a 38.8% and 45.3% reduction in the expression of N-cadherin compared to the control cells, respectively. Consequently, it led to an increase in the ratio of E-cadherin over N-cadherin. Moreover, treatment of DU145 cells with 5 μM of PLB induced a time-dependent decrease in the expression of β-catenin and vimentin by 42.8% and 48.6%, and 30.9% and 40.8%, to 24 hour and 48 hour treatment, respectively (Figure 26A and B).
Figure 25.

Effects of PLB on the expression level of selected EMT markers in PC-3 cells over 48 hours.
Notes: PC-3 cells were treated with 5 μM PLB over 48 hours and protein samples were subject to Western blot assay. (A) Representative blots of E-cadherin, N-cadherin, vimentin, β-catenin, and β-actin in PC-3 cells, and (B) bar graphs showing the levels of E-cadherin, N-cadherin, vimentin, and β-catenin in PC-3 cells. Data represent the mean ± standard deviation of three independent experiments. *P<0.05; **P<0.01; ***P<0.001 by one-way analysis of variance.
Abbreviations: EMT, epithelial–mesenchymal transition; PLB, plumbagin.
Figure 26.

Effects of PLB on the expression level of selected EMT markers in DU145 cells over 48 hours.
Notes: DU145 cells were treated with 5 μM PLB over 48 hours and protein samples were subject to Western blot assay. (A) Representative blots of E-cadherin, N-cadherin, vimentin, β-catenin, and β-actin in DU145 cells, and (B) bar graphs showing the levels of E-cadherin, N-cadherin, vimentin, and β-catenin in DU145 cells. Data represent the mean ± standard deviation of three independent experiments. *P<0.05; **P<0.01 by one-way analysis of variance.
Abbreviations: EMT, epithelial–mesenchymal transition; PLB, plumbagin.
Finally, the expression of ZO-1 was examined in PC-3 and DU145 cells exposed to PLB. ZO-1 and -2 are required for tight junction formation and function. In subconfluent proliferating cells, ZO-1 and ZO-2 have been shown to colocalize to the nucleus and play a role in transcriptional regulation, possibly through facilitating nuclear import/export of transcriptional regulators.18,46 There was a significant effect of PLB on the expression of ZO-1 observed in both cell lines (Figures 23 and 24). Treatment of PC-3 cells with 1 and 5 μM PLB for 24 hours resulted in a 1.5-fold increase in ZO-1 expression and 5 μM PLB resulted in a 2.6-fold increase in the expression level of ZO-1 in DU145 cells (P<0.05; Figures 23 and 24). These results from Western blot assay are consistent with our proteomic data.
PLB regulates EMT via Sirt1-mediated pathway in PC-3 and DU145 cells
Sirt1 plays an important role in the regulation of EMT and our proteomic data suggest that PLB may regulate Sirt1-mediated signaling pathways. Thus, we speculated that PLB may regulate Sirt1 expression in PC-3 and DU145 cells. We examined the effect of PLB on the expression of Sirt1 in both cell lines and evaluated the effect of STL (an inhibitor of Sirt165) on the expression of E-cadherin and N-cadherin in PC-3 and DU145 cells. As shown in Figure 27A and B, incubation of PC-3 and DU145 cells with PLB at 0.1, 1, and 5 μM resulted in a significant decrease in the expression of Sirt1. There was a 32.4% reduction in the expression level of Sirt1 when PC-3 cells were treated with 5 μM PLB (Figure 27A and B), and a 38.1%, 44.6%, and 56.1% decrease in the expression level of Sirt1 in DU145 cells treated with 0.1, 1, and 5 μM PLB, respectively (Figure 27A and B). Treatment of PC-3 cells with 25 μM STL alone significantly increased the expression level of E-cadherin by 111.1% and decreased the level of N-cadherin by 46.2% compared to vehicle-treated cells (P<0.05; Figure 27C and D), resulting in a significantly increased ratio of E-cadherin/N-cadherin (3.9 versus 1.0). Addition of 25 μM STL caused a 45.3% increase in PLB-induced expression of E-cadherin (P<0.05) while only slightly decreasing the expression level of N-cadherin (by 28.4%) in PC-3 cells compared to cells treated with 5 μM PLB, resulting in a significantly increased E-cadherin/N-cadherin ratio (4.8 versus 2.3; P<0.05; Figure 27C and D). The downregulation of Sirt1 by PLB may partially contribute to its autophagy-inducing and EMT-inhibitory effects.
Figure 27.

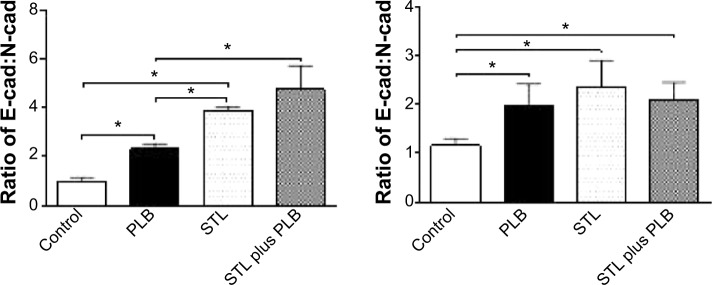
The role of Sirt-1 in PLB-induced EMT inhibition in PC-3 and DU145 cells.
Notes: Cells were treated with PLB at 0.1, 1, and 5 μM for 24 hours and protein samples were subject to Western blot assay. (A) Representative blots of Sirt 1 and β-actin in PC-3 and DU145 cells; (B) bar graphs showing the relative expression level of Sirt-1 in PC-3 and DU145 cells; (C) representative blots of E-cadherin, N-cadherin, and β-actin in PC-3 and DU145 cells; and (D) bar graphs showing the relative expression level of E-cadherin and N-cadherin in PC-3 and DU145 cells. Data are the mean ± standard deviation of three independent experiments. *P<0.05; **P<0.01 by one-way analysis of variance.
Abbreviations: EMT, epithelial–mesenchymal transition; PLB, plumbagin; STL, sirtinol.
In DU145 cells, STL alone induced a 1.5-fold increase in the expression level of E-cadherin and reduced the level of N-cadherin by 25.3% compared to vehicle-treated cells, resulting in a significantly increased ratio of E-cadherin/N-cadherin (1.2 versus 2.4; P<0.05; Figure 27C and D). Incubation of STL together with 5 μM PLB only slightly decreased the expression level of E-cadherin (by 9.7%) but significantly decreased the expression level of N-cadherin by 16.8% compared to PLB-treated cells, resulting in an insignificantly changed E-cadherin/N-cadherin ratio (Figure 27C and D). These results indicate that inhibition of Sirt1 blocks EMT by restoring the E-cadherin and N-cadherin balance, and that inhibition of Sirt1 augments the inhibitory effect of PLB on EMT in PC-3 cells, but not in DU145 cells. The data from Western blot assay support our findings from our quantitative proteomic study where differences in the proteomic responses to PLB treatment were observed between PC-3 and DU145 cells.
PLB modulates ROS and redox pathways in PC-3 and DU145 cells
Increased intracellular ROS level can cause cell death through various mechanisms, including mitochondria-mediated apoptosis and modulation of autophagy.66–68 Following the observation and verification of proapoptotic effect of PLB in PC-3 and DU145 cells, we examined the effect of PLB on ROS production in both cell lines. Cells were treated with PLB at 0.1, 1, and 5 μM for 24 hours. The intracellular level of ROS was significantly increased by 1.9-fold in PC-3 cells treated with 5 μM PLB (Figure 28A); in DU145 cells, there was 1.1-, 1.3-, and 1.2-fold elevation in the intracellular level of ROS when cells were treated with PLB at 0.1, 1, and 5 μM, respectively (Figure 28B). Apo, an NADPH oxidase inhibitor, significantly suppressed the PLB-induced ROS production in both cell lines (P<0.05; Figure 28A and B). Moreover, there was a significant increase in the intracellular ROS level when cells were treated over 72 hours. After incubation of PC-3 and DU145 cells with 5 μM PLB for 72 hours, there was a 1.4- and 1.9-fold increase in the intracellular level of ROS, respectively (Figure 28C and D). The ROS-inducing effect of PLB in PC-3 and DU145 cells reveals that PLB induces the generation of ROS in many types of cancer cells, and this may be the shared key mechanism for the anticancer effects of PLB on these types of cancer cells. The data from Western blot assay further confirms our main finding in SILAC-based quantitative proteomic study where ROS-related pathways were regulated by PLB in both PC-3 and DU145 cells.
Figure 28.

Effect of PLB on the intracellular ROS generation in PC-3 and DU145 cells.
Notes: Intracellular ROS level in PC-3 (A) and DU145 (B) cells treated with PLB at 0.1, 1, and 5 μM for 24 hours; and intracellular ROS level in PC-3 (C) and DU145 (D) cells treated with 5 μM PLB over 72 hours. Data are the mean ± standard deviation of three independent experiments. *P<0.05; **P<0.01, and ***P<0.001 by one-way analysis of variance.
Abbreviations: Apo, apocynin; PLB, plumbagin; ROS, reactive oxygen species.
Discussion
Treatment of advanced prostate cancer remains a major challenge because of poor efficacy of current therapies and chemotherapy. There is an increased interest in seeking new effective drugs for prostate cancer from natural compounds. PLB has been found to exhibit anticancer activities for prostate cancer in vitro and in vivo, which are attributed to its effects on multiple signaling pathways related to cell cycle arrest, apoptosis, autophagy, EMT, and redox homeostasis.24–28,30,31,46,69,70 In the present study, we compared the global proteomic responses to PLB treatment with regard to cell cycle, programmed cell death, EMT and related molecular targets, and signaling pathways in PC-3 and DU145 cells. The quantitative proteomic study showed that a large number of important proteins regulate cell proliferation, growth, cell death, and migration in both PC-3 and DU145 cells. Importantly, the proteomic analysis showed remarkable differences in the responses to PLB treatment between PC-3 and DU145 cells. Such differences are largely validated by our Western blot analysis, although we could not identify the reasons for such significant differences observed with the two commonly used human prostate cancer cell lines.
Before conducting SILAC-based quantitative proteomic study, we performed a bioinformatic analysis to predict the potential targets of PLB using an established approach, and we have found that PLB might interact with 78 proteins including those involved in cell proliferation and apoptosis; nucleic acid biosynthesis and metabolism; carbohydrate, lipid, steroid, amino acid, and protein metabolism; and signal transduction. In particular, many of the targets predicted based on our bioinformatic tools are associated with cell growth, apoptosis, and related signaling pathways, which have been verified by published data from our group and other groups.25,28,30,46,70
To verify the above bioinformatic data and explore whether PC-3 and DU145 cell lines would respond to PLB treatment in similar or different manners, we further analyzed the interactome and related signaling pathways of PLB in PC-3 and DU145 cells using SILAC-based quantitative proteomic approach. The proteomic results revealed that PLB modulated cell cycle regulators, apoptosis- and autophagy-related signaling pathways, EMT signaling pathways, and redox homeostasis and related signaling pathways, which in turn resulted in an alteration in cell proliferation, cell migration, and cell death with the involvement of a number of function proteins, such as CDK1, CDK2, E-cadherin, PI3K, Akt, mTOR, cytochrome c, caspase 9, caspase 3, Bcl-2, BAX, p53, PPAR, HSP, Erk1/2, Ras, and Rho. Our proteomic analysis also showed that mTOR signaling pathway was one of the top five signaling pathways regulated by PLB in both PC-3 and DU145 cells and that PLB regulated Nrf2-mediated oxidative response signaling pathway in both cell lines. Importantly, these key proteomic data have been verified by subsequent experiments.
Notably, we observed marked differences in proteomic responses to PLB with regard to the number of related pathways of potential targets between PC-3 and DU145 cells. Our proteomic study showed that PLB altered the expression of a large number of proteins that regulate cell cycle regulators, apoptosis, and EMT signaling pathways in PC-3 cells but not in DU145 cells. This is interesting when both cell lines could be killed by PLB via ROS generation. The reasons for the differential proteomic response are unknown, but may be related to origin of cell lines, remarkably different cytogenetics, and other possible factors. PC3 cells were obtained from a patient with a bone metastasis of grade IV prostate cancer and showed a higher metastatic potential compared to DU145 cells, and did not respond to androgens, glucocorticoids, or epidermal or fibroblast growth factors.71 The significantly different cytogenetic characteristics of PC-3 and DU145 cells may be another contributing factor.72,73 PC-3 cells have a unique karyotype in the absence of chromosomes 2, 3, 5, 15, and Y.74 The centromere 8 copy number was substantially different between PC-3 and DU145 cells.75 The copy number of centromere 8 with the highest observed frequency was two (79.4%) in PC-3 cells and three (70.%) in DU145 cells.75 A recent study indicated that DU145 cells have no detectable autophagy upon treatment with a known autophagic inducer, valproic acid, indicating a defect of autophagy in this cell line.76 In addition, the different batches and passages of cells used for separate experiments might also contribute to the different responses to PLB treatment as well.
In the present study, the proteomic data showed differential responses to PLB treatment with regard to cell cycle between PC-3 and DU145 cells. PLB regulated cell cycle at G1 and G2 checkpoints involving a number of cell cycle regulators in PC-3 cells, such as RPL11, RPL5, HDAC2, PA2G4, GNL3, SKP1, YWHAQ, PRKDC, YWHAG, YWHAE, YWHAH, YWHAB, YWHAZ, SFN, SKP1, and CDK1, which consequently result in alterations in cell cycle distribution. However, the proteomic analysis did not show a significant modulating effect of cell cycle signaling pathways in DU145 cells. Indeed, we found a differential effect of PLB on cell cycle distribution in PC-3 and DU145 cells using flow cytometry. PLB concentration-dependently arrested PC-3 and DU145 cells in G2/M and G1 phase, respectively. We further explored the effect of PLB on the key regulators in cell cycle checkpoints including CDC2, cyclin B1, CDK2, and cyclin D in both cell lines. The CDC2–cyclin B1 complex is pivotal in regulating the G2/M phase transition and mitosis. We observed a significant decrease in the expression level of cyclin B1 and CDC2 in PC-3 cells treated with PLB, providing an explanation for the effect of PLB on G2/M phase arrest in PC-3 cells. We observed that the expression of p53 and p21 Waf1/Cip1 was concentration- and time-dependently increased in PC-3 cells treated with PLB, which probably contributes to the inhibitory effect of PLB on cell proliferation and inducing effect on cell cycle arrest in PC-3 cells. For DU145 cells, a significant reduction in the expression of CDK2 and cyclin D was observed. We also found that PLB exhibited a concentration-dependent inducing effect on the expression of p21 Waf1/Cip1 and p27 Kip1 in DU145 cells. Furthermore, PLB increased the expression of p53 in DU145 cells. The results indicate that upregulation of p53, p21 Waf1/Cip1, and p27 Kip1 expression, and suppression of CDK2 and cyclin D by PLB may result in the G1 phase arrest in DU145 cells. These results provide further evidence that both PC-3 and DU145 cells differentially respond to PLB treatment and the cells are arrested in distinct phases.
Previous studies demonstrate that apoptosis and autophagy are two predominant cell death routes regulated by PLB in various cancer cells.25,27,28,30,33,46 In agreement with previous studies, our proteomic findings confirmed that PLB exhibited remarkable regulatory effects on apoptosis and autophagy in both PC-3 and DU145 cells via modulating the expression or activity of apoptotic and autophagic proteins and signaling pathways, including mTOR, p38 MAPK, and mitochondria-dependent pathways. Intriguingly, the apoptotic signaling pathway was only observed in PC-3 cells in response to PLB treatment. On the other hand, our Western blot assay showed similar apoptosis- and autophagy-inducing effects of PLB in both PC-3 and DU145 cells by regulating the expression of cytochrome c, caspase 9, caspase 3, Bcl-2, and BAX and the phosphorylation of PI3K, mTOR, Akt, and p38MAPK. Although the SILAC-based proteomics did not show a direct alteration in apoptosis in DU145 cells, the mitochondria-related apoptosis may be attributed to multiple modulating effects of PLB on other functional proteins and signaling pathways, such as the p53- and p38MAPK-mediated signaling pathways. These data also show that SILAC-based quantitative proteomic analysis is much more sensitive than routine protein quantification assays such as Western blot and enzyme-linked immunosorbent assay in terms of identification of molecular networks and discrimination of various signaling pathways that are involved in the anticancer effects of PLB.
EMT is characterized by epithelial cells that lose their polarization and specialized junction structures, undergoing cytoskeleton reorganization and acquiring morphological and functional features of mesenchymal-like cells.20,21 In clinic, the prostate cancer patient mortality is mainly attributed to the spread of cancerous cells to areas outside the prostate gland and the inadequate strategies to effectively block progression to metastasis; EMT plays a critical role in this process.22 In primary prostate cancer cells, reduction or loss of expression of E-cadherin and β-catenin were observed.22 In our proteomic study, we observed marked regulatory effects of PLB on the expression of a number of functional proteins that modulate epithelial adherent junction signaling pathway in PC-3 cells only. These modulating effects have been validated by our Western blotting experiments. The validation results showed that PLB significantly increased the ratio of E-cadherin over N-cadherin which would result in an EMT inhibition in prostate cancer. Furthermore, PLB increased the expression level of ZO-1 but suppressed the expression of snail, slug, TCF-8, and vimentin in PC-3 cells. Although there was no remarkable alteration in proteomic responses with regard to EMT-related function proteins and signaling pathways in DU145 cells treated with PLB, the validation experiments showed a similar inhibitory effect of PLB on the expression of a number of functional proteins that regulate EMT in DU145 cells. Taken together, our findings suggest that inhibition of EMT progression is one of the beneficial actions of PLB contributing to its anticancer effects in prostate cancer therapy. Again, SILAC-based quantitative proteomic analysis can discriminate the role of EMT modulation in the anticancer effects of PLB on PC-3 and DU145 cells.
Moreover, there is increasing evidence indicating the important role of Sirt1 in the regulation of cancer cell growth, cell death, and metastasis.54,77 Sirt1 deacetylates histones, p300, p53, forkhead box class O family members, and NF-κB, which regulate cellular stress response and cell survival.54 It also regulates PPAR-γ, AMPK, and mTOR with regard to cellular energy metabolism and autophagy.54 Our proteomic findings showed that the PLB regulated PPAR-γ, AMPK, p53, and mTOR-associated signaling pathways, which may be attributed to the regulatory effect of PLB on Sirt1 in PC-3 and DU145 cells. Importantly, the proteomic data showed that PLB treatment had a regulated effect on NAMPT in NAD+ biosynthesis signaling pathway, which is crucial for functional Sirt1. Consistently, our Western blotting results showed that PLB treatment significantly decreased the expression level of Sirt1 in both cell lines. Of note, it has been reported that silencing Sirt1 can promote the shift to an epithelial morphology in prostate cancer cells.23 In agreement with the previous study, we found that inhibition of Sirt1 increased the ratio of E-cadherin over N-cadherin in PC-3 and DU145 cells. The results showed that suppression of Sirt1 prevented EMT progress in prostate cancer cells. Moreover, we observed that inhibition of Sirt1 enhanced the inducing effect of PLB on the ratio of E-cadherin over N-cadherin in PC-3 cells, which indicated that PLB inhibited EMT through a Sirt1-mediated pathway.
Moreover, a number of studies have shown that the ROS-inducing effect of PLB contributes to its cancer cell killing effect in various cancer cell lines.24,30,32–34 Our quantitative proteomic analysis uncovered that PLB modulated several critical signaling pathways related to intracellular ROS generation and oxidative stress, including oxidative phosphorylation, Nrf2-mediated oxidative stress response, and superoxide radical degradation with the involvement of a number of enzymes and proteins. We have confirmed that PLB significantly promoted intracellular ROS generation in PC-3 and DU145 cells. Taken together, these results have revealed that the ROS-inducing effect is one of the key events involved in the anticancer effects of PLB.
Our SILAC-based proteomic approach showed significant advantages over the conventional proteomic methods, such as two-dimensional polyacrylamide gel electrophoresis or surface-enhanced laser desorption/ionization mass spectrometry. Although they were primarily used to analyze the protein expression profiles, they cannot quantitatively and easily identify the individual proteins.36,78 Compared to single-labeled SILAC proteomic approach, our double-labeled approach (13C6-L-lysine and 13C6/15N4-L-arginine) also showed obvious advantages. For example, Everley et al79 identified 444 proteins from the microsomal fractions of prostate cancer cells including PC3M and PC3M-LN4 cells with varying metastatic potential using 13C6-L-lysine SILAC-based proteomic approach. Both of these cell types are derived from PC-3 cells and exhibit low (PC3M) and high (PC3M-LN4) metastatic ability. Of these, 60 were upregulated greater than threefold in the highly metastatic cells, whereas 22 were downregulated by equivalent amounts. We depicted the global proteomic responses to PLB treatment with regard to cell proliferation, cell growth, cell migration, programmed cell death, and ROS production in PC-3 cells via quantification of 1,225 proteins and 341 related signaling pathways, and the double-labeled SILAC-based proteomic approach systematically elicited the network of potential molecular targets and related signaling pathways for PLB in a quantitative manner. Taken together, the double-labeled SILAC-based approach provides a powerful strategy for interactome characterization, new drug target identification, and biomarker determination for diagnosis and treatment of cancer.
Our new findings from the SILAC-based quantitative proteomic analysis have important implications for the subtype classification of prostate-cancer-based protein expression profiles. These SILAC-based data can classify cancer subtypes as well as reveal cancer-specific mechanistic changes. For example, SILAC-based quantitative proteomic assay has been used to classify diffusive large B-cell lymphoma subtypes including activated B-cell-like and germinal-center B-cell-like subtypes.80,81 In one study, SILAC-based proteomic assay yielded a proteome of more than 7,500 identified proteins from mixed cancer cell lines of diffusive large B-cell lymphoma. High accuracy of quantification allowed robust separation of subtypes of diffusive large B-cell lymphoma by principal component analysis. The main contributors to the classification included proteins known to be differentially expressed between the subtypes such as the transcription factors IRF4 and SPI1/PU.1, cell surface markers CD44 and CD27, as well as novel candidates.80 SILAC-based quantification is a promising new technology for tumor characterization and classification. SILAC-based proteomic assay has not been commonly used for the biomarker identification and classification of prostate cancer. Previous proteomic studies have revealed several biomarkers that can discriminate the subtypes of prostate cancer.82–85 For example, lamin A has been found to be a useful discriminatory biomarker for low- and high-grade prostate cancer.85 Platelet factor 4, a chemokine with prothrombolytic and antiangiogenic activities, was identified as a stage-specific serologic biomarker for advanced prostate cancer.82 In agreement with previous proteomic study,82–85 our SILAC-based quantification revealed that PLB regulated the expression of lamin A and its related apoptotic signaling pathway in PC-3 cells only, which further suggests the potential of SILAC-based proteomic approach in biomarker identification and classification of prostate cancer.
Our proteomic data also have implications for personalized cancer treatment. It is well-known that cancer patients respond very differently to chemotherapy and targeted therapies. By incorporating the proteomic data, we can better implement individualized therapies for cancer. A proteomic effort will be necessary to identify useful biomarkers that can classify patient tumor by prognosis and response to therapeutic modalities, and to identify the drivers of tumor behavior that are optimal targets for therapy. An understanding of the effects of targeted therapeutics on signaling networks and homeostatic regulatory loops will be necessary to prevent severe adverse effects as well as to develop rational combinatorial therapies.86,87
In summary, we delineated the differences and similarities in the molecular targets and related signaling pathways responding to PLB treatment using SILAC-based proteomic analysis in PC-3 and DU145 cells. The proteomic responses elicited the molecular interactome of PLB in PC-3 and DU145 cells, indicating that the prostate cancer cell killing effect of PLB was mainly ascribed to the regulatory effects on cell cycle, apoptosis, autophagy, EMT, and ROS generation with the involvement of PI3K/Akt/mTOR, p38 MAPK, and Sirt1-mediated signaling pathways. The data have important implications for: better classification of prostate cancer; identification of new therapeutic targets and new biomarkers for the prognosis and response of prostate cancer; and personalized therapy for prostate cancer. However, more studies are needed to elucidate the underlying mechanisms and identify new targets of PLB for prostate cancer therapy.
Figure 3.

Molecular interactions between PLB and selected predicted targets.
Notes: Protein structure identifications from PDB. AKR1C3 (ID: 1YRO); ALDH1L1 (ID: 1S3I); ASS1 (ID: 2NZ2); and AURKA (ID: 1MUO).
Abbreviations: AKR1C3, aldo–keto reductase family 1, member C3; ALDH1L1, aldehyde dehydrogenase 1 family, member L1; ASS1, argininosuccinate synthase 1; AURKA, aurora kinase A; PDB, Protein Data Bank; PLB, plumbagin.
Figure 4.

Molecular interactions between PLB and selected predicted targets.
Notes: Protein structure identifications from PDB. BCAT2 (ID: 1KTA); CA4 (ID: 1G54); and CDKN2A (ID: 1OIQ).
Abbreviations: BCAT2, mitochondrial branched-chain amino-acid transaminase 2; CA4, carbonic anhydrase IV; CDKN2A, cyclin-dependent kinase inhibitor 2A; PDB, Protein Data Bank; PLB, plumbagin.
Acknowledgments
The authors appreciate the financial support from the Startup Fund of the College of Pharmacy, University of South Florida, Tampa, FL, USA. Dr Zhi-Wei Zhou is a holder of a postdoctoral scholarship from College of Pharmacy, University of South Florida, Tampa, FL, USA.
Footnotes
Disclosure
The authors report no conflicts of interest in this work.
References
- 1.Ahmed HU. Prostate cancer: Time for active surveillance of intermediate-risk disease? Nat Rev Urol. 2013;10(1):6–8. doi: 10.1038/nrurol.2012.213. [DOI] [PubMed] [Google Scholar]
- 2.Ferlay J, Soerjomataram I, Ervik M, et al. GLOBOCAN 2012 v.10, Cancer Incidence and Mortality Worldwide: IARC CancerBase No. 11. [homepage on the Internet] Lyon, France: International Agency for Research on Cancer; 2013. [accessed on November 7, 2014]. Available from: http://globocan.iarc.fr. [Google Scholar]
- 3.Ferlay J, Shin HR, Bray F, Forman D, Mathers C, Parkin DM. Estimates of worldwide burden of cancer in 2008: GLOBOCAN 2008. Int J Cancer. 2010;127(12):2893–2917. doi: 10.1002/ijc.25516. [DOI] [PubMed] [Google Scholar]
- 4.Soerjomataram I, Lortet-Tieulent J, Parkin DM, et al. Global burden of cancer in 2008: a systematic analysis of disability-adjusted life-years in 12 world regions. Lancet. 2012;380(9856):1840–1850. doi: 10.1016/S0140-6736(12)60919-2. [DOI] [PubMed] [Google Scholar]
- 5.Gunderson K, Wang CY, Wang R. Global prostate cancer incidence and the migration, settlement, and admixture history of the Northern Europeans. Cancer Epidemiol. 2011;35(4):320–327. doi: 10.1016/j.canep.2010.11.007. [DOI] [PMC free article] [PubMed] [Google Scholar]
- 6.U.S. Cancer Statistics Working Group. [webpage on the Internet] United States Cancer Statistics: 1999–2010 Incidence and Mortality Web-based Report. Atlanta, GA: 2013. [Accessed November 7, 2014]. Available from http://apps.nccd.cdc.gov/uscs/ [Google Scholar]
- 7.DeSantis CE, Lin CC, Mariotto AB, et al. Cancer treatment and survivorship statistics, 2014. CA Cancer J Clin. 2014;64(4):252–271. doi: 10.3322/caac.21235. [DOI] [PubMed] [Google Scholar]
- 8.Cancer Research UK. [homepage on the Internet] Cancer statistics report: Cancer incidence and mortality in the UK for the 10 most common cancers December 2013. [Accessed November 7, 2014]. Available from http://publications.cancerresearchuk.org/cancerstats/statsincidence/reporttop10incmort.html.
- 9.Klotz L. Nomogram for predicting survival in men with clinically localized prostate cancer who do not undergo definitive therapy. Nat Clin Pract Urol. 2008;5(7):362–363. doi: 10.1038/ncpuro1131. [DOI] [PubMed] [Google Scholar]
- 10.Albertsen P. Predicting survival for men with clinically localized prostate cancer: what do we need in contemporary practice? Cancer. 2008;112(1):1–3. doi: 10.1002/cncr.23107. [DOI] [PubMed] [Google Scholar]
- 11.American Cancer Society [webpage on the Internet] Global cancer facts and figures. 2nd edition. Atlanta: 2011. [Accessed November 7, 2014]. Available from: http://www.cancer.org/research/cancerfactsfigures/globalcancerfactsfigures/ [Google Scholar]
- 12.Saylor PJ. Prostate cancer: The androgen receptor remains front and centre. Nat Rev Clin Oncol. 2013;10(3):126–128. doi: 10.1038/nrclinonc.2013.14. [DOI] [PubMed] [Google Scholar]
- 13.Wen S, Niu Y, Lee SO, Chang C. Androgen receptor (AR) positive vs negative roles in prostate cancer cell deaths including apoptosis, anoikis, entosis, necrosis and autophagic cell death. Cancer Treat Rev. 2014;40(1):31–40. doi: 10.1016/j.ctrv.2013.07.008. [DOI] [PMC free article] [PubMed] [Google Scholar]
- 14.Rodrigues DN, Butler LM, Estelles DL, de Bono JS. Molecular pathology and prostate cancer therapeutics: from biology to bedside. J Pathol. 2014;232(2):178–184. doi: 10.1002/path.4272. [DOI] [PubMed] [Google Scholar]
- 15.Helfand BT, Catalona WJ. The epidemiology and clinical implications of genetic variation in prostate cancer. Urol Clin North Am. 2014;41(2):277–297. doi: 10.1016/j.ucl.2014.01.001. [DOI] [PubMed] [Google Scholar]
- 16.Fang YX, Gao WQ. Roles of microRNAs during prostatic tumorigenesis and tumor progression. Oncogene. 2014;33(2):135–147. doi: 10.1038/onc.2013.54. [DOI] [PubMed] [Google Scholar]
- 17.Fraser M, Berlin A, Bristow RG, van der Kwast T. Genomic, pathological, and clinical heterogeneity as drivers of personalized medicine in prostate cancer. Urol Oncol. 2014 Apr 22; doi: 10.1016/j.urolonc.2013.10.020. Epub. [DOI] [PubMed] [Google Scholar]
- 18.Crawford ED, Ventii K, Shore ND. New biomarkers in prostate cancer. Oncology (Williston Park) 2014;28(2):135–142. [PubMed] [Google Scholar]
- 19.Barve A, Jin W, Cheng K. Prostate cancer relevant antigens and enzymes for targeted drug delivery. J Control Release. 2014;187C:118–132. doi: 10.1016/j.jconrel.2014.05.035. [DOI] [PMC free article] [PubMed] [Google Scholar]
- 20.Zheng H, Kang Y. Multilayer control of the EMT master regulators. Oncogene. 2014;33(14):1755–1763. doi: 10.1038/onc.2013.128. [DOI] [PubMed] [Google Scholar]
- 21.Lamouille S, Xu J, Derynck R. Molecular mechanisms of epithelial- mesenchymal transition. Nat Rev Mol Cell Biol. 2014;15(3):178–196. doi: 10.1038/nrm3758. [DOI] [PMC free article] [PubMed] [Google Scholar]
- 22.Nauseef JT, Henry MD. Epithelial-to-mesenchymal transition in prostate cancer: paradigm or puzzle? Nat Rev Urol. 2011;8(8):428–439. doi: 10.1038/nrurol.2011.85. [DOI] [PMC free article] [PubMed] [Google Scholar]
- 23.Byles V, Zhu L, Lovaas JD, et al. SIRT1 induces EMT by cooperating with EMT transcription factors and enhances prostate cancer cell migration and metastasis. Oncogene. 2012;31(43):4619–4629. doi: 10.1038/onc.2011.612. [DOI] [PMC free article] [PubMed] [Google Scholar]
- 24.Padhye S, Dandawate P, Yusufi M, Ahmad A, Sarkar FH. Perspectives on medicinal properties of plumbagin and its analogs. Med Res Rev. 2012;32(6):1131–1158. doi: 10.1002/med.20235. [DOI] [PubMed] [Google Scholar]
- 25.Subramaniya BR, Srinivasan G, Sadullah SS, et al. Apoptosis inducing effect of plumbagin on colonic cancer cells depends on expression of COX-2. PLoS One. 2011;6(4):e18695. doi: 10.1371/journal.pone.0018695. [DOI] [PMC free article] [PubMed] [Google Scholar]
- 26.Nazeem S, Azmi AS, Hanif S, et al. Plumbagin induces cell death through a copper-redox cycle mechanism in human cancer cells. Mutagenesis. 2009;24(5):413–418. doi: 10.1093/mutage/gep023. [DOI] [PubMed] [Google Scholar]
- 27.Xu KH, Lu DP. Plumbagin induces ROS-mediated apoptosis in human promyelocytic leukemia cells in vivo. Leuk Res. 2010;34(5):658–665. doi: 10.1016/j.leukres.2009.08.017. [DOI] [PubMed] [Google Scholar]
- 28.Sun J, McKallip RJ. Plumbagin treatment leads to apoptosis in human K562 leukemia cells through increased ROS and elevated TRAIL receptor expression. Leuk Res. 2011;35(10):1402–1408. doi: 10.1016/j.leukres.2011.06.018. [DOI] [PMC free article] [PubMed] [Google Scholar]
- 29.Shieh JM, Chiang TA, Chang WT, et al. Plumbagin inhibits TPA-induced MMP-2 and u-PA expressions by reducing binding activities of NF-kappaB and AP-1 via ERK signaling pathway in A549 human lung cancer cells. Mol Cell Biochem. 2010;335(1–2):181–193. doi: 10.1007/s11010-009-0254-7. [DOI] [PubMed] [Google Scholar]
- 30.Li YC, He SM, He ZX, et al. Plumbagin induces apoptotic and autophagic cell death through inhibition of the PI3K/Akt/mTOR pathway in human non-small cell lung cancer cells. Cancer Lett. 2014;344(2):239–259. doi: 10.1016/j.canlet.2013.11.001. [DOI] [PubMed] [Google Scholar]
- 31.Sinha S, Pal K, Elkhanany A, et al. Plumbagin inhibits tumorigenesis and angiogenesis of ovarian cancer cells in vivo. Int J Cancer. 2013;132(5):1201–1212. doi: 10.1002/ijc.27724. [DOI] [PMC free article] [PubMed] [Google Scholar]
- 32.Aziz MH, Dreckschmidt NE, Verma AK. Plumbagin, a medicinal plant-derived naphthoquinone, is a novel inhibitor of the growth and invasion of hormone-refractory prostate cancer. Cancer Res. 2008;68(21):9024–9032. doi: 10.1158/0008-5472.CAN-08-2494. [DOI] [PMC free article] [PubMed] [Google Scholar]
- 33.Powolny AA, Singh SV. Plumbagin-induced apoptosis in human prostate cancer cells is associated with modulation of cellular redox status and generation of reactive oxygen species. Pharm Res. 2008;25(9):2171–2180. doi: 10.1007/s11095-008-9533-3. [DOI] [PubMed] [Google Scholar]
- 34.Abedinpour P, Baron VT, Chrastina A, Welsh J, Borgstrom P. The combination of plumbagin with androgen withdrawal causes profound regression of prostate tumors in vivo. Prostate. 2013;73(5):489–499. doi: 10.1002/pros.22585. [DOI] [PubMed] [Google Scholar]
- 35.Ong SE, Mann M. Stable isotope labeling by amino acids in cell culture for quantitative proteomics. Methods Mol Biol. 2007;359:37–52. doi: 10.1007/978-1-59745-255-7_3. [DOI] [PubMed] [Google Scholar]
- 36.Mann M. Functional and quantitative proteomics using SILAC. Nat Rev Mol Cell Biol. 2006;7(12):952–958. doi: 10.1038/nrm2067. [DOI] [PubMed] [Google Scholar]
- 37.Ong SE. The expanding field of SILAC. Anal Bioanal Chem. 2012;404(4):967–976. doi: 10.1007/s00216-012-5998-3. [DOI] [PubMed] [Google Scholar]
- 38.Wang R, Fang X, Lu Y, Wang S. The PDBbind database: collection of binding affinities for protein-ligand complexes with known three-dimensional structures. J Med Chem. 2004;47(12):2977–2980. doi: 10.1021/jm030580l. [DOI] [PubMed] [Google Scholar]
- 39.Yang L, Luo H, Chen J, Xing Q, He L. SePreSA: a server for the prediction of populations susceptible to serious adverse drug reactions implementing the methodology of a chemical-protein interactome. Nucleic Acids Res. 2009;37(Web Server issue):W406–W412. doi: 10.1093/nar/gkp312. [DOI] [PMC free article] [PubMed] [Google Scholar]
- 40.Yang L, Chen J, Shi L, Hudock MP, Wang K, He L. Identifying unexpected therapeutic targets via chemical-protein interactome. PLoS One. 2010;5(3):e9568. doi: 10.1371/journal.pone.0009568. [DOI] [PMC free article] [PubMed] [Google Scholar]
- 41.Luo H, Chen J, Shi L, et al. DRAR-CPI: a server for identifying drug repositioning potential and adverse drug reactions via the chemical-protein interactome. Nucleic Acids Res. 2011;39(Web Server issue):W492–W498. doi: 10.1093/nar/gkr299. [DOI] [PMC free article] [PubMed] [Google Scholar]
- 42.Huang da W, Sherman BT, Tan Q, et al. The DAVID Gene Functional Classification Tool: a novel biological module-centric algorithm to functionally analyze large gene lists. Genome Biol. 2007;8(9):R183. doi: 10.1186/gb-2007-8-9-r183. [DOI] [PMC free article] [PubMed] [Google Scholar]
- 43.Ong SE, Mann M. A practical recipe for stable isotope labeling by amino acids in cell culture (SILAC) Nat Protoc. 2006;1(6):2650–2660. doi: 10.1038/nprot.2006.427. [DOI] [PubMed] [Google Scholar]
- 44.Lecoeur H. Nuclear apoptosis detection by flow cytometry: influence of endogenous endonucleases. Exp Cell Res. 2002;277(1):1–14. doi: 10.1006/excr.2002.5537. [DOI] [PubMed] [Google Scholar]
- 45.Sunil C, Duraipandiyan V, Agastian P, Ignacimuthu S. Antidiabetic effect of plumbagin isolated from Plumbago zeylanica L. root and its effect on GLUT4 translocation in streptozotocin-induced diabetic rats. Food Chem Toxicol. 2012;50(12):4356–4363. doi: 10.1016/j.fct.2012.08.046. [DOI] [PubMed] [Google Scholar]
- 46.Wang CC, Chiang YM, Sung SC, Hsu YL, Chang JK, Kuo PL. Plumbagin induces cell cycle arrest and apoptosis through reactive oxygen species/c-Jun N-terminal kinase pathways in human melanoma A375.S2 cells. Cancer Lett. 2008;259(1):82–98. doi: 10.1016/j.canlet.2007.10.005. [DOI] [PubMed] [Google Scholar]
- 47.Shanware NP, Bray K, Abraham RT. The PI3K, metabolic, and autophagy networks: interactive partners in cellular health and disease. Annu Rev Pharmacol Toxicol. 2013;53:89–106. doi: 10.1146/annurev-pharmtox-010611-134717. [DOI] [PubMed] [Google Scholar]
- 48.Morgensztern D, McLeod HL. PI3K/Akt/mTOR pathway as a target for cancer therapy. Anticancer Drugs. 2005;16(8):797–803. doi: 10.1097/01.cad.0000173476.67239.3b. [DOI] [PubMed] [Google Scholar]
- 49.Wu WK, Coffelt SB, Cho CH, et al. The autophagic paradox in cancer therapy. Oncogene. 2012;31(8):939–953. doi: 10.1038/onc.2011.295. [DOI] [PubMed] [Google Scholar]
- 50.Ferreira CG, Epping M, Kruyt FA, Giaccone G. Apoptosis: target of cancer therapy. Clin Cancer Res. 2002;8(7):2024–2034. [PubMed] [Google Scholar]
- 51.Fulda S, Galluzzi L, Kroemer G. Targeting mitochondria for cancer therapy. Nat Rev Drug Discov. 2010;9(6):447–464. doi: 10.1038/nrd3137. [DOI] [PubMed] [Google Scholar]
- 52.Laplante M, Sabatini DM. mTOR signaling in growth control and disease. Cell. 2012;149(2):274–293. doi: 10.1016/j.cell.2012.03.017. [DOI] [PMC free article] [PubMed] [Google Scholar]
- 53.Dancey J. mTOR signaling and drug development in cancer. Nat Rev Clin Oncol. 2010;7(4):209–219. doi: 10.1038/nrclinonc.2010.21. [DOI] [PubMed] [Google Scholar]
- 54.Preyat N, Leo O. Sirtuin deacylases: a molecular link between metabolism and immunity. J Leukoc Biol. 2013;93(5):669–680. doi: 10.1189/jlb.1112557. [DOI] [PubMed] [Google Scholar]
- 55.Montecucco F, Cea M, Bauer I, et al. Nicotinamide phosphoribosyltransferase (NAMPT) inhibitors as therapeutics: rationales, controversies, clinical experience. Curr Drug Targets. 2013;14(6):637–643. doi: 10.2174/1389450111314060003. [DOI] [PubMed] [Google Scholar]
- 56.Keum YS, Choi BY. Molecular and chemical regulation of the Keap1-Nrf2 signaling pathway. Molecules. 2014;19(7):10074–10089. doi: 10.3390/molecules190710074. [DOI] [PMC free article] [PubMed] [Google Scholar]
- 57.Ma Q. Role of nrf2 in oxidative stress and toxicity. Annu Rev Pharmacol Toxicol. 2013;53:401–426. doi: 10.1146/annurev-pharmtox-011112-140320. [DOI] [PMC free article] [PubMed] [Google Scholar]
- 58.Hu X, Moscinski LC. Cdc2: a monopotent or pluripotent CDK? Cell Prolif. 2011;44(3):205–211. doi: 10.1111/j.1365-2184.2011.00753.x. [DOI] [PMC free article] [PubMed] [Google Scholar]
- 59.Warfel NA, El-Deiry WS. p21WAF1 and tumourigenesis: 20 years after. Curr Opin Oncol. 2013;25(1):52–58. doi: 10.1097/CCO.0b013e32835b639e. [DOI] [PubMed] [Google Scholar]
- 60.Yoon MK, Mitrea DM, Ou L, Kriwacki RW. Cell cycle regulation by the intrinsically disordered proteins p21 and p27. Biochem Soc Trans. 2012;40(5):981–988. doi: 10.1042/BST20120092. [DOI] [PMC free article] [PubMed] [Google Scholar]
- 61.Carvajal LA, Manfredi JJ. Another fork in the road – life or death decisions by the tumour suppressor p53. EMBO Rep. 2013;14(5):414–421. doi: 10.1038/embor.2013.25. [DOI] [PMC free article] [PubMed] [Google Scholar]
- 62.Settembre C, Fraldi A, Medina DL, Ballabio A. Signals from the lysosome: a control centre for cellular clearance and energy metabolism. Nat Rev Mol Cell Biol. 2013;14(5):283–296. doi: 10.1038/nrm3565. [DOI] [PMC free article] [PubMed] [Google Scholar]
- 63.Maes H, Rubio N, Garg AD, Agostinis P. Autophagy: shaping the tumor microenvironment and therapeutic response. Trends Mol Med. 2013;19(7):428–446. doi: 10.1016/j.molmed.2013.04.005. [DOI] [PubMed] [Google Scholar]
- 64.Cannito S, Novo E, di Bonzo LV, Busletta C, Colombatto S, Parola M. Epithelial-mesenchymal transition: from molecular mechanisms, redox regulation to implications in human health and disease. Antioxid Redox Signal. 2010;12(12):1383–1430. doi: 10.1089/ars.2009.2737. [DOI] [PubMed] [Google Scholar]
- 65.Grozinger CM, Chao ED, Blackwell HE, Moazed D, Schreiber SL. Identification of a class of small molecule inhibitors of the sirtuin family of NAD-dependent deacetylases by phenotypic screening. J Biol Chem. 2001;276(42):38837–38843. doi: 10.1074/jbc.M106779200. [DOI] [PubMed] [Google Scholar]
- 66.Bellot GL, Liu D, Pervaiz S. ROS, autophagy, mitochondria and cancer: Ras, the hidden master? Mitochondrion. 2013;13(3):155–162. doi: 10.1016/j.mito.2012.06.007. [DOI] [PubMed] [Google Scholar]
- 67.Dodson M, Darley-Usmar V, Zhang J. Cellular metabolic and autophagic pathways: traffic control by redox signaling. Free Radic Biol Med. 2013;63:207–221. doi: 10.1016/j.freeradbiomed.2013.05.014. [DOI] [PMC free article] [PubMed] [Google Scholar]
- 68.Kaminskyy VO, Zhivotovsky B. Free radicals in cross talk between autophagy and apoptosis. Antioxid Redox Signal. 2014;21(1):86–102. doi: 10.1089/ars.2013.5746. [DOI] [PubMed] [Google Scholar]
- 69.Hsu YL, Cho CY, Kuo PL, Huang YT, Lin CC. Plumbagin (5-hydroxy-2-methyl-1,4-naphthoquinone) induces apoptosis and cell cycle arrest in A549 cells through p53 accumulation via c-Jun NH2-terminal kinase-mediated phosphorylation at serine 15 in vitro and in vivo. J Pharmacol Exp Ther. 2006;318(2):484–494. doi: 10.1124/jpet.105.098863. [DOI] [PubMed] [Google Scholar]
- 70.Yang SJ, Chang SC, Wen HC, Chen CY, Liao JF, Chang CH. Plumbagin activates ERK1/2 and Akt via superoxide, Src and PI3-kinase in 3T3-L1 cells. Eur J Pharmacol. 2010;638(1–3):21–28. doi: 10.1016/j.ejphar.2010.04.016. [DOI] [PubMed] [Google Scholar]
- 71.Kaighn ME, Narayan KS, Ohnuki Y, Lechner JF, Jones LW. Establishment and characterization of a human prostatic carcinoma cell line (PC-3) Invest Urol. 1979;17(1):16–23. [PubMed] [Google Scholar]
- 72.Chen TR. Chromosome identity of human prostate cancer cell lines, PC-3 and PPC-1. Cytogenet Cell Genet. 1993;62(2–3):183–184. doi: 10.1159/000133468. [DOI] [PubMed] [Google Scholar]
- 73.Nupponen NN, Hyytinen ER, Kallioniemi AH, Visakorpi T. Genetic alterations in prostate cancer cell lines detected by comparative genomic hybridization. Cancer Genet Cytogenet. 1998;101(1):53–57. doi: 10.1016/s0165-4608(97)00060-5. [DOI] [PubMed] [Google Scholar]
- 74.Ohnuki Y, Marnell MM, Babcock MS, Lechner JF, Kaighn ME. Chromosomal analysis of human prostatic adenocarcinoma cell lines. Cancer Res. 1980;40(3):524–534. [PubMed] [Google Scholar]
- 75.Beheshti B, Park PC, Sweet JM, Trachtenberg J, Jewett MA, Squire JA. Evidence of chromosomal instability in prostate cancer determined by spectral karyotyping (SKY) and interphase fish analysis. Neoplasia. 2001;3(1):62–69. doi: 10.1038/sj.neo.7900125. [DOI] [PMC free article] [PubMed] [Google Scholar]
- 76.Ouyang DY, Xu LH, He XH, et al. Autophagy is differentially induced in prostate cancer LNCaP, DU145 and PC-3 cells via distinct splicing profiles of ATG5. Autophagy. 2013;9(1):20–32. doi: 10.4161/auto.22397. [DOI] [PMC free article] [PubMed] [Google Scholar]
- 77.Feldman JL, Dittenhafer-Reed KE, Denu JM. Sirtuin catalysis and regulation. J Biol Chem. 2012;287(51):42419–42427. doi: 10.1074/jbc.R112.378877. [DOI] [PMC free article] [PubMed] [Google Scholar]
- 78.Wulfkuhle JD, Liotta LA, Petricoin EF. Proteomic applications for the early detection of cancer. Nat Rev Cancer. 2003;3(4):267–275. doi: 10.1038/nrc1043. [DOI] [PubMed] [Google Scholar]
- 79.Everley PA, Krijgsveld J, Zetter BR, Gygi SP. Quantitative cancer proteomics: stable isotope labeling with amino acids in cell culture (SILAC) as a tool for prostate cancer research. Mol Cell Proteomics. 2004;3(7):729–735. doi: 10.1074/mcp.M400021-MCP200. [DOI] [PubMed] [Google Scholar]
- 80.Deeb SJ, D’Souza RC, Cox J, Schmidt-Supprian M, Mann M. Super-SILAC allows classification of diffuse large B-cell lymphoma subtypes by their protein expression profiles. Mol Cell Proteomics. 2012;11(5):77–89. doi: 10.1074/mcp.M111.015362. [DOI] [PMC free article] [PubMed] [Google Scholar]
- 81.Deeb SJ, Cox J, Schmidt-Supprian M, Mann M. N-linked glycosylation enrichment for in-depth cell surface proteomics of diffuse large B-cell lymphoma subtypes. Mol Cell Proteomics. 2014;13(1):240–251. doi: 10.1074/mcp.M113.033977. [DOI] [PMC free article] [PubMed] [Google Scholar]
- 82.Lam YW, Mobley JA, Evans JE, Carmody JF, Ho SM. Mass profiling-directed isolation and identification of a stage-specific serologic protein biomarker of advanced prostate cancer. Proteomics. 2005;5(11):2927–2938. doi: 10.1002/pmic.200401165. [DOI] [PubMed] [Google Scholar]
- 83.Sardana G, Marshall J, Diamandis EP. Discovery of candidate tumor markers for prostate cancer via proteomic analysis of cell culture-conditioned medium. Clin Chem. 2007;53(3):429–437. doi: 10.1373/clinchem.2006.077370. [DOI] [PubMed] [Google Scholar]
- 84.Al-Ruwaili JA, Larkin SE, Zeidan BA, et al. Discovery of serum protein biomarkers for prostate cancer progression by proteomic analysis. Cancer Genomics Proteomics. 2010;7(2):93–103. [PubMed] [Google Scholar]
- 85.Skvortsov S, Schäfer G, Stasyk T, et al. Proteomics profiling of micro-dissected low- and high-grade prostate tumors identifies Lamin A as a discriminatory biomarker. J Proteome Res. 2011;10(1):259–268. doi: 10.1021/pr100921j. [DOI] [PubMed] [Google Scholar]
- 86.Gonzalez-Angulo AM, Hennessy BT, Mills GB. Future of personalized medicine in oncology: a systems biology approach. J Clin Oncol. 2010;28(16):2777–2783. doi: 10.1200/JCO.2009.27.0777. [DOI] [PMC free article] [PubMed] [Google Scholar]
- 87.Tian Q, Price ND, Hood L. Systems cancer medicine: towards realization of predictive, preventive, personalized and participatory (P4) medicine. J Intern Med. 2012;271(2):111–121. doi: 10.1111/j.1365-2796.2011.02498.x. [DOI] [PMC free article] [PubMed] [Google Scholar]