

Abstract
PVA/CuI polymer composite samples have been prepared and subjected to characterizations using FT-IR spectroscopy, DSC analysis, ac spectroscopy and dc conduction. The FT-IR spectral analysis shows remarkable variation of the absorption peak positions whereas DSC illustrates a little decrease of both glass transition temperature, Tg, and crystallization fraction, χ, with increasing CuI concentration. An increase of dc conductivity for PVA/CuI nano composite by increasing CuI concentration is recoded up to 15 wt%, besides it obeys Arhenuis plot with an activation energy in the range 0.54–1.32 eV. The frequency dependence of ac conductivity showed power law with an exponent 0.33 < s < 0.69 which predicts hopping conduction mechanism. The frequency dependence of both dielectric permittivity and dielectric loss obeys Debye dispersion relations in wide range of temperatures and frequency. Significant values of dipole relaxation time obtained which are thermally activated with activation energies in the range 0.33–0.87 eV. A significant value of hopping distance in the range 3.4–1.2 nm is estimated in agreement with the value of Bohr radius of the exciton.
Keywords: Polymer composite, CuI/PVA composite, dc Conductivity, FT-IR, DSC
Introduction
Semiconductor nanoparticles/organic polymer composites have attracted considerable interest in recent years due to their size-dependent properties and great potential for many applications such as nonlinear optics, photoelectrochemical cells, heterogenerous photocatalysis, optical switching, and single electron transistors [1], [2], [3], [4], [5], [6], [7], [8]. The reason is that the polymer matrices provide for proccesibility, solubility, and control of the growth and morphology of the nanoparticles. Various approaches have been employed to prepare nanoparticles/polymer composites. Therefore, more attention has been paid to the in situ synthesis of inorganic nanoparticles in polymer matrices to obtain new semiconducting properties by controlling nanoparticle size and shape (polymer used as capping agent for nanoparticles).
PVA is a potential material having high dielectric strength, good charge storage capacity and dopant-dependent electrical and optical properties. PVA polymer has carbon chain backbone with hydroxyl groups attached to methane carbons. These OH groups can be a source of hydrogen bonding and hence assist the formation of polymer composite by growing inorganic nanoparticles inside polymer matrix.
Cuprous iodide (CuI) has attracted a great attention of researchers recently, as it is a versatile candidate in band gap materials. It belongs to the I–VII semiconductors with Zinc blend structure. Conducting and optically transparent thin films have had much interest in the application in electronic devices such as liquid crystal displays, photovoltaic devices and photothermal collectors. The most interesting nature of this compound is that an inorganic semiconductor and its coordination chemistry let it readily couple with many inorganic and organic ligends as well [9], [10], [11], [12], [13], [14], [15].
The properties of inorganic semiconducting nanoparticles depend mainly on their shape and size due to high surface-to-volume ratio [16], [17]. The CuI/PVA polymer composite illustrated that this polymer composite can be used as electron donor semiconductor in fabricating organic solar cell because of their efficient photo absorption in the visible region of solar spectra (energy band gap ∼2 eV) [18]. Since the solar energy conversion efficiency is greatly influenced by exciton generation, diffusion, dissociation, and electron hole transportation in polymer composite matrix, however, the electrical conduction and dielectric parameters play an important role in solar energy conversion [19]. The present work, is aiming to clarify the electrical conduction and dielectric behaviors of such composites to optimize the polymer composite matrix to be used as electron donor in heterojunction.
Experimental
Samples preparation
Polyvinyl alcohol polymer (PVA) used in the present study was provided by Sigma-Aldrich, while the other chemicals were provided by QualiKems Chemical Company, India. An PVA solution was prepared by adding firstly deionized distilled water to solid PVA [—C2H4O]n (where n = 30,000–70,000), average mol.wt, and stirred by a magnetic stirrer at room temperature for 2 h. After aging the solution was stirred again for another 1 h. A solution of CuCl2 in H2O was first added into the PVA solution under stirring then the appropriate weight of NaI dissolved in water was added 2 h later drop wisely into the reaction vessel to obtain nanopolymer composite with different concentrations of CuI, with step 2.5 wt% up to 15 wt%, followed by stirring for another 2 h. The prepared polymer composite was direct cast in a Petri – glass dishes and left for two weeks at room temperature to dry.
Physical measurements
Transmission infrared spectra of the films were recorded at room temperature using a Bruker IFS-25 spectrometer at a resolution of 2 cm−1 in the range 400–4000 cm−1. The film was mounted directly in the sample holder. DSC thermal analysis was done using a Perkin-Elmer Pyris7 DSC system with heating rate of 10 °C/min in a N2 atmosphere.
Thick layers of polymer films of about 0.4 mm were subjected to conductivity measurements, where silver paste was used as conducting electrodes on the desired area. Electrical measurements were carried out in the temperature range 303–373 K using PM 6304 programmable automatic RCL (Philips) meter in the frequency range 0.1–100 kHz. Finally dc conductivity was measured using two electrodes configuration. Finally dc conductivity was measured using two electrodes configuration. A Keithely 480 Picoameter was used for measuring the electric current.
Results and discussion
FT-IR spectroscopy
FTIR spectroscopy has been used to analyze the interactions among atoms or ions in PVA polymer electrolyte. These interactions may induce changes in the vibrational modes of the polymer electrolyte under investigation. The FT-IR spectrum exhibits some bands characteristic of stretching and bending vibrations of O—H, C—H, C C and C—O groups of PVA. The FTIR spectrum of pure PVA and CuI/PVA polymer composite with different concentration of CuI are shown in Fig. 1. The absorption peaks of pure PVA at 3544 cm−1 was assigned to O—H stretching vibration of hydroxyl groups. The band corresponding to C—H asymmetric stretching vibration occurs at 2965 and C—H symmetric stretching vibration at 2877 cm−1. The bands at 1743 corresponds to C C stretching vibration and 1619 cm−1 corresponds to an acetyl C O group and can be explained on the basis of intra/inter molecular hydrogen bonding with the adjacent OH group. Two strong bands observed at 1515 and 836 cm−1 has been attributed to bending and stretching modes of CH2 group, respectively. The strong band at 1141 cm−1 and sharp band at 952 cm−1 could be attributed to the stretching mode of CO and CC groups, respectively. The IR band positions and their assignments are presented in Table 1, which reflects the effect of CuI on the chemical structure of the PVA membrane. FT-IR spectra show shift in some bands and change in the intensities of other bands comparing with pure PVA. As shown from Table 1, the strength of hydrogen bond on O—H, C—H, and CH2 groups differs according to the CuI. On the other hand, the intensity of band (C C) stretching vibration at 1743 cm−1 shifts to lower wavenumbers, which indicates a decrease in the force constant by adding CuI according to hook’s low [20]. The increase in the force constant gives an insight into specific interactions between the dopant and the polar groups of pure polymer.
Fig. 1.

FT-IR spectra for CuI/PVA polymer composites with different concentrations of CuI (a) 0 wt%, (b) 5 wt%, (c) 7.5 wt%, (d) 10 wt% and (e) 15 wt%.
Table 1.
FT-IR absorption bands positions and their assignments for pure PVA and PVA/CuI polymer composites.
| Band assignments | Pure | 5% | 7.5% | 10% | 15% |
|---|---|---|---|---|---|
| O—H stretching vibration | 3544 | 3390 | 3540 | 3475 | 3602 |
| C—H asymmetric stretching vibration | 2965 | 2958 | 2958 | 2958 | 3958 |
| C—H symmetric stretching vibration | 2877 | 2881 | 2877 | 2881 | 2877 |
| C C stretching vibration | 1743 | 1731 | 1724 | 1731 | 1720 |
| Acetyl C O group | 1619 | 1616 | 1619 | 1623 | 1619 |
| Bending modes of CH2 group | 1515 | 1519 | 1519 | 1515 | 1519 |
| Stretching mode of CO groups | 1141 | 1133 | 1130 | 1141 | 1130 |
| Stretching mode of CC groups | 952 | 948 | 952 | 952 | 948 |
| Stretching modes of CH2 group | 836 | 836 | 833 | 836 | 833 |
Thermal analysis
DSC curves of the CuI/PVA polymer composites with different concentrations of CuI nanoparticles (=0, 5, 7.5, 10 and 15 wt%) are shown in Fig. 2. The DSC thermogram of PVA and PVA composites reflects the phase transition of polymer composite, where the glass transition temperature Tg, is an important parameter for identifying the amorphous or the semicrystalline solids. The DSC of PVA/CuI polymer composite illustrates an endothermic peak around 175 °C for PVA or sample of low CuI concentrations 5 and 7.5 wt% whereas Tg peak gets shallower and shifts to the lower temperatures 163 and 157 °C for the higher concentrations of CuI, 10 and 15 CuI wt% respectively.
Fig. 2.
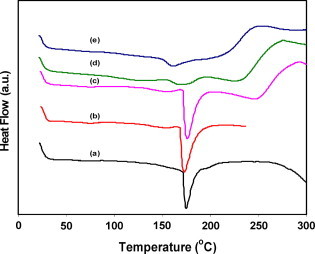
DSC thermograms for CuI/PVA polymer composites with different concentrations of CuI (a) 0 wt%, (b) 5 wt%, (c) 7.5 wt%, (d)10 wt% and (e) 15 wt%.
The shift of Tg towards relatively lower temperatures with increasing the concentration of CuI nanoparticles in the polymer composite reveals the disruption of the degree of crystallinity of the host polymer which facilitates the micro movement of the PVA chain. The peak depth at Tg indicates the reduction of the degree of crystalinity of PVA (semicrystalline) and the increase of the amorphous fraction in agreement with the reported XRD data [18], [21].
The function of CuI nanoparticles is to retard or inhibit the recrystallization of PVA polymer and to increase or retain the domain of amorphous phase and create more free volume. Therefore the relative crystallinity (χ) of the polymer composites could be estimated according to the following formula [22].
| (1) |
where, ΔHm and ΔHo are the melting heat of the polymer composite and host polymer respectively, obtained from DSC results. The extracted values of χ, Table 2 decrease with increasing the concentration of CuI nanoparticles in agreement with the decrease of Tg. The reduction in Tg or χ means an increase of the amorphousity of the polymer composite which leads to a higher segmental motion of the polymer composite [23].
Table 2.
Glass transition temperature Tg, frequency exponent S, crystallization fraction χ%, conductivity, activation energy Edc, and dipole relaxation activation energy ΔH, for PVA/CuI polymer composites.
| CuI (wt%) | Tg (°C) | χ% | Edc (eV) | S | ΔH (eV) |
|---|---|---|---|---|---|
| 0 | 174 | 100 | 1.24 | 0.6901 | 0.33 |
| 2.5 | – | – | 1.32 | 0.3314 | – |
| 5 | 172 | 95 | 0.93 | 0.5923 | 0.61 |
| 7.5 | 175 | 94 | 0.55 | 0.5348 | 0.45 |
| 10 | 163 | 85 | 0.54 | 0.5819 | 0.79 |
| 12.5 | – | – | 0.78 | 0.5309 | 0.87 |
| 15 | 157 | 78 | 0.89 | 0.5614 | – |
However the variation of χ, Table 2 with increasing CuI is a good evidence to estimate the enhancement of volume fraction of the amorphous phase caused by the modification of the polymer by the addition of the inorganic salt. On the other hand the current crystalinity is still high (78%) even at the maximum CuI content (15 wt%). The values of Tg and χ is strongly correlated to the ionic conductivity, because the ionic conductivity is mainly localized to the amorphous domain of polymer matrix as well as the increasing of ionic mobility by increasing defects or free volume at the interface between the CuI ceramic fillers and the PVA polymer matrix.
DC conductivity studies
Fig. 3b illustrates the temperature dependence of dc conductivity, σdc, for PVA/CuI polymer composite with different concentrations,
Fig. 3a.

Temperature dependence of dc conductivity for CuI/PVA polymer composites with different concentration of CuI.
The dc conductivity for the present polymer composites can be, in general, described by the following Arhenius relation [7], [18].
| (2) |
where Edc is the dc conductivity activation energy A is temperature independent constant depends on the physical and chemical properties of the polymer composite matrix and k is Boltzman’s constant. These properties depend on CuI nanoparticles concentration, particle size, dispersion, polymer – nanoparticles interaction (polymer – particle interfaces). The values of Edc are obtained by least square fitting of Eq. (2), and listed in Table 2. It can be noticed that, the activation energy Edc, decreases by increasing CuI concentration to reach minimum value, 0.54 eV, at ∼8 wt% CuI concentration; then it increases again with increasing CuI concentration, Fig. 3b and Table 2. In addition the plot of σdc versus CuI concentration percolates between two conductivity levels, 1.7 × 10⁻⁷ and 4.5 × 10⁻⁶ S/cm with increasing CuI concentration), Fig. 3b
Fig. 3b.

DC conductivity and activation energy versus CuI concentration for CuI/PVA polymer composites.
This can be explained as follows; the dc conductivity of CuI/PVA polymer composites depends on the conduction level of the organic phase (PVA polymer) and inorganic phase (CuI nanoparticles). In addition the presence of CuI nanoparticles reduces the degree of crystallinity of the polymer matrix and subsequently increases the free volume which enhances the charge carrier transfer in the polymer composite (charge carrier mobility). On the other hand the increase of CuI nanoparticles means an increase of the matrix heteroginity which results in an increase of the nanoparticles – polymer interface resistance. The mild dependence of the conductivity on CuI concentration in low concentration range is essentially due to the insulation effect of the host polymer matrix. In other words the separation distance between CuI nanoparticles or aggregates is large enough to produce extrinsic conduction and the conduction mechanism is mainly due to minority carriers of host polymer. The further increase of CuI nanoparticles concentration results in a decrease of the interseparation distance between particles or aggregates. As the CuI concentration reaches a critical concentration, the conductivity illustrates the percolation as a result of the formation conducting path ways (nanoparticles aggregations) for charge carrier transportation. Besides an increase of charge carrier concentration is expected due to the presence of p-type CuI semiconductor nanoparticles. However a competition of the interfacial polarization (mobility decrease due to charge carrier scattering at CuI–polymer interfaces) and conductivity enhancement by introducing CuI nanoparticles leads to the conductivity percolation and minimization of the activation energy observed at about 8 wt% of CuI nanoparticle concentration. These observations confirm the authors previous work on photovoltaic characterization of CuI/PVA composite at CuI concentration ∼7.5 which illustrated promising solar energy conversion efficiency 0.8% using such composites as electron donor [24].
AC spectroscopy
The frequency dependence of the total conductivity (σtot) for the polymer composites at 303 K of different concentrations, is given in Fig. 4 as representative figure, which follows the universal power law
| (3) |
where σdc is the dc conductivity (the extrapolation of the plateau region to zero frequency), ω is the angular frequency, s is the frequency exponent and A is frequency independent pre-exponential factor, which can be calculated from the intercept of ω with σtot and its values was found to be lies in the range of 2 × (10−10–10−8)
Fig. 4.

Frequency dependence of the total conductivity σtot, (ω) for CuI/PVA composite with different concentrations of CuI.
In addition, the frequency dependence of illustrates two regions, nearly frequency independent at relatively low frequency followed with frequency dependent region, where the two regions are separated with transition region at certain frequency ωp, (defined as the hoping rate). The strong frequency dependence of ac conductivity can be described by the second term in Eq. (3).However, the values of the exponent s have been obtained using the least square fitting and listed in Table 2 which lie in the range 0.33 < s < 0.69; these values predict hopping conduction in the CuI/PVA composites under investigation.
On the other hand, the transition between the nearly frequency independent region (dc conductivity) at low frequencies and that at intermediate frequencies (polarizing conductivity) occurs at a certain frequency ωp (defined as the hopping rate). This behavior arises from the competition of both dc conductivity and that due to the ionic polarization besides the electronic one. The values of ωp are obtained by assuming that the ac conductivity is nearly equal to dc conductivity at ω = ωp, Eq. (3), then ωp = (σdc/A)1/s.
The values of ωp is plotted versus 103/T, Fig. 4. They decrease firstly to minimum value and then it increase again with increasing temperature. At the same time, ωp can be explained by the following empirical relation,
| (4) |
where Eω is an activation energy concerning the shift of ωp with increasing temperature The values of Eω are deduced by for selected CuI concentration 0, 2.5 and 5 wt% using the least square fitting, they are equal to 0.26, 0.65 and 0.49 eV respectively.
Fig. 5.

Temperature dependence of hopping rate ωp for CuI/PVA polymer composite with different concentrations of CuI.
The behavior of ωp can be explained according to the frequency dependence of conductivity, Eq. (3), which is governed by the contribution of ionic polarization besides the electronic one in the whole frequency range. However the observed decrease of ωp to lower frequency is due to the enhancement of ionic polarization by increasing temperature to the range (50–60 °C). The observed thermal activation of ωp beyond the mentioned temperature range can be attributed to the domination of the electronic polarization.
Dielectric relaxation
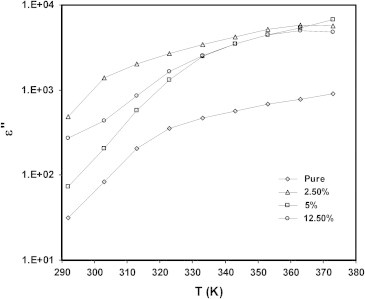
Fig. 6a, Fig. 6b show the variation of the dielectric constant ɛ′ and dielectric loss ɛ″ versus frequency respectively at room temperature. Both ɛ′ and ɛ″ decrease monotonically with increasing frequency in the range where of ωτ ≫ 1. This behavior can be described by the Debye dispersion relations [7], [25]:
| (5) |
where ɛ∞ and ɛs are the static and infinite dielectric permittivity and τ is the relaxation. This can be understood on the basis of, the decrease of ε′ and ɛ″ with frequency can be associated to the inability of dipoles to rotate rapidly leading to a lag between frequency of oscillating dipole and that of applied field. The variation indicates that at low frequencies the dielectric constant is high due to the interfacial polarization and the dielectric loss (ɛ″) becomes very large at lower frequencies due to free charge motion within the material.
Fig. 6a.

Frequency dependence of dielectric constant ε′ for CuI/PVA polymer composite with different concentrations of CuI at 303 K.
Fig. 6b.

Frequency dependence of dielectric loss ε″ for CuI/PVA polymer composite for different concentrations of CuI at 303 K.
Fig. 7a, Fig. 7b show the variation of the dielectric constant ɛ′ and dielectric loss ɛ″ versus temperature T, at constant frequency, 1 kHz. It is clear that, ɛ′ and ɛ″ increases with increasing temperature up to asymptotic value. In addition the value of both ɛ′ and ɛ″ increases, in general, with increasing CuI concentration. The observed behavior is typical of polar dielectrics in which the orientation of dipoles is facilitated with the rising temperature and thereby the permittivity is increased. The observed large values of both ɛ′ and ɛ″ in the mentioned range of frequency and temperature can be attributed to interfacial polarization due to polymer composite heterogeneity (the interfaces at the polymer and the inorganic phases).
Fig. 7a.

Temperature dependence of dielectric constant ε′ for CuI/PVA polymer composite with different concentrations of CuI at 1 kHz.
Fig. 7b.
Temperature dependence of dielectric loss ε″ for CuI/PVA polymer composite with different concentrations of CuI at 1 KHz.
Regarding the ɛ″ behavior which does not illustrate characteristic peak according Debye dispersion relations, Eq. (5) in the whole range of both frequency and temperature. The Z″ – Z′ impedance plot has been used to extract the values of the relaxation time of polarization in PVA/CuI composite, Fig. 8; the value of relaxation time τ has been calculated according to the following equation
| (6) |
where V and u are the two sides of the triangle intersect with Z′ (see inset figure). Where the triangle apex lies on the plotted semicircle with origin below Z’ axis, and h = 2π/α, where α is the angle between the arc radius and Z′-axis. The plots of τ versus temperature for CuI/PVA polymer composites with different concentration of CuI, illustrate thermal activation
Fig. 8.
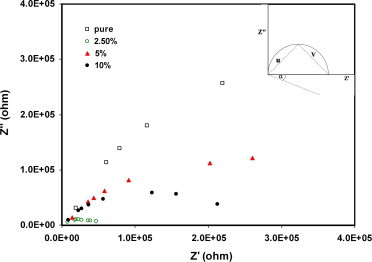
Impedance plots (Cole–Cole plots) for CuI/PVA polymer composite with different concentrations of CuI.
According to the Eyring’s theory, the molecular relaxation time has been expressed by the following relation [26], [27],
| (7) |
where ΔF is the free energy for dipole relaxation, h is the Plank’s constant and R is the universal gas constant. Substituting by (ΔF = ΔH–T ΔS), where ΔH is the thermal activation for dipole orientation and ΔS is the entropy activation. Reasonable values of ΔH have been obtained using the least square fitting of relation 7 and listed in Table 2. The values of ΔH lie in the range 0.33–0.87 eV which in general, increase with increasing salt concentration. This can be attributed to the increase of polymer matrix viscosity and hence the strong force. The obtained values of ΔH are in satisfactory agreement with the values of dc activation energy Edc at relatively high concentrations of CuI (0.65–0.96 eV), which clearly indicates the domination of ionic polarization in this type of polymer composites.
The obtained values of the infinite frequency, Eq. (4) are much smaller than those expected for a phonon frequency. Long et al. [28] have pointed out that the electron loss processes involve transitions between states which the composite network distorts, creating a polaron well (the overlapping of electron wave functions has been considered), from which it could be given by
| (8) |
where νo, is the optical phonon frequency. By using the estimated value of the characteristic phonon frequency, νo = 1013 Hz and the localization distance 1/α = 10A [29]. The optimum hopping distances Ro for the present polymer composite are obtained for selected CuI concentrations 0, 2.5 and 5 wt%, they are equal to 3.4, 8.4 and 11.2 nm respectively. The values of Ro for CuI/PVA composite are within Bohr radius rB from which reflects its influence on the electrostatic attraction between electrons and holes (exciton binding energy ∝ 1/Ro) [19]. The obtained values of Ro are in agreement with the values of exciton Bohr radius (∼1–10 nm) [30].
Conclusion
From the obtained results and discussions one can conclude the following:
-
1.
The FT-IR analysis did not illustrate remarkable variation of the vibrational bond position of the PVA polymer composites by introducing inorganic salt whereas the glass transition temperature Tg is remarkably reduced from 174 to 157 °C as the concentration of CuI reached 15 wt%.
-
2.
The dc conductivity CuI/PVA polymer composite shows percolation by increasing CuI concentration between 0 and 15 wt% whereas the activation energy passes through minimum value, 0.54 eV, at CuI concentration =8 wt%. A significant hopping distance extracted, 3.4 and 11.2 nm, agrees with the exciton Bohr radius.
Acknowledgment
This project was supported financially by the Science and Technology Development Fund (STDF), EGYPT, Grant No. 1360.
Footnotes
Peer review under responsibility of Cairo University.

References
- 1.Godovsky D.Y. Device applications of polymer-nanocomposites. Adv Polym Sci. 2000;153:163–205. [Google Scholar]
- 2.Gunes S., Neugebauer H., Sariciftci N.S. Conjugated polymer-based organic solar cells. Chem Rev. 2007;107:1324–1338. doi: 10.1021/cr050149z. [DOI] [PubMed] [Google Scholar]
- 3.Mayer A.C., Scully S.R., Hardin B.E., Rowell M.W., McGehee M.D. Polymer-based solar cells. Mater Today. 2007;10:28–33. [Google Scholar]
- 4.Krebs F.C., Tromholt T., Jorgensen M. Upscaling of polymer solar cell fabrication using full roll-to-roll processing. Nanoscale. 2010;2:873–886. doi: 10.1039/b9nr00430k. [DOI] [PubMed] [Google Scholar]
- 5.Helgesen M., Sondergaard R., Krebs F.C. Advanced materials and processes for polymer solar cell devices. J Mater Chem. 2009;20:36–60. [Google Scholar]
- 6.Kanimozhi C., Balraju P., Sharma G.D., Patil S. Synthesis of diketopyrrolopyrrole containing copolymers: a study of their optical and photovoltaic properties. J Phys Chem B. 2010;114:3095–3103. doi: 10.1021/jp909183x. [DOI] [PubMed] [Google Scholar]
- 7.Sheha E., Khoder H., Shanap T.S., El-Shaarawy M.G., El Mansy M.K. Structure, dielectric and optical properties of p-type (PVA/CuI) nanocomposite polymer electrolyte for photovoltaic cells. Optik. 2012;123:1161–1166. [Google Scholar]
- 8.Sheha E., El-Mansy M.K. A high voltage magnesium battery based on H2SO4-doped (PVA)0.7(NaBr)0.3 solid polymer electrolyte. J Pow Sources. 2008;185:1509–1513. [Google Scholar]
- 9.Abdelkader K.A., Anwar Z. Spectroscopic studies of poly vinyl alcohol. J Appl Polym Sci. 2006;2:1146–1151. [Google Scholar]
- 10.Tennakone K., Kumara G.R., Kottegoda I.R., Perera V.P., Aponsu G.M., Wijayantha K.G. Deposition of thin conducting films of CuI on glass. Sol Energy Mater Sol Cells. 1998;55:283–289. [Google Scholar]
- 11.Kumara G.R., Konno A., Senadeera G.K., Jayaweere P.V., De Silva D.B., Tennakone T. Dye-sensitized solar cell with the hole collector P-CuSCN deposited from a solution in n-propyl sulphide. Sol Energy Mater Sol Cells. 2001;69:195–199. [Google Scholar]
- 12.Tonooka K., Shimokawa K., Nishimura O. Properties of copper–aluminum oxide films prepared by solution methods. Thin Solid Films. 2002;411:129–133. [Google Scholar]
- 13.Sirimanne P.M., Rusop M., Shirata T., Soga T., Jimbo T. Characterization of transparent conducting CuI thin films prepared by pulse laser deposition technique. Chem Phys Lett. 2002;366:485–489. [Google Scholar]
- 14.Badr Y., Mahmoud M.A. Effect of PVA surrounding medium on ZnSe nanoparticles: size, optical, and electrical properties. Spectrochim Acta Part A. 2006;65:584–590. doi: 10.1016/j.saa.2005.12.015. [DOI] [PubMed] [Google Scholar]
- 15.Tang B.Z., Geng Y., Lam J.W., Li B., Jing X., Wang X., et al. Processible nanostructured materials with electrical conductivity and magnetic susceptibility: preparation and properties of maghemite/polyaniline nanocomposite films. Chem Mater. 1999;11:1581–1589. [Google Scholar]
- 16.Murray C.B., Kagan C.R., Bawendi M.G. Self-organization of CdSe nanocrystallites into three-dimensional quantum dot superlattices. Science. 1995;270:1335–1338. [Google Scholar]
- 17.Dai Q., Rabani J. Photosensitization of nanocrystalline TiO2 films by anthocyanin dyes. J Photochem Photobiol A. 2002;148:17–24. [Google Scholar]
- 18.El-Mansy MK, Sheha EM, Patel KR, Sharma GD. Structural, optical and electrical characterization of PVA/CuI polymer composites, Optik- International Journal for Light and Electron Optics: http://dx.doi.org/10.1016/j.ijleo.2012.05.009.
- 19.Badescu V., Paulescu M. Physics of nanostructured solar cells. Nova Sci. 2010:363–462. [Google Scholar]
- 20.Abdelaziz M. Cerium (III) doping effects on optical and thermal properties of PVA films. Physica B. 2011;406:1300–1307. [Google Scholar]
- 21.Hema M., Selvasekarapandian S., Arunkumar D., Sakunthala A., Nithya H. FTIR, XRD and ac impedance spectroscopic study on PVA based polymer electrolyte doped with NH4X (X = Cl, Br, I) J Non-Cryst Sol. 2009;533:84–90. [Google Scholar]
- 22.Hema M., Selvasekarapandian S., Hirankumar G., Sakunthala A., Arunkumar D., Nithya H. Structure and thermal studies of PVA:NH4I. J Phys Chem Sol. 2009;70:1098–1103. [Google Scholar]
- 23.Pitawala H.M., Dissanayake M.A., Seneviratne V.A., Mellander B.E., Albinson I. Effect of plasticizers (EC or PC) on the ionic conductivity and thermal properties of the (PEO)9LiTf:Al2O3 nanocomposite polymer electrolyte system. J Sol State Electrochem. 2008;12:783–789. [Google Scholar]
- 24.Sharma G.D., Shanap T.S., Patel K.R., El-Mansy M.K. Photovoltaic properties of bulk heterojunction devices based on CuI-PVA as electron donor and PCBM and modified PCBM as electron acceptor. Mater Sci-Poland. 2012;30:10–16. [Google Scholar]
- 25.Shash N.M., Salman F.E., Mohamed A.Z., El-Sharawy M.G., Bayomib R.M., El-Mansy M.K. Effects of vitrification suppression on structure morphology, conductivity and dielectric properties of vanadium phosphate glasses. J Phys Chem Sol. 2004;65:881–889. [Google Scholar]
- 26.Eyring H. Viscosity, plasticity, and diffusion as examples of absolute reaction rates. J Chem Phys. 1936;4:283–291. [Google Scholar]
- 27.Salman F.E., Shash N.M., Abou El-Haded H., El-Mansy M.K. Electrical conduction and dielectric properties of vanadium phosphate glasses doped with lithium. J Phys Chem Sol. 2002;63:1957–1966. [Google Scholar]
- 28.Long A.R., Balkan N., Hogg W.R., Ferrier R.P. A.c. loss in sputtered hydrogenated amorphous germanium measurements at around liquid-nitrogen temperatures. Philos Mag B. 1982;45:497–512. [Google Scholar]
- 29.Elliott R. Longman; New York: 1984. Physics of amorphous materials. [Google Scholar]
- 30.Gapon V. Cabmbridge University; USA: 1998. Optical properties of semiconductor nanocrystals. [Google Scholar]