Supplemental Digital Content is Available in the Text.
Key Words: genotype, cost-effectiveness, Brazil, HIV, drug resistance
Abstract
Objective:
HIV genotype-resistance testing can help identify more effective antiretroviral treatment (ART) regimens for patients, substantially increasing the likelihood of viral suppression and immune recovery. We sought to evaluate the cost-effectiveness of genotype-resistance testing before first-line ART initiation in Brazil.
Design:
We used a previously published microsimulation model of HIV disease (CEPAC-International) and data from Brazil to compare the clinical impact, costs, and cost-effectiveness of initial genotype testing (Genotype) with no initial genotype testing (No genotype).
Methods:
Model parameters were derived from the HIV Clinical Cohort at the Evandro Chagas Clinical Research Institute and from published data, using Brazilian sources whenever possible. Baseline patient characteristics included 69% male, mean age of 36 years (SD, 10 years), mean CD4 count of 347 per microliter (SD, 300/µL) at ART initiation, annual ART costs from 2012 US $1400 to US $13,400, genotype test cost of US $230, and primary resistance prevalence of 4.4%. Life expectancy and costs were discounted 3% per year. Genotype was defined as “cost-effective” compared with No Genotype if its incremental cost-effectiveness ratio was less than 3 times the 2012 Brazilian per capita GDP of US $12,300.
Results:
Compared with No genotype, Genotype increased life expectancy from 18.45 to 18.47 years and reduced lifetime cost from US $45,000 to $44,770; thus, in the base case, Genotype was cost saving. Genotype was cost-effective at primary resistance prevalence as low as 1.4% and remained cost-effective when subsequent-line ART costs decreased to 30% of baseline value. Cost-inefficient results were observed only when simultaneously holding multiple parameters to extremes of their plausible ranges.
Conclusions:
Genotype-resistance testing in ART-naive individuals in Brazil will improve survival and decrease costs and should be incorporated into HIV treatment guidelines in Brazil.
INTRODUCTION
The Brazilian Ministry of Health's response to the HIV/AIDS epidemic is recognized worldwide as a bold program for a middle-income country.1–3 One of the most striking characteristics of the program is the universal provision of antiretroviral treatment (ART) free of charge to patients, which was guaranteed in 1996 through the passage of a federal law.4 At the same time, an expert panel was designated to define guidelines for the treatment of infected individuals in the country. Noteworthy aspects of the most recent guidelines, issued in 2013, include CD4 count threshold for treatment initiation at <500 per microliter, regular use of CD4 count and HIV RNA quantification assays for treatment monitoring, subsequent-line regimens including drugs for salvage therapy, and use of genotype-resistance testing after treatment failure.5
One notable omission concerns the use of genotype-resistance testing before ART initiation for ART-naive patients. The guidelines exclude the widespread use of genotype-resistance testing for ART-naive patients, which is only recommended for pregnant women or individuals known to have acquired infection from a partner receiving ART. This omission is noteworthy, given that the epidemiology and economics of HIV have been shown to favor the use of genotype-resistance testing not only after failing an ART regimen in resource-rich6,7 and resource-limited settings,8 but also for patients who are ART naive in resource-rich settings.9 By identifying individuals with primary resistance, genotype resistance testing can assist health care providers in determining ART regimens for patients that will have the highest likelihood of success. Specifically, patients whose resistance to nonnucleoside reverse transcriptase inhibitors (NNRTIs) is detected before first-line ART initiation can be assigned a protease inhibitor (PI)–based regimen. Still, the Brazilian national guidelines emphasize the need for additional studies demonstrating the clear benefit of this initial genotype test strategy.5
We hypothesized that the use of genotype-resistance testing, at a cost of $230 per test,10 before ART initiation in ART-naive individuals within the scope of the Brazil National Health System would be a cost-effective strategy for the country. To examine this question, we used the Cost-Effectiveness of Preventing AIDS Complications (CEPAC)-International model to estimate the clinical impact, economic costs, and cost-effectiveness of adding primary genotype-resistance testing to the Brazilian Guidelines for HIV treatment.
METHODS
Analytic Overview
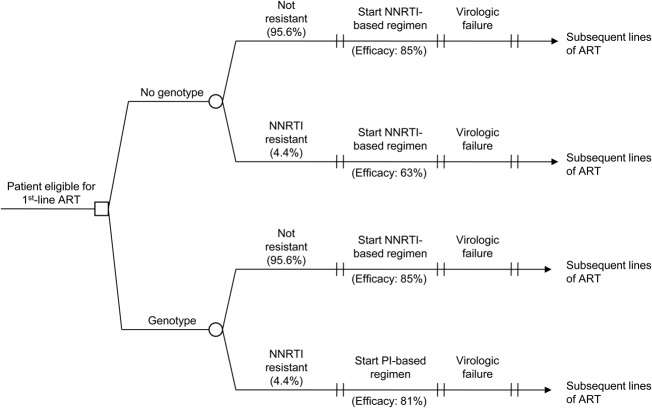
We used the Cost-Effectiveness of Preventing AIDS Complications (CEPAC)-International model, a previously published microsimulation model of HIV disease,11–13 to project the clinical and economic outcomes of performing a genotype test to detect NNRTI resistance before first-line ART initiation in Brazil. Resistance to NNRTI-based regimens was chosen because it accounts for more than 3 quarters of HIV primary drug resistance in Brazil and because Brazilian national guidelines currently recommend an NNRTI-based regimen as the preferred first-line therapy.5,14 We examined 2 strategies: (1) No genotype testing before first-line ART initiation (No genotype), an approximation of the current standard of care in Brazil and (2) genotype testing before first-line ART initiation (Genotype). Both strategies include genotype-resistance testing after first-line failure, as recommended in the Brazilian National Guidelines. Within each strategy, we simulated both patients who did and did not have NNRTI resistance and weighted the results based on the prevalence of primary NNRTI resistance in Brazil (Fig. 1). The outcomes of interest included per person life expectancy and costs (both discounted at 3% per year), as well as the incremental cost-effectiveness ratios and net health benefit to provide comparative value of the Genotype strategy.15 All costs were reported in 2012 US dollars. Based on the recommendations of the Commission on Macroeconomics and Health,16 we defined a strategy to be “very cost-effective” (or “cost-effective”) if its incremental cost-effectiveness ratio was less than 1 time (or 3 times) the 2012 Brazilian per capita GDP of US $12,300. Net health benefit was calculated as the difference in discounted effectiveness between the Genotype strategy and the No genotype strategy, minus the quotient of the difference in costs between the 2 strategies and the willingness-to-pay threshold (measured in dollars per additional life-year saved) and assumed to be the annual per capita GDP of Brazil.17
FIGURE 1.
Decision tree diagram for a model of HIV genotype testing. Results of each of the 4 arms (No Resistance, No Genotype; No Resistance, Genotype; Resistance, No Genotype; Resistance, Genotype) are weighted based on the prevalence of NNRTI resistance in Brazil. Initial ART regimen and efficacy vary by arm. Subsequent-line ART regimens are identical for each arm.
The CEPAC-International Model
The CEPAC-International model is a microsimulation of HIV disease progression and treatment. The model simulates a distinct trajectory for each individual patient, using a random number generator and known transition probabilities to determine the occurrence of monthly transitions between “health states.” The health states are defined to be both descriptive of the patient's current health (CD4 count, HIV RNA level, relevant history of opportunistic infections (OIs) and treatment-related toxicities, and resource use) and predictive of future disease progression (immune system deterioration, onset and relapse of OIs, ART status, toxic reactions to medications, resistance to therapy, and mortality). CD4 and HIV RNA levels dictate the rate of CD4 count decline, and CD4 count determines the probabilities of OIs and AIDS-related mortality. The model takes note of variability in patient adherence to medication and uses that information to estimate both initial and long-term virologic response to treatment and loss to follow-up. Results of multiple individual simulations are then aggregated to produce stable estimates of survival and costs. A more complete description of the model is provided in the Technical Appendix (see Supplemental Digital Content, http://links.lww.com/QAI/A595) and in the CEPAC Model User's Guide.18
At model entry, patients are assigned an adherence value (0%–100%) according to a distribution derived from a cohort of commercially insured HIV-infected patients in the United States,19 indicating their likelihood to adhere to treatment. For each line of ART, patients are assigned an initial probability of achieving virologic suppression at 24 weeks, after which they face a monthly probability of virologic rebound and subsequent CD4 decline. Both the probability of suppression and the subsequent monthly probability of virologic rebound are dependent on a patient's adherence value. An initial genotype test is performed for all patients at ART initiation in the Genotype strategy. After failure on a regimen has been detected through standard viral load monitoring, patients in both strategies incur the cost and information of a genotype test before starting on the next line of ART. After failing the last of 5 available regimens, patients remain on ART until death. Both the monthly probabilities of going loss to follow-up and of returning to care also are dependent on a patient's adherence value. We structure care in the model to conform to Brazilian national guidelines for HIV treatment. Specifically, patients begin antiretroviral therapy when their CD4 count drops below the current Brazil recommendation of <500 per microliter.5 CD4 count tests are conducted every 3 months until patients are eligible for ART. Once on ART, patients' CD4 count and HIV RNA levels are monitored every 3 months. Patients received both prophylaxis and treatment for OIs in accordance with Brazilian guidelines.
Input Parameters for the Analysis
Data on cohort characteristics, natural history, and resource utilization were derived from the HIV Clinical Cohort at the Evandro Chagas Clinical Research Institute (IPEC) of the Oswaldo Cruz Foundation. IPEC is a public health care institution situated in Rio de Janeiro, Brazil. It is one of the Brazil's largest reference centers for HIV research and has provided care to over 5000 patients in the urban HIV-infected population of Rio de Janeiro Metropolitan area since 1986. A detailed description of the cohort and the methods of data collection and parameter estimation are in the Technical Appendix (see Supplemental Digital Content, http://links.lww.com/QAI/A595).
Cohort Characteristics
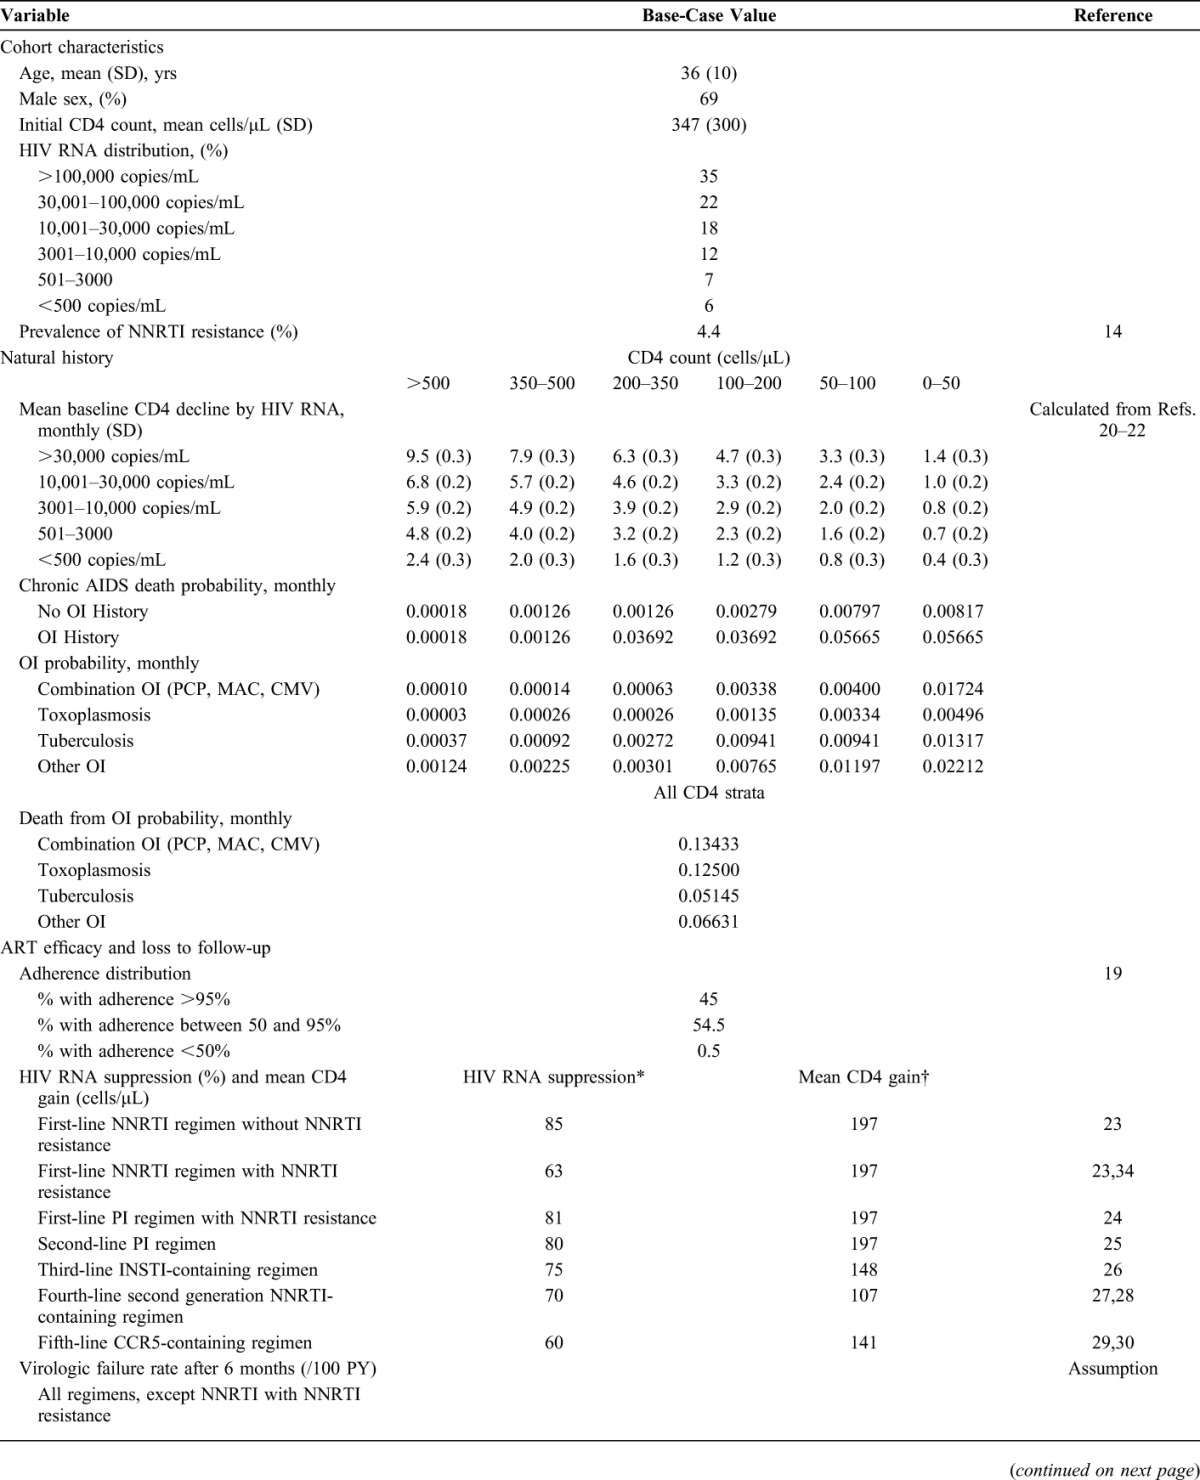
The simulated cohort consisted of treatment-naive HIV-infected adults, with age, sex, initial CD4 count, and HIV RNA levels estimated from the cohort of 1819 individuals who presented for HIV care at IPEC between 2000 and 2010 (Table 1). Sixty-nine percent were male, mean age was 36 years (SD, 10 years), and mean CD4 count at entry to care was 347 per microliter (SD, 300/μL). The prevalence of primary NNRTI resistance of 4.4% was derived from a surveillance study carried out in the 13 most populous Brazilian cities.14
TABLE 1.
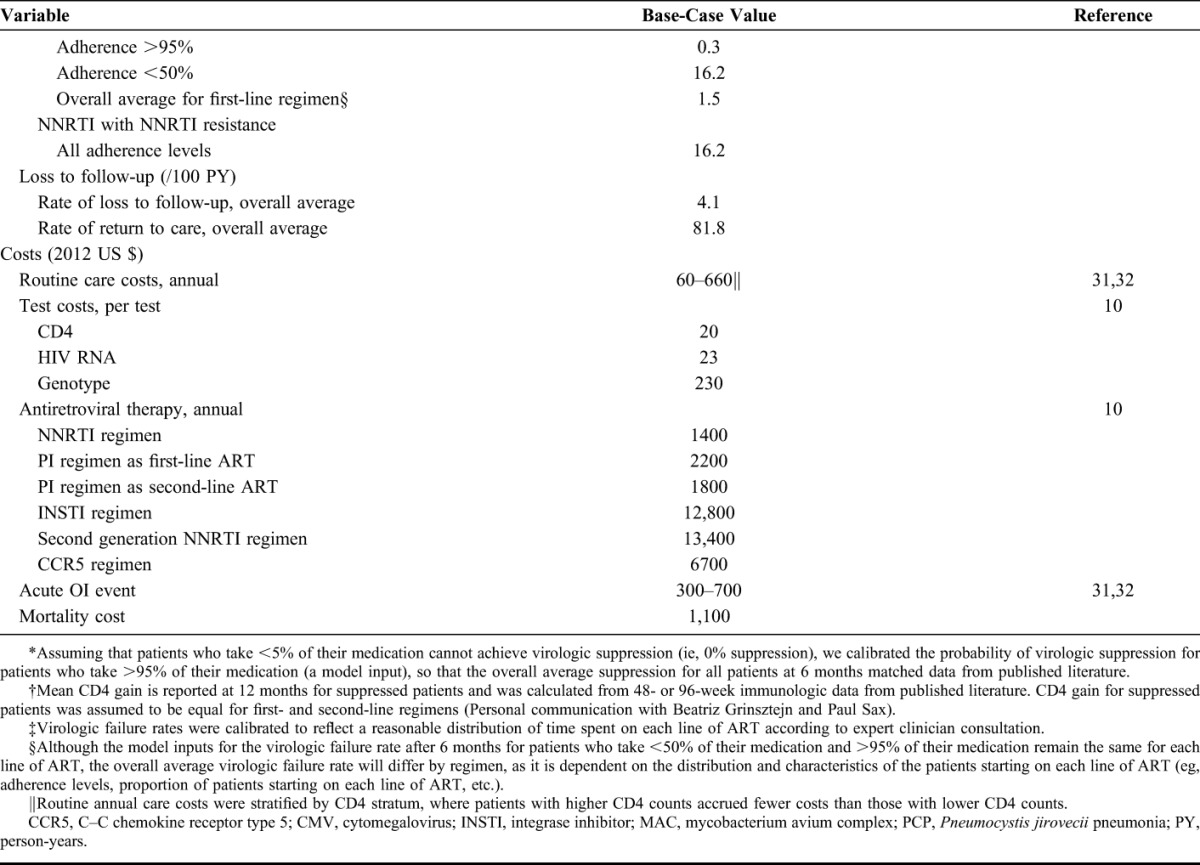
Base-Case Inputs for a Model of HIV Genotype-Resistance Testing in Brazil
Natural History
Natural history parameters were obtained from a study population that included adult patients (aged ≥18 years) who enrolled in the IPEC cohort and had a minimum follow-up of 60 days from 1986 through 2010. Natural history parameters included the incidence rate of OIs and mortality rates, stratified by both CD4 count and ART use as described in previous CEPAC Model publications.33 Within each CD4 stratum, OI incidence and mortality rates were assumed to remain constant for the time period evaluated and were converted into monthly probabilities for model input.
ART Efficacy and Loss to Follow-up
ART efficacy and loss to follow-up inputs were stratified by ART adherence levels. A logit adherence distribution was fit to a retrospective database study in the United States.19 We assumed that 0.5% of the cohort had poor adherence to ART (ie, <50% adherence), that 45% of the cohort had excellent adherence to ART (ie, >95% adherence), and that the remaining 54.5% fell between these 2 extremes. To determine ART efficacy, we assumed that patients who almost never take their medication (ie, those whose adherence is below 5%) do not achieve virologic suppression. We then calibrated the probability of virologic suppression for excellent adherers (>95%), interpolating linearly for all other adherence values, so that the overall average suppression for the entire cohort matched data from published literature for each regimen (Table 1). Patients who were suppressed on a given regimen faced an adherence-dependent monthly probability of virologic rebound. This risk was calibrated so that fewer than 2% of patients reach the last line of ART. Rates of loss to follow-up and return to care were derived from data from the IPEC cohort and were calculated to be 4.1 and 81.8 per 100 person-years, respectively (see Technical Appendix, Supplemental Digital Content, http://links.lww.com/QAI/A595).
No NNRTI Resistance, With and Without Genotype
In the model, patients who did not have NNRTI resistance were eligible to receive up to 5 sequential lines of ART. First-line therapy was an NNRTI-based regimen, and second-line therapy was a PI-based regimen. Patients who failed first- and second-line therapy received subsequent lines of ART that increased in regimen complexity and cost and decreased in rates of suppression (Table 1).
NNRTI Resistance Without Genotype
Patients who had NNRTI resistance but did not receive a genotype test received the same sequence of ART regimens as patients who did not have NNRTI resistance; however, their ability to successfully respond to the first NNRTI-based regimen was decreased. We lowered the virologic suppression rate at 24 weeks for the NNRTI regimen by applying a calculated relative risk of failure of 2.6,34 decreasing the overall average suppression from 85% to 63%. We assumed that all patients with NNRTI resistance who become suppressed at 24 weeks, regardless of their adherence level, face a rate of “late failure” on the NNRTI regimen of 16.2/100 person-years—equivalent to the rate of late failure after 24 weeks for poorly adherent patients without NNRTI resistance.
NNRTI Resistance With Genotype
Patients who had NNRTI resistance and received a genotype test received a PI-based regimen as their first-line ART, instead of an NNRTI-based regimen. After first-line failure, these patients began the same PI-based regimen that all patients received as second-line ART. Thereafter, these patients received the same third- through fifth-line ART as those without NNRTI resistance, with the same probability of suppression as nonresistant patients.
Costs
We conducted the economic analysis from the perspective of the public National Health System and, therefore, restricted our attention to direct HIV-related medical costs. All unit costs were obtained either from the Brazilian Ministry of Health or from the administrative department of IPEC and converted from Brazilian reais to 2012 US dollars using a GDP deflator and the average exchange rate for 2012.35 Costs for routine care and acute OI events were calculated by multiplying the unit costs for inpatient and outpatient visits by the number of inpatient and outpatient days associated with routine chronic care (stratified by CD4 count), acute events, and death, reported between 2005 and 2010 for the HIV Clinical Cohort at IPEC (see Technical Appendix, Supplemental Digital Content, http://links.lww.com/QAI/A595). The annual cost of the individual lines of ART ranged from $1400 to $13,400 (Table 1), and the cost of the genotype test was $230.10
Sensitivity Analyses
To understand the impact of data uncertainty on our findings, we conducted univariate and multivariate sensitivity analyses. Ranges explored for each parameter were derived from the literature (eg, NNRTI resistance prevalence) or defined based on plausible ranges (eg, NNRTI regimen efficacy in patients who had NNRTI resistance but did not receive a genotype test, genotype test cost, and subsequent-line ART costs). Multivariate sensitivity analyses were conducted on 3 of the most influential parameters to demonstrate their interactions.
RESULTS
Base Case
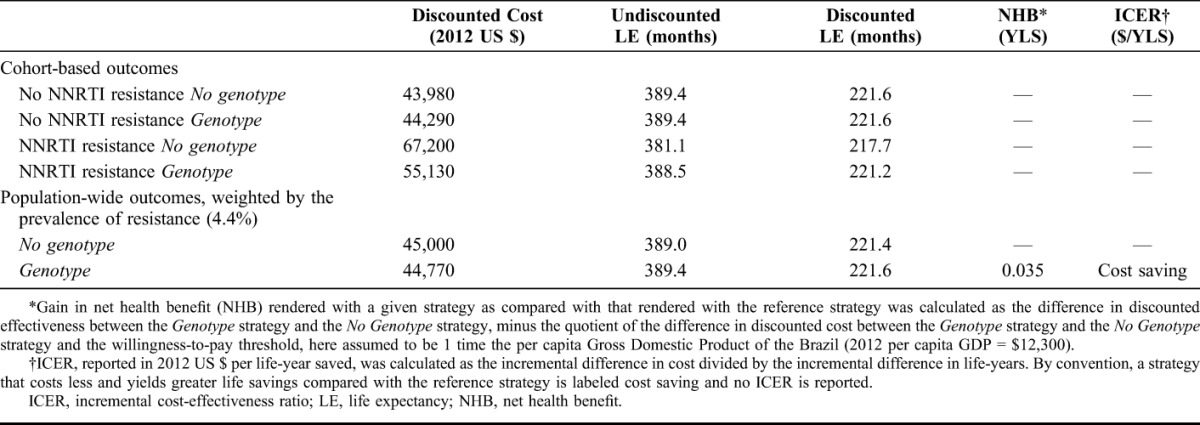
Among patients without NNRTI resistance, genotyping had no impact on discounted life expectancy (221.6 months) but slightly increased projected per-person lifetime costs from $43,980 to $44,290 (Table 2). For patients with NNRTI resistance, however, genotyping produced a substantial improvement in life expectancy (from 217.7 to 221.2 months) and a reduction in costs (from $67,200 to $55,130). These reduced costs are a result of fewer complications associated with viral load rebound and with a smaller proportion of time spent on more expensive third through fifth lines of ART. When weighting these results based on the prevalence of NNRTI resistance in Brazil (4.4%), the current standard of care in Brazil yielded a discounted life expectancy of 221.4 months (18.45 years) and a discounted lifetime cost of US $45,000. The use of genotype-resistance testing before ART initiation yielded a higher discounted life expectancy of 221.6 months (18.47 years) and a lower discounted lifetime cost of US $44,770. Therefore, the Genotype strategy was cost saving compared with No Genotype, because it costs less and yielded greater life expectancy. Genotype had a positive net health benefit of 0.035 discounted years of life saved (YLS); that is, it rendered a gain in net health benefit when compared with the No Genotype strategy.
TABLE 2.
Base-Case Results for an Analysis of HIV Genotype Testing in Brazil
Univariate Sensitivity Analysis
In univariate sensitivity analyses, we varied major input parameters independently within their plausible ranges. One-way sensitivity analyses yielded positive net health benefit across all plausible parameter ranges (Fig. 2). They also identified influential parameters that could produce noteworthy changes in net health benefit findings. The most influential parameter was NNRTI resistance prevalence which, when varied from 2% to 7%, yielded net health benefit values ranging from 0.003 to 0.070 YLS. As the efficacy of first-line NNRTI-based ART in resistant patients not receiving genotype testing increased, thus reducing the detrimental effect of NNRTI resistance, overall net health benefit of Genotype decreased. Reducing subsequent-line ART costs by 60% decreased the net health benefit of the Genotype strategy from the base-case value of 0.035 to 0.002 YLS. Other parameter variations that caused an appreciable decrease in net health benefit were increasing the genotype test cost and decreasing the probability of virologic failure after suppression for resistant patients not receiving a genotype test.
FIGURE 2.
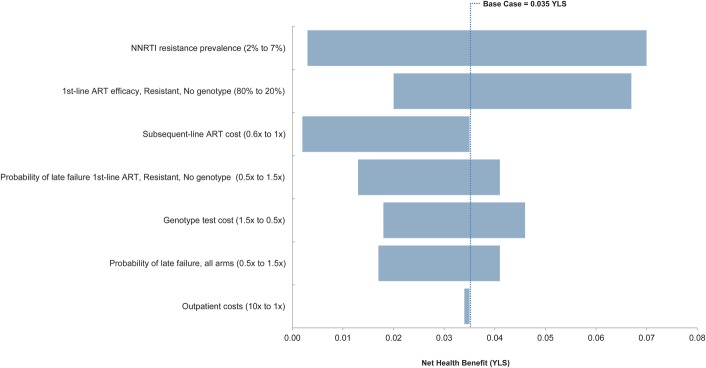
Univariate sensitivity analysis tornado plot of selected parameters. The diagram summarizes the results of a series of 1-way sensitivity analyses on the net health benefit of genotyping. Each horizontal bar represents the range of net health benefit produced by varying a given model parameter across the parameter ranges in parentheses. Net health benefit is defined as the YLS minus the quotient of the difference in cost between the 2 strategies and the annual willingness-to-pay threshold (here, the 2012 annual per capita GDP of Brazil US $12,300). The vertical line represents the base-case net health benefit for the Genotype strategy. NHB, net health benefit; LE, life expectancy.
 |
Multivariate Sensitivity Analysis
Figure 3 depicts the behavior of the cost-effectiveness findings as we varied 3 of the more influential parameters identified in the 1-way sensitivity analyses: the cost of the genotype test (increased and decreased 50% from baseline value); the cost of subsequent ART regimens (from 100% to 10% baseline value); and the prevalence of NNRTI primary resistance (from 0.1% to 5.0%). In the base-case scenario (depicted by the black dot in the central panel), we observed cost savings. Genotype was cost saving, for example, even when both subsequent-line ART costs decreased to 80% of baseline values and resistance prevalence decreased to 3.7%. If the cost of the genotype test was reduced by 50% (right panel), cost savings were achieved in a wider range of scenarios, including at resistance prevalence as low as 1.3%. Even when the genotype test cost was increased to 150% of baseline value (left panel), initial genotype remained a cost-effective strategy over a broad range of plausible parameter changes, such as reducing the cost of subsequent ART to 60% of baseline value while resistance prevalence decreased to 3.4%.
FIGURE 3.
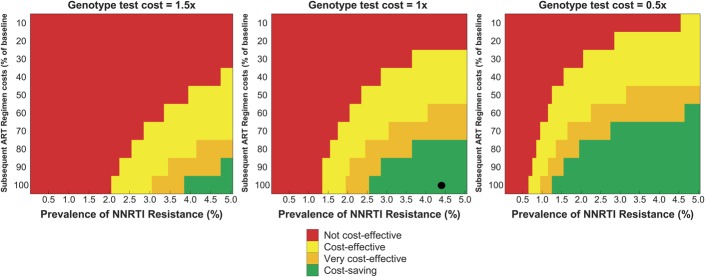
Multivariate sensitivity analysis color plot. Parameters varied simultaneously were genotype test cost, subsequent-line ART costs, and primary NNRTI resistance prevalence. Colors are arranged from green (cost saving) to red (not cost-effective). The black dot in the middle panel indicates the base-case result. ICER: Incremental cost-effectiveness ratio; not cost-effective: ICER >3 times the 2012 annual per capita GDP of Brazil of 2012 (ICER >$36,900); cost-effective: 1 time < ICER <3times the 2012 annual per capita GDP of Brazil ($12,300 < ICER < $36,900); very cost-effective: ICER $0 < ICER < 1 time the 2012 annual per capita GDP of Brazil ($0 < ICER < $12,300); cost saving: ICER <$0.
DISCUSSION
Since 1996, the Brazilian government has guaranteed universal provision of ART, free of charge, to HIV–infected individuals.4 ART guidelines for the country are set forth by the Department of Sexually Transmitted Diseases, AIDS, and Viral Hepatitis within the Ministry of Health. Although the current 2013 Brazilian national guidelines recommend genotype testing after failure of first-line ART, they do not recommend routine use of genotype testing before initiating first-line ART, citing a lack of evidence for the clear benefits of this strategy.
Genotype-resistance testing can help identify more effective antiretroviral regimens for patients, thus substantially increasing the likelihood of viral suppression and immune recovery.36 We used the most recent surveillance study of primary resistance conducted in 20 centers from 13 highly populous cities in Brazil14 and data from a large Brazilian clinical cohort to derive inputs for a simulation model for the present analysis. We found that genotype-resistance testing was cost saving at resistance prevalence as low as 2.6%, much lower than the reported value of 4.4%.
Although primary resistance prevalence was the most influential factor on the cost-effectiveness of initial genotype-resistance testing, subsequent-line ART costs were also an important factor. This is because, without a genotype test, resistant patients are likely to fail their initial regimen, experience poorer clinical outcomes, and spend an increased proportion of their lives on more expensive and less tolerable subsequent-line regimens. Over time, it is likely that these expensive regimen costs will decrease, making initial genotype-resistance testing less attractive. However, our results suggest that Genotype will remain cost-effective unless subsequent-line ART costs fall below 30% of their current value. Given that the Genotype strategy is projected to decrease per-patient lifetime costs by US $230 (Table 2), for an estimated 45,000 patients initiating ART in Brazil each year,10 and with stable costs over time, the Genotype strategy could yield a projected annual cost savings of US $10.4 million.
The results of this analysis should be interpreted in light of certain limitations in model parameters and assumptions. First, in the base case, we assumed that the prevalence of primary NNRTI resistance, a key parameter of this analysis, was similar across the country. Though this is certainly not the case, the HIV epidemic is mostly concentrated in large urban centers, and these were appropriately chosen for the nation-wide primary resistance prevalence study that was used to derive model inputs. Nonetheless, we conducted univariate and multivariate sensitivity analyses to evaluate the impact of plausible variation in NNRTI resistance prevalence. These analyses showed that, for most of the explored prevalence, the Genotype strategy either remained cost saving or reached cost-effective results. Second, although our standard-of-care strategy assumed that no one starting treatment would be offered a genotype test, the most recent guidelines published in 2013 state that pregnant women and individuals infected by an HIV-infected partner on ART could make use of the test. It is possible that, if we included these exceptions to the current Genotype strategy, the strategy would become less appealing. However, such changes would not alter our conclusions substantially because these populations represent only a small fraction of those starting ART in Brazil.37–39 Third, to obtain input data estimates for the model, we used data from the HIV-infected Cohort at IPEC and other published official Brazilian government sources. We used sensitivity analysis to evaluate which of these parameters influenced our findings most strongly and how our conclusions would be affected by the variation in the parameter values; we found that our conclusions were robust. Fourth, when modeling the Genotype strategy, we assumed it was completely implemented; inadequate implementation would yield both life expectancy and cost for the genotype strategy that are lower, though the cost-effectiveness ratio would be similar. Finally, the present analysis focuses on the health benefits that accrue to the individual and the economic implications for the health system but does not address potential population-level effects of primary resistance testing. Such population benefits might include decreased transmission of resistant virus to HIV-uninfected individuals, which would make the Genotype strategy even more appealing.
Previous economic analyses have shown the cost-effectiveness of initial genotype-resistance testing before initiating first-line ART therapy in the United States.9 Here, we present the first analysis to show the potential cost savings of this initial genotype strategy in a middle-income country. In Brazil, similar to antiretroviral drugs and other laboratory tests, genotype-resistance testing is provided by the federal government, free of charge, to patients in 24 reference centers throughout the country. Although obstacles were experienced during its implementation in 2001, the procedures required for performing the test are currently well established. Furthermore, the interpretation of the test result is carried out by a designated group of experts and follows a standardized procedure that includes evaluating the results in light of each patient's ART history and recommending a new ART regimen. By identifying individuals with primary resistance, genotype-resistance testing, with its 1-time cost, provides an opportunity for the health care provider to allocate patients to a regimen with a high likelihood of success and for the government to reduce overall costs of HIV care. We find that initial genotype-resistance testing will improve survival and decrease costs and should be incorporated into both HIV treatment guidelines and the standards of care in Brazil.
Supplementary Material
Footnotes
Supported by the National Institute of Allergy and Infectious Diseases (UM1 AI068636 and R01 AI058736).
Presented as a poster at the 2014 Conference on Retroviruses and Opportunistic Infections (CROI), March 3–6, 2014, Boston, MA.
P.M.L., B.G., and C.J.S. acknowledge funding from the National Council of Technological and Scientific Development (CNPq) and the Research Funding Agency of the State of Rio de Janeiro (FAPERJ). P.E.S. is a consultant to Abbott, BMS, Gilead, GSK, Merck, and Janssen and receives grant support from BMS, Gilead, and GSK. The remaining authors have no conflicts of interest to disclose.
The content is solely the responsibility of the authors and does not necessarily represent the official views of the National Institutes of Health.
Supplemental digital content is available for this article. Direct URL citations appear in the printed text and are provided in the HTML and PDF versions of this article on the journal's Web site (www.jaids.com).
REFERENCES
- 1.Berkman A, Garcia J, Munoz-Laboy M, et al. A critical analysis of the Brazilian response to HIV/AIDS: lessons learned for controlling and mitigating the epidemic in developing countries. Am J Public Health. 2005;95:1162–1172. [DOI] [PMC free article] [PubMed] [Google Scholar]
- 2.Nunn AS, da Fonseca EM, Bastos FI, et al. AIDS treatment in Brazil: impacts and challenges. Health Aff (Millwood). 2009;28:1103–1113. [DOI] [PMC free article] [PubMed] [Google Scholar]
- 3.UNAIDS. Brazil pioneers treatment for everyone. 2013. Available at: http://www.unaids.org/en/resources/presscentre/featurestories/2013/october/20131018brazil/. Accessed February 18, 2014.
- 4.Brazil Cabinet Subcommittee for Legal Affairs. Law No. 9313. 1996. Available at: https://www.planalto.gov.br/ccivil_03/leis/l9313.htm. Accessed February 18, 2014. [Google Scholar]
- 5.Brazilian Ministry of Health. Recomendações para Terapia Antirretroviral em Adultos Vivendo com HIV/AIDS. 2013. Available at: http://www.aids.gov.br/sites/default/files/anexos/publicacao/2013/55308/protocolo_hiv_web_pdf_41452.pdf. Accessed December 29, 2013.
- 6.Weinstein MC, Goldie SJ, Losina E, et al. Use of genotypic resistance testing to guide HIV therapy: clinical impact and cost-effectiveness. Ann Intern Med. 2001;134:440–450. [DOI] [PubMed] [Google Scholar]
- 7.Yazdanpanah Y, Vray M, Meynard J, et al. The long-term benefits of genotypic resistance testing in patients with extensive prior antiretroviral therapy: a model-based approach. HIV Med. 2007;8:439–450. [DOI] [PMC free article] [PubMed] [Google Scholar]
- 8.Levison JH, Wood R, Scott CA, et al. The clinical and economic impact of genotype testing at first-line antiretroviral therapy failure for HIV-infected patients in South Africa. Clin Infect Dis. 2013;56:587–597. [DOI] [PMC free article] [PubMed] [Google Scholar]
- 9.Sax PE, Islam R, Walensky RP, et al. Should resistance testing be performed for treatment-naive HIV-infected patients? A cost-effectiveness analysis. Clin Infect Dis. 2005;41:1316–1323. [DOI] [PubMed] [Google Scholar]
- 10.Brazilian Ministry of Health. Formal response to data request related to logistics and strategic resources for HIV/AIDS. Available at: www.aids.gov.br. Accessed February 18, 2014.
- 11.Goldie S, Yazdanpanah Y, Losina E, et al. Cost-effectiveness of HIV treatment in resource-poor settings—the case of Côte d'Ivoire. N Engl J Med. 2006;355:1141–1153. [DOI] [PubMed] [Google Scholar]
- 12.Walensky R, Wood R, Ciaranello A, et al. Scaling up the 2010 World Health Organization HIV treatment guidelines in resource-limited settings: a model-based analysis. Plos Med. 2010;7:e1000382. [DOI] [PMC free article] [PubMed] [Google Scholar]
- 13.Walensky RP, Park JE, Wood R, et al. The cost-effectiveness of pre-exposure prophylaxis for HIV infection in South African women. Clin Infect Dis. 2012;54:1504–1513. [DOI] [PMC free article] [PubMed] [Google Scholar]
- 14.Sprinz E, Netto EM, Patelli M, et al. Primary antiretroviral drug resistance among HIV type 1-infected individuals in Brazil. AIDS Res Hum Retroviruses. 2009;25:861–867. [DOI] [PubMed] [Google Scholar]
- 15.Siegel JE, Weinstein MC, Russell LB, et al. Recommendations for reporting cost-effectiveness analyses. Panel on Cost-Effectiveness in Health and Medicine. JAMA. 1996;276:1339–1341. [DOI] [PubMed] [Google Scholar]
- 16.World Health Organization. Macroeconomics and Health: investing in health for economic development. 2001. Available at: http://whqlibdoc.who.int/publications/2001/924154550x.pdf. Accessed February 18, 2014.
- 17.Stinnett AA, Mullahy J. Net health benefits: a new framework for the analysis of uncertainty in cost-effectiveness analysis. Med Decis Making. 1998;18(suppl 2):S68–S80. [DOI] [PubMed] [Google Scholar]
- 18.Cost-Effectiveness of Preventing AIDS Complications. Model User's Guide. Available at: http://web2.research.partners.org/cepac/model.html. Accessed February 18, 2014. [Google Scholar]
- 19.Sax PE, Meyers JL, Mugavero M, et al. Adherence to antiretroviral treatment and correlation with risk of hospitalization among commercially insured HIV patients in the United States. PLoS One. 2012;7:e31591. [DOI] [PMC free article] [PubMed] [Google Scholar]
- 20.Rodriguez B, Sethi AK, Cheruvu VK, et al. Predictive value of plasma HIV RNA level on rate of CD4 T-cell decline in untreated HIV infection. JAMA. 2006;296:1498–1506. [DOI] [PubMed] [Google Scholar]
- 21.Noubary F, Hughes MD. Assessing agreement in the timing of treatment initiation determined by repeated measurements of novel versus gold standard technologies with application to the monitoring of CD4 counts in HIV-infected patients. Stat Med. 2010;29:1932–1946. [DOI] [PMC free article] [PubMed] [Google Scholar]
- 22.Mellors JW, Muñoz A, Giorgi JV, et al. Plasma viral load and CD4+ lymphocytes as prognostic markers of HIV-1 infection. Ann Intern Med. 1997;126:946–954. [DOI] [PubMed] [Google Scholar]
- 23.Campbell TB, Smeaton LM, Kumarasamy N, et al. Efficacy and safety of three antiretroviral regimens for initial treatment of HIV-1: a randomized clinical trial in diverse multinational settings. Plos Med. 2012;9:e1001290. [DOI] [PMC free article] [PubMed] [Google Scholar]
- 24.Molina JM, Andrade-Villanueva J, Echevarria J, et al. Once-daily atazanavir/ritonavir versus twice-daily lopinavir/ritonavir, each in combination with tenofovir and emtricitabine, for management of antiretroviral-naive HIV-1-infected patients: 48 week efficacy and safety results of the CASTLE study. Lancet. 2008;372:646–655. [DOI] [PubMed] [Google Scholar]
- 25.Cahn P, Fourie J, Grinsztejn B, et al. Week 48 analysis of once-daily vs. twice-daily darunavir/ritonavir in treatment-experienced HIV-1-infected patients. AIDS. 2011;25:929–939. [DOI] [PubMed] [Google Scholar]
- 26.Steigbigel RT, Cooper DA, Kumar PN, et al. Raltegravir with optimized background therapy for resistant HIV-1 infection. N Engl J Med. 2008;359:339–354. [DOI] [PubMed] [Google Scholar]
- 27.Madruga JV, Cahn P, Grinsztejn B, et al. Efficacy and safety of TMC125 (etravirine) in treatment-experienced HIV-1-infected patients in DUET-1: 24-week results from a randomised, double-blind, placebo-controlled trial. Lancet. 2007;370:29–38. [DOI] [PubMed] [Google Scholar]
- 28.Katlama C, Haubrich R, Lalezari J, et al. Efficacy and safety of etravirine in treatment-experienced, HIV-1 patients: pooled 48 week analysis of two randomized, controlled trials. AIDS. 2009;23:2289–2300. [DOI] [PubMed] [Google Scholar]
- 29.Gulick RM, Lalezari J, Goodrich J, et al. Maraviroc for previously treated patients with R5 HIV-1 infection. N Engl J Med. 2008;359:1429–1441. [DOI] [PMC free article] [PubMed] [Google Scholar]
- 30.Lalezari J, Goodrich J, deJesus E, et al. Motivate 1 Study: efficacy and safety of maraviroc plus optimized background therapy in viremic, ART-experienced patients infected with CCR5-tropic HIV-1: 24-week results of phase 2b/3 studies. Paper presented at: Conference on Retroviruses and Opportunistic Infections; February 25–28, 2007; Los Angeles, CA. (Abstract).
- 31.Sistema de Gerenciamento da Tabela de Procedimentos Medicamentos e OPM (SIGTAP). Procedimento Publicado: Consulta Med Em Atenção Especializada. 2010. Available at: http://sigtap.datasus.gov.br/tabela-unificada/app/sec/inicio.jsp. Accessed February 18, 2014.
- 32.Departamento de Informática do Sistema Único de Saúde (DATASUS). Internações Hospitalares do SUS—por local de internação—Brasil. 2009. Available at: http://tabnet.datasus.gov.br/cgi/deftohtm.exe?sih/cnv/sxuf.def. Accessed February 18, 2014.
- 33.Freedberg KA, Scharfstein JA, Seage GR, III, et al. The cost-effectiveness of preventing AIDS-related opportunistic infections. JAMA. 1998;279:130–136. [DOI] [PubMed] [Google Scholar]
- 34.Goodman DD, Zhou Y, Margot NA, et al. Low level of the K103N HIV-1 above a threshold is associated with virological failure in treatment-naive individuals undergoing efavirenz-containing therapy. AIDS. 2011;25:325–333. [DOI] [PubMed] [Google Scholar]
- 35.International Monetary Fund. World economic Outlook database. 2012. Available at: http://www.imf.org/external/pubs/ft/weo/2012/01/weodata/index.aspx. Accessed February 18, 2014.
- 36.Durant J, Clevenbergh P, Halfon P, et al. Drug-resistance genotyping in HIV-1 therapy: the VIRADAPT randomised controlled trial. Lancet. 1999;353:2195–2199. [DOI] [PubMed] [Google Scholar]
- 37.Brazilian Ministry of Health. Política Brasileira de Enfrentamento da Aids: Resultados, Avanços e Perspectivas. 2012. Available at: http://www.aids.gov.br/sites/default/files/anexos/publicacao/2013/53077/em_portugu_s_93155.pdf. Accessed February 18, 2014.
- 38.Brazilian Ministry of Health. Progress Report on the Brazilian response to HIV/AIDS (2010-2011). 2012. Available at: http://www.unaids.org/en/dataanalysis/knowyourresponse/countryprogressreports/2012countries/UNGASS_2012_ingles_rev_08jun.pdf. Accessed February 18, 2014.
- 39.Veloso VG, Portela MC, Vasconcellos MTL, et al. HIV testing among pregnant women in Brazil: rates and predictors. Rev Saude Publica. 2008;42:859–867. [DOI] [PubMed] [Google Scholar]
Associated Data
This section collects any data citations, data availability statements, or supplementary materials included in this article.


