Abstract
Stereoscopic (S3D) displays create conflicts between the distance to which the eyes must converge and the distance to which the eyes must accommodate. Such conflicts require the viewer to overcome the normal coupling between vergence and accommodation, and this effort appears to cause viewer discomfort. Vergence-accommodation coupling is driven by the phasic components of the underlying control systems, and those components respond to relatively fast changes in vergence and accommodative stimuli. Given the relationship between phasic changes and vergence-accommodation coupling, we examined how the rate of change in the vergence-accommodation conflict affects viewer discomfort. We used a stereoscopic display that allows independent manipulation of the stimuli to vergence and accommodation. We presented stimuli that simulate natural viewing (i.e., vergence and accommodative stimuli changed together) and stimuli that simulate S3D viewing (i.e., vergence stimulus changes but accommodative stimulus remains fixed). The changes occurred at 0.01, 0.05, or 0.25Hz. The lowest rate is too slow to stimulate the phasic components while the highest rate is well within the phasic range. The results were consistent with our expectation: somewhat greater discomfort was experienced when stimulus distance changed rapidly, particularly in S3D viewing when the vergence stimulus changed but the accommodative stimulus did not. These results may help in the generation of guidelines for the creation and viewing of stereo content with acceptable viewer comfort.
Keywords: stereopsis, displays, vergence, accommodation, dynamics, tonic, phasic, cross-link, discomfort, fatigue, asthenopia
INTRODUCTION
In natural viewing, changes in viewing distance lead to the oculomotor adjustments of vergence and accommodation. Vergence is the eye movement in which the two eyes rotate in opposite directions to maintain binocular fixation on objects at different distances; inaccurate vergence leads to diplopia (double images). Accommodation is the change in focal power of the crystalline lens in the eye; inaccurate accommodation yields blurred images. In natural viewing, the stimuli to vergence and accommodation are consistent with one another: Looking at a nearer object requires convergence and an increase in lens focal power, while looking at a farther object requires divergence and a decrease in focal power. Because the distances to which the eyes must converge and accommodate are generally the same, the two responses are coupled such that changes in vergence produce changes in accommodation, and vice versa (Fincham & Walton, 1957; Krishnan, Shirachi, & Stark, 1977; Semmlow & Wenzel, 1979; Cumming & Judge, 1986). The coupling is produced by cross-links in the neural control system that governs oculomotor adjustments for near and far viewing.
Many models have offered explanations of how vergence and accommodation are driven by sensory input (Hung & Semmlow, 1980; Rosenfield & Gilmartin, 1988; Schor, 1992; Hung & Ciuffreda, 2002). Schor (1992) divides vergence and accommodation responses into three components: tonic, phasic, and cross-link. The tonic components change slowly and help maintain vergence and accommodation at appropriate values. The phasic components change quickly enabling fast reactions to changes in object distance. Interestingly, the cross-links are driven by the phasic, not tonic components. This helps vergence and accommodation respond quickly (Schor, 1986, 1992; Schor & Kotulak, 1986; Cumming & Judge, 1986).
To quantify vergence distance, we use diopters (D) instead of the more conventional meter angle (MA) so that vergence and accommodation distances can be expressed in the same units. Figure 1 illustrates how these three components—tonic, phasic, and cross-links—cooperate to drive vergence in response to a step change in object distance. The overall response should equal the sum of the responses from the three components. Initially the vergence stimulus and response are both at 1 diopter (D). Then the stimulus undergoes a step change to 2D. Because the vergence and accommodative stimuli undergo the same change, the signs of the phasic and cross-link responses are the same, so they work together to drive vergence rapidly to the appropriate value.
Figure 1.
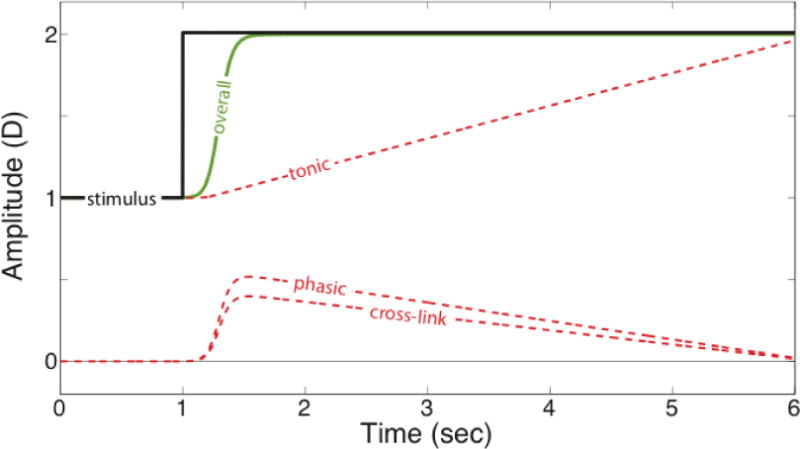
Vergence response to a step stimulus in natural viewing according to the model of Schor (1992). Response in diopters is plotted as a function of time. The black line represents the stimulus, which is at a distance of 1D initially and then steps to a distance of 2D. The dashed red lines represent the responses of the tonic, phasic, and cross-link components. The green solid line represents the vergence response itself, which is the sum of the three component responses. The initial response is mostly supplied by the phasic and cross-link responses. The tonic response increases slowly, but eventually maintains vergence at the appropriate value. Accommodative responses, which are not shown here, would be very similar.
Some situations stimulate different amounts of vergence and accommodation. A well-known example is optical correction for refractive error. The new spectacles or contact lenses change the accommodative stimulus by a fixed amount in diopters relative to the vergence stimulus. The resulting disagreement between the accommodative and vergence stimuli is called the vergence-accommodation conflict, and can induce visual discomfort and fatigue (Percival, 1928; Sheard, 1930). Through a great deal of experience with patients, eye doctors have established guidelines for avoiding adverse effects. One such guideline is a description of the conflicts that can be tolerated while maintaining single and sharp vision; this is the zone of clear single binocular vision (ZCSBV; Fry, 1937; Hofstetter, 1945). There is a smaller range of vergence-accommodation conflicts (within the ZCSBV) that do not cause discomfort; this is the zone of comfort (Percival, 1928; Sheard, 1930).
Stereoscopic 3D (S3D) displays also stimulate different levels of vergence and accommodation. The viewer’s distance from the screen, which is generally fixed, determines the accommodative stimulus. The viewer’s distance and the content on the display determine the vergence stimulus. The content can vary significantly thereby changing the vergence stimulus. Thus, S3D viewing generally creates time-varying vergence-accommodation conflicts: to maintain single, sharp vision, the viewer must converge and diverge the eyes depending on the moment-to-moment content while holding accommodation on the screen. Doing this would be best achieved by counter-acting the cross-links that attempt to drive vergence to be consistent with accommodation and vice versa. However, the attempt to counter-act the cross-links may well cause some or all of the discomfort and fatigue reported by viewers of S3D media (Hoffman, Girshick, Akeley, & Banks, 2008; Lambooij, IJesselsteijn, Fortuin, & Heynderickx 2009; Tam, Speranza, Yano, Shimono, & Ono, 2011; Howarth, 2011; Shibata, Kim, Hoffman, & Banks, 2011; Yang & Sheedy, 2011).
Shibata et al. (2011) measured the zone of comfort for S3D viewing and found that it is reasonably similar to the zones defined for optical correction. However, the dynamics of the conflict in S3D viewing may be an important determinant of the ensuing discomfort and fatigue. Speranza, Tam, Renaud, and Hur (2006) and Jung, Lee, Sohn, Park, and Ro (2012) found that faster motion in depth in S3D content induces greater discomfort, but they did not determine whether the cause of the discomfort was motion in depth per se, or changes in the vergence-accommodation conflict. Given that rapid changes drive the phasic components of the vergence-accommodation cross-links, we hypothesize that rapid changes in the vergence-accommodation conflict cause more discomfort than slow changes do. We tested this hypothesis by comparing discomfort in natural and S3D viewing with rapid and slow changes in stimulus distance.
METHODS
Apparatus
To simulate natural and S3D viewing, we used a volumetric stereo display (Love, Hoffman, Hands, Gao, Kirby, & Banks, 2009; Figure 2). The configuration is the same as a conventional stereoscope except for the switchable lenses in front of each eye and the novel display technique. The lenses changed focal power among four possible values that were separated by 0.6D. The changes in the focal power were synchronized with the frames of the corresponding display screen. The lenses went through the four focal powers as images appropriate for each focal distance were displayed in a time-multiplexed fashion. As the lenses change focal power from plane 1 to plane 4, the displays synchronously present images appropriate for those four distances. The lenses switch power at 180Hz, so the cycle through four focal states occurs at 45Hz. With this method, an apparent 3D volume is created and viewer accommodation through that volume brings different planes in and out of focus at the retina. The displays were CRTs (Iiyama HM204DT) running at 180Hz, resulting in a 45Hz refresh rate for the volumetric 3D scene.
Figure 2.
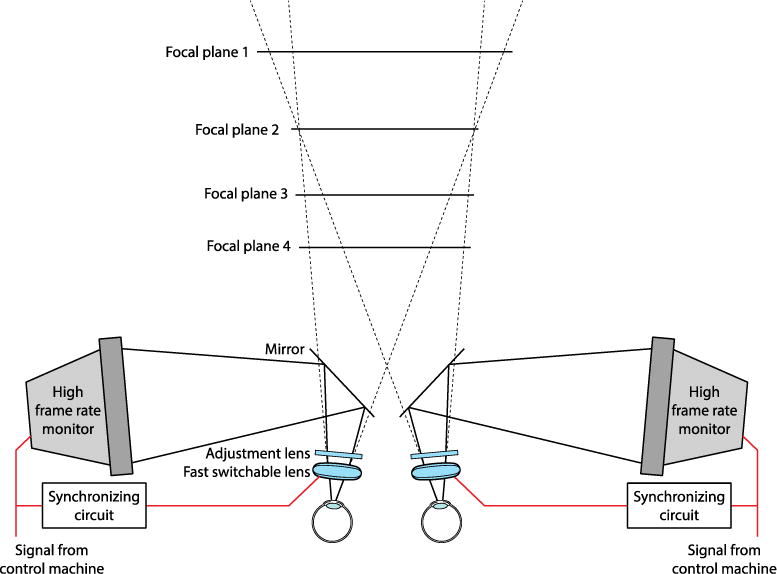
Volumetric stereo 3D display. The overall design is a stereoscope with independent light paths for the two eyes. The key elements are high-speed switchable lenses in front of each eye. The lenses change focal power to one of four possible values. By synchronizing the lenses with high-frame-rate CRTs, the apparatus updates each focal plane at 45Hz. The retinal images from one focal plane become sharp when the viewer accommodates to that plane; the images from the other planes become blurred. The viewer’s optics creates this pattern of sharp and blurred images.
When focal distance corresponded to one of the four possible focal states of the lenses, we illuminated pixels during that one focal state, but not the other three. To simulate stimuli in-between focal planes, we used depth-weighted blending (Akeley, Watt, Girshick, & Banks, 2004; Ravikumar, Akeley, & Banks, 2011). The left side of Figure 3 shows how depth-weighted blending simulates a 3D surface between two focal planes. The image locations on each plane are determined by projecting each object point along the appropriate line of sight. Image intensity depends on the dioptric distance from the object to the corresponding point as illustrated on the right side of the figure. The stimuli created in this fashion have an appearance that is a good approximation to natural viewing (Ravikumar et al., 2011) and can drive accurate accommodative responses (MacKenzie, Hoffman, & Watt, 2010, MacKenzie, Dickson, & Watt, 2011).
Figure 3.
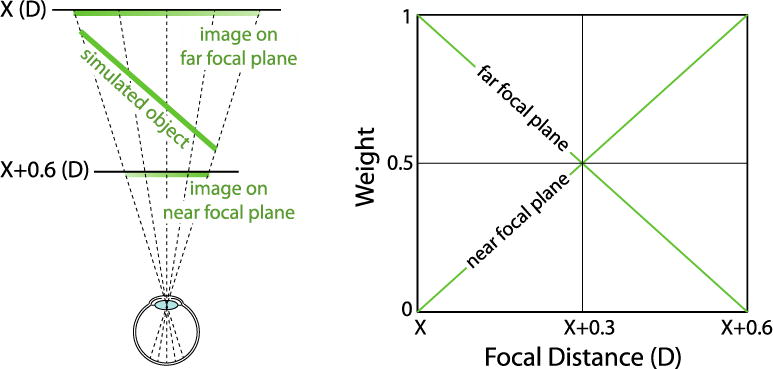
Depth-weighted blending. Left: A slanted plane is simulated between two adjacent focal planes. Pixel intensities are determined on the two focal planes by depth-weighted blending. Each object point on the simulated object is projected onto the two focal planes along a line of sight. The intensity of the image point depends on the dioptric distance from the focal plane to the corresponding object point. Right: The intensity weighting function for the blending. An object at X is on the far plane and hence the full intensity is applied on the far plane. Similarly, an object at X+0.6 has full intensity applied on the near plane. For focal distances between the two planes, the intensity weighting value changes linearly with the change in dioptric distance from the target to each plane.
Because the apparatus has multiple focal planes, image quality is very dependent on viewer position; the images on different focal planes only align on the retina when viewed from a specific location. To achieve accurate alignment, we positioned the subject with a custom bite bar. A hardware and software calibration procedure conducted for each subject assures accurate alignment (Hillis & Banks, 2001; Akeley et al., 2004). The subject remained on the bite bar throughout the experiment. If the subject normally wears an optical correction (i.e., spectacles or contact lenses), they wore it during the calibration procedure and during the experiment itself.
The apertures of the lens assemblies occluded the frames of the CRTs. Because the apertures were very close to the eyes, their edges were very blurred. Therefore, there was no useful cue to fusion from either the CRT frames or the apertures.
Subjects
Thirty-four subjects, aged 22 to 31 years, participated. All had normal or corrected-to-normal visual acuity and stereoacuity. As we said, if they normally wear an optical correction, they wore it during the experiment. None of the subjects were aware of the experimental hypothesis. Appropriate consent and debriefing were done according to the Declarations of Helsinki.
Stimuli & Procedure
The stimulus was a random-dot stereogram simulating a sinusoidal corrugation in depth. The stereogram appeared in a circular patch with a diameter of 4.2°. Dot density was 43 dots/deg2, corrugation frequencies were 1, 1.6, and 2.4cpd, corrugation orientation was −10 or +10° from horizontal, and peak-to-trough disparity amplitude was 4–4.4arcmin.
Subjects performed a two-alternative, forced-choice psychophysical procedure. Stimuli were presented for 1.4sec and subjects indicated whether the corrugation orientation was −10 or +10°. Each stimulus presentation was followed immediately by another. To perform the psychophysical task correctly, one must converge and accommodate reasonably accurately (Banks, Gepshtein, & Landy, 2004), so we used task performance as a check that the subject had indeed converged and accommodated accurately. Three of the 34 participants failed to exceed the criterion of 70% correct in every condition, so their data were excluded from further analysis.
We modulated the vergence and accommodative distances of the stimuli sinusoidally; the modulation frequencies and amplitudes are provided in Table 1. In the natural-viewing conditions, the vergence and accommodative distances were always the same, so they were modulated together. In the S3D-viewing conditions, the vergence distance was modulated while the accommodative distance remained constant. The sinusoidal change in the vergence stimulus was accomplished in the conventional fashion by displacing the images in opposite directions on the two CRTs (thereby changing binocular disparity). The sinusoidal changes in the accommodative stimulus were accomplished by using the multiple focal planes of the apparatus along with depth-weighted blending. Subjects reported that the changes looked smooth and natural. The modulations occurred throughout the experimental session thereby bridging individual stimulus presentations. The modulation frequencies were 0.01, 0.05, and 0.25Hz, which correspond to modulation periods of 100, 20, and 4sec, respectively. We chose those frequencies because, according to Schor (1986, 1992), the lowest should not stimulate the phasic components, and therefore should not stimulate the vergence-accommodation cross-links, and the highest should stimulate the phasic components and the cross-links.
Table 1.
Experimental Conditions
| Condition | Description | Modulation Frequency (Hz) | Vergence Distance (D) | Vergence Distance (m) | Accommodative Distance (D) | Accommodative Distance (m) |
|---|---|---|---|---|---|---|
| 1 | Low frequency, natural viewing | 0.01 | 0.1 and 1.3 | 10 and 0.77 | 0.1 and 1.3 | 10 and 0.77 |
| 2 | Low frequency, S3D viewing | 0.01 | 0.1 and 1.3 | 10 and 0.77 | 0.1 | 10 |
| 3 | Medium frequency, natural viewing | 0.05 | 0.1 and 1.3 | 10 and 0.77 | 0.1 and 1.3 | 10 and 0.77 |
| 4 | Medium frequency, S3D viewing | 0.05 | 0.1 and 1.3 | 10 and 0.77 | 0.1 | 10 |
| 5 | High frequency, natural viewing | 0.25 | 0.1 and 1.3 | 10 and 0.77 | 0.1 and 1.3 | 10 and 0.77 |
| 6 | High frequency, S3D viewing | 0.25 | 0.1 and 1.3 | 10 and 0.77 | 0.1 | 10 |
On each testing day, we presented two conditions—natural viewing and S3D viewing—at one temporal frequency. Subjects experienced these two conditions in random order from day to day. Neither the subject nor the experimenter knew which condition was being run in a given session. Thus, the experimental procedure was “double blind”.
The order of temporal frequencies was randomized across subjects and days. Each condition was 20min long. Subjects took a break of 30min after the first condition before starting the second condition on a given day; they did so to recover from whatever discomfort they may have experienced in the first condition. We encouraged subjects to take a longer break if they wanted, but most did not.
To measure visual discomfort, we used questionnaires developed by Hoffman and colleagues (Hoffman et al., 2008; Shibata et al., 2011). Subjects answered the symptom questionnaire (Figure 4, left) after each 20-min session, and the session-comparison questionnaire (Figure 4, right) after the two sessions of the day. All but one question in the symptom questionnaire (question #3 asking about neck and back) were related to reported symptoms of visual discomfort caused by vergence-accommodation conflicts (Sheedy, Hayes, & Engle, 2003). We did not give subjects a questionnaire before testing because we were interested in comparing discomfort with natural as opposed to S3D viewing and were not interested in determining how much discomfort was caused simply by being in the experiment.
Figure 4.
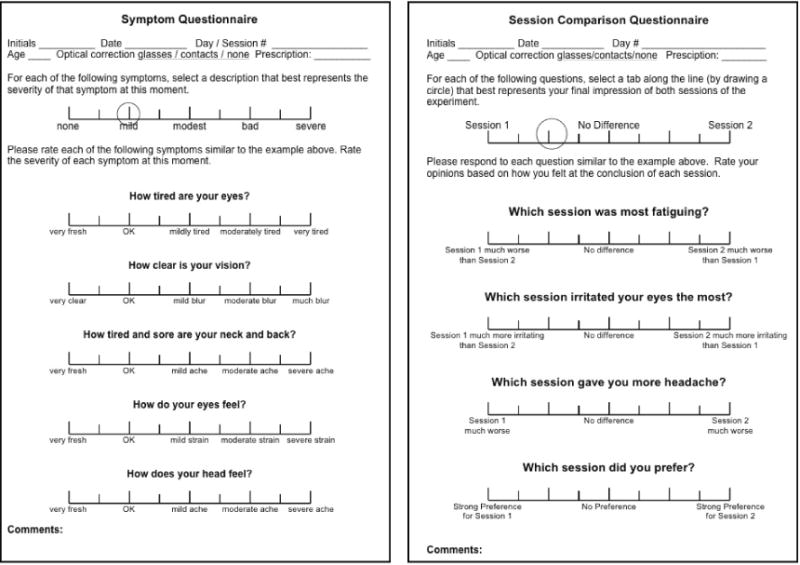
Questionnaires for measuring discomfort. Left: The symptom questionnaire. Subjects answered these five questions after each session. Scores of 1 to 9 were assigned to the tick marks on the scale. Right: The session-comparison questionnaire. Subjects answered these four questions after every two sessions at a given temporal frequency. Scores of 1 to 9 were again assigned to the tick marks.
RESULTS
Performance
Figure 5 shows the performance scores from the orientation-discrimination task, averaged across the 31 subjects, for the various conditions of the experiment. The scores were always higher in natural viewing than in S3D viewing, but the only statistically significant difference between the two conditions occurred at 0.25Hz (p=0.022, t-test, two-tailed). Thus, vergence-accommodation conflicts caused more difficulty for visual performance when the conflicts changed rapidly. However, ceiling effects may have obscured performance differences between natural and S3D viewing at slower rates because performance at those rates was close to 100%.
Figure 5.
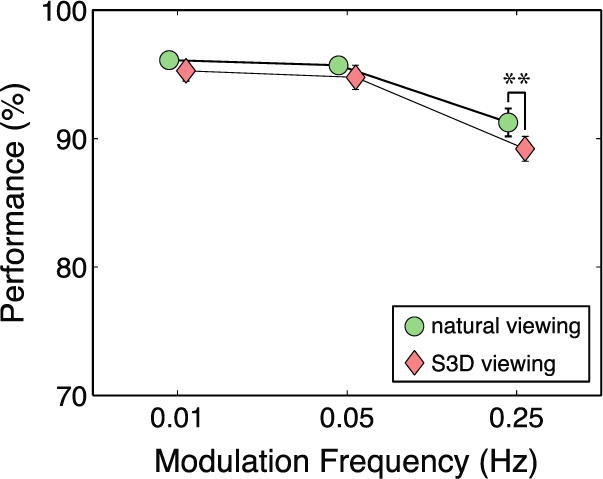
Average performance scores. Percent-correct performance in the orientation-discrimination task is plotted as a function of modulation frequency. Green circles and red diamonds represent the data from natural and S3D viewing, respectively. Error bars are standard errors. Double asterisks indicate a statistically significant difference (p<0.05, t-test, two-tailed).
Visual discomfort
Figures 6 and 7 show the results from the symptom questionnaire, averaged across subjects. Each panel in Figure 6 shows the results from one question. Figure 7 shows the same results when the vision-related questions were combined (left panel) and when the vision- and head-related questions were combined (right panel). We used those particular combinations because these symptoms have been most associated with visual discomfort (Sheedy, Hayes, & Engle, 2003).
Figure 6.

Results from the symptom questionnaire. Each panel shows the results from one question (Figure 4, left). From left to right, the questions concern eye tiredness, vision clarity, neck and backache, eyestrain, and headache. The abscissa in each panel is modulation frequency, and the ordinate is symptom rating (larger numbers indicate more severe symptoms). The green circles are for the natural-viewing condition and the red diamonds are for the S3D-viewing condition. Each data point is the mean of 31 subjects’ data. Error bars represent standard errors. Double asterisks indicate a significant difference (p<0.05).
Figure 7.
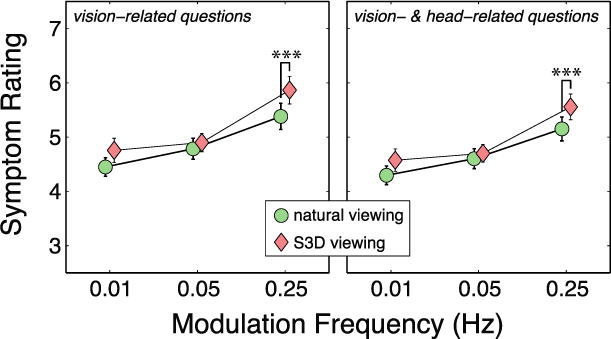
Average results from the symptom questionnaire combined across some questions. Left: Results for vision-related questions (numbers 1, 2, and 4 in Figure 4). The abscissa is modulation frequency and the ordinate is symptom severity. The double asterisk indicates a statistically significant difference between the S3D- and natural-viewing conditions (p<0.01). Right: Results for eye- and head-related questions. The abscissa and ordinate are respectively modulation frequency and symptom severity. The results for questions 1, 2, 4, and 5 (Figure 4) have been combined and averaged across subjects. The triple asterisk indicates a statistically significant difference between the S3D- and natural-viewing conditions (p<0.01).
We conducted a repeated-measures ANOVA on all of the symptom-questionnaire data. The main effect of modulation frequency was statistically significant for every vision-related symptom (p<0.01) and headache (ANOVA, p=0.018). Specifically, more severe symptoms were reported at higher modulation frequencies in both the natural- and S3D-viewing conditions. The main effect of viewing condition (S3D vs natural) was significant for eye tiredness (p = 0.048) and marginally significant for eyestrain (p=0.089). The interaction between modulation frequency and viewing condition was significant for vision clarity (p=0.0097), meaning that more severe symptoms were reported in the S3D condition than in the natural-viewing condition. At modulation frequencies of 0.01 and 0.05Hz, the symptom ratings for all questions were not significantly different between the natural- and S3D-viewing conditions. At 0.25Hz, however, symptoms in S3D viewing were significantly worse than in natural viewing for vision clarity (p=0.0012, Wilcoxon signed-rank test). As expected, there was no difference in neck and back symptoms as a function of modulation frequency nor between natural and S3D viewing.
When we examined the results for the combined vision-related questions (1, 2, & 4; Figure 4), we found no significant differences in those symptoms between the natural and S3D viewing conditions when the modulation frequency was 0.01 or 0.05Hz. However, at 0.25Hz, the vision-related symptoms were significantly more severe in S3D viewing than in natural viewing (p=0.0073, Wilcoxon signed-rank test, two-tailed). When we added the head-related question (#5; Figure 4) to the vision-related questions, we found that symptoms were significantly more severe in S3D viewing than in natural viewing (p=0.0081) at the highest modulation frequency, but not at the lower frequencies. The expected differences were generally statistically reliable, but they were also small numerically. The small differences were probably due in part to subjects’ tendency to not use extreme values on the questionnaire scales.
Figure 8 shows the results from the session-comparison questionnaire in which subjects reported differences between the natural-viewing and S3D-viewing sessions. A score of 5 indicates no difference, while scores greater than 5 mean the symptoms were more severe in S3D viewing and scores less than 5 mean the opposite. The main effect of frequency was not significant for any of the symptoms (one-way, repeated-measures ANOVA). At a modulation frequency of 0.01Hz and 0.05Hz, none of the symptoms were significantly different from 5 (Wilcoxon signed-rank test, two-tailed). However, at 0.25Hz, the scores for general fatigue and eye irritation were significantly greater than 5 (p<0.05) and the score for headache was marginally significantly greater than 5 (p=0.098). Thus, there was again a small, but clear tendency for subjects to experience more severe symptoms in S3D viewing than in natural viewing at the highest modulation frequency.
Figure 8.

Results from the session-comparison questionnaire. From left to right, the panels show the results for questions 1, 2, 3, and 4 in the session-comparison questionnaire (Figure 4, right). Those questions concern respectively general fatigue, eye irritation, headache, and a general preference for one condition over another. The conditions being compared are natural viewing and S3D viewing. A comparison score of 5 means no difference between the two. Scores greater than 5 mean that S3D viewing caused more severe symptoms or was less preferred. Scores less than 5 mean the opposite. The double asterisks indicate a significant difference from 5 (p<0.05, Wilcoxon signed-rank test, two-tailed). Single asterisk indicates marginally significant difference from 5 (p<0.1).
DISCUSSION
Summary of findings
There are two main findings: 1) Vision-related symptoms were more severe when object distance changed relatively rapidly, whether vergence and accommodative distance changed in unison (i.e., natural viewing) or only vergence distance changed (S3D viewing). 2) At high frequencies, vision-related symptoms were somewhat more severe with S3D viewing than with natural viewing.
No symptom was significantly smaller in S3D viewing than in natural viewing. Thus, relatively rapid changes in object distance produce visual discomfort; when the changes are in vergence distance only—as they are in S3D viewing—they produce somewhat more visual discomfort. Again we emphasize that the effect is consistent but fairly small. Schor and Kotulak (1986) found with a modulation amplitude of 1D that the phasic component is active at 0.25Hz, but not 0.05Hz. Thus, visual discomfort (and perhaps headache) may be associated with the phasic component in the vergence-accommodation control system and the cross-links may be additionally associated with discomfort. The latter finding makes sense because the vergence-accommodation control system must counter-act the action of the cross-links to make sure that the viewer can converge to one distance while accommodating to another.
There is some evidence that the crosslinks can also be driven by the tonic components (Rosenfield & Gilmartin, 1988; Ebenholtz & Fisher, 1982). But we observed no significant differences at 0.01Hz, a frequency at which everyone agrees that the tonic components dominate the responses. Thus, even if the crosslink can be driven by the tonic components, the visual system can handle the vergence-accommodation conflict as long as the conflict changes slowly.
Dynamics and the zone of comfort
The zone of comfort is normally expressed in a static sense (Percival, 1928; Sheard, 1930; Shibata et al., 2011). Our results show that the zone also depends to some degree on stimulus dynamics. Specifically, somewhat more visual discomfort is experienced when object distance changes rapidly, particularly when the changes require altering vergence while holding accommodation fixed. Why then is discomfort experienced with static changes in the vergence-accommodation conflict such as occurs with optical correction for refractive error?
The stimulation of the vergence-accommodation control system is very different with optical correction compared to S3D viewing. A new optical correction introduces a constant offset between vergence and accommodative stimuli, while S3D viewing causes dynamic changes in the offset. The discomfort experienced with optical correction is temporary: We know from clinical experience that the patient will adjust in time to the offset and restore visual comfort (Henson & North, 1980; North & Henson, 1985). We speculate that the discomfort is due to stimulation of the phasic component when the step change occurs, and that the dissipation of discomfort is due to adaptation in the control system, which is presumably mediated by the tonic components. In S3D viewing, no simple adaptation can occur—such as adjusting the offset in the tonic component of the vergence or accommodation—because the offset between the vergence and accommodation stimuli is constantly changing. We hypothesize, therefore, that viewers will be less able to adapt to changes in the vergence and accommodative stimuli in S3D viewing in comparison to the adaptation they can achieve with optical correction.
Guidelines for S3D viewing
Our findings suggest that the zone of comfort will become somewhat narrower when object distance changes rapidly and less so when distance changes slowly. Thus, we suggest a guideline for minimizing visual discomfort in S3D viewing. In addition to the standard guideline of minimizing the magnitude of the vergence-accommodation conflict by keeping objects of interest near the screen (Mendiburu, 2009; Shibata et al., 2011), one should also minimize the rate of change in distance, particularly with objects that the viewer might be fixating. By minimizing the rate of change, the phasic components of the vergence-accommodation control system will not be stimulated and discomfort can be minimized. If one wishes to use large differences in object distance relative to the screen, it would be best to introduce those differences slowly, so the vergence-accommodation control system can adapt to the change.
Interestingly, this guideline differs at least one recommendation in the cinematography literature. When a content creator wishes to show large disparities, Mendiburu (2009) advises him or her to interleave the segments with large disparities with segments containing small disparities (pp. 83 and 88). Our results imply that it would be better to introduce large disparities slowly, not intermittently, so the vergence and accommodation control system can adjust to the resulting conflicts and allow the viewer to remain reasonably comfortable.
Highlights.
Vergence-accommodation conflicts that vary quickly cause more visual discomfort than conflicts that vary slowly.
We tested three temporal frequencies of conflict modulation: 0.01, 0.05, and 0.25Hz.
At 0.01 and 0.05Hz, visual discomfort due to natural and S3D viewing did not differ significantly.
At 0.25Hz, visual discomfort due to S3D viewing was significantly worse than that due to natural viewing.
Acknowledgments
This research was supported by a research grant from NIH (R01-EY12851). We thank Clifton M. Schor for helpful discussion.
Footnotes
Publisher's Disclaimer: This is a PDF file of an unedited manuscript that has been accepted for publication. As a service to our customers we are providing this early version of the manuscript. The manuscript will undergo copyediting, typesetting, and review of the resulting proof before it is published in its final citable form. Please note that during the production process errors may be discovered which could affect the content, and all legal disclaimers that apply to the journal pertain.
Contributor Information
Joohwan Kim, Email: joohwankim@berkeley.edu, Vision Science Program, University of California, Berkeley, Berkeley, CA 94720, USA.
David Kane, Email: d.kane.berkeley@gmail.com, Vision Science Program, University of California, Berkeley, Berkeley, CA 94720, USA.
Martin S. Banks, Email: martybanks@berkeley.edu, School of Optometry, Vision Science Program, University of California, Berkeley, Berkeley, CA 94720, USA.
References
- Akeley K, Watt SJ, Girshick AR, Banks MS. A stereo display prototype with multiple focal distances. ACM Transactions on Graphics. 2004;23(3):804–813. [Google Scholar]
- Banks MS, Gepshtein S, Landy MS. Why is spatial stereoresolution so low? The Journal of Neuroscience. 2004;24(9):2077–2089. doi: 10.1523/JNEUROSCI.3852-02.2004. [DOI] [PMC free article] [PubMed] [Google Scholar]
- Cumming BG, Judge SJ. Disparity-induced and blur-induced convergence eye movement and accommodation in the monkey. Journal of Neurophysiology. 1986;55(5):896–914. doi: 10.1152/jn.1986.55.5.896. [DOI] [PubMed] [Google Scholar]
- Ebenholtz SM, Fisher SK. Distance adaptation depends on plasticity in the oculomotor control system. Perception and Psychophysics. 1982;31:551–560. doi: 10.3758/bf03204187. [DOI] [PubMed] [Google Scholar]
- Fincham EF, Walton J. The reciprocal actions of accommodation and convergence. Journal of Physiology. 1957;137(3):488–508. doi: 10.1113/jphysiol.1957.sp005829. [DOI] [PMC free article] [PubMed] [Google Scholar]
- Fry GA. An experimental analysis of the accommodation convergence relation. American Journal of Optometry. 1937;11:64–76. [Google Scholar]
- Henson DB, North R. Adaptation to prism-induced heterophoria. American Journal of Optometry and Physiological Optics. 1980;57(3):129–137. doi: 10.1097/00006324-198003000-00001. [DOI] [PubMed] [Google Scholar]
- Hillis JM, Banks MS. Are corresponding points fixed? Vision Research. 2001;41:2457–2473. doi: 10.1016/s0042-6989(01)00137-7. [DOI] [PubMed] [Google Scholar]
- Hoffman DM, Girshick AR, Akeley K, Banks MS. Vergence-accommodation conflicts hinder visual performance and cause visual fatigue. Journal of Vision. 2008;8(3):33, 1–30. doi: 10.1167/8.3.33. [DOI] [PMC free article] [PubMed] [Google Scholar]
- Hofstetter HW. The zone of clear single binocular vision. American Journal of Optometry and Archives of American Academy of Optometry. 1945;22(7):301–384. [Google Scholar]
- Howarth PA. Potential hazards of viewing 3-D stereoscopic television, cinema and computer games: A review. Ophthalmic and Physiological Optics. 2011;31:111–122. doi: 10.1111/j.1475-1313.2011.00822.x. [DOI] [PubMed] [Google Scholar]
- Hung GK, Ciuffreda KJ. Models of the Visual System. New York, NY: Kluwer Academic/Plenum Publishers; 2002. [Google Scholar]
- Hung GK, Semmlow JL. Static behavior of accommodation and vergence: computer simulation of an interactive dual-feedback system. IEEE Transactions on Biomedical Engineering. 1980;27(8):439–447. doi: 10.1109/TBME.1980.326752. [DOI] [PubMed] [Google Scholar]
- Jung YJ, Lee SI, Sohn H, Park HW, Ro YM. Visual comfort assessment metric based on salient object motion information in stereoscopic video. Journal of Electronic Imaging. 2012;21(1):011008. [Google Scholar]
- Krishnan VV, Shirachi D, Stark L. Dynamic measures of vergence accommodation. American Journal of Optometry and Physiological Optics. 1977;54:470–473. doi: 10.1097/00006324-197707000-00007. [DOI] [PubMed] [Google Scholar]
- Lambooij M, IJsselsteijn W, Fortuin M, Heynderickx I. Visual discomfort and visual fatigue of stereoscopic displays: A review. Journal of Imaging Science and Technology. 2009;53(3):030201-1–030201-14. [Google Scholar]
- Love GD, Hoffman DM, Hands PJW, Gao J, Kirby AK, Banks MS. High-speed switchable lens enables the development of a volumetric stereoscopic display. Optics Express. 2009;17(18):15716–15725. doi: 10.1364/OE.17.015716. [DOI] [PMC free article] [PubMed] [Google Scholar]
- MacKenzie KJ, Dickson RA, Watt SJ. Vergence and accommodation to multiple-image-plane stereoscopic displays: ‘Real world’ responses with practical image-plane separations? SPIE: Stereoscopic Displays and Applications. 2011;7863:786315. [Google Scholar]
- MacKenzie KJ, Hoffman DM, Watt SJ. Accommodation to multiple-focal-plane displays: Implications for improving stereoscopic displays and for accommodation control. Journal of Vision. 2010;10(8):22, 1–20. doi: 10.1167/10.8.22. [DOI] [PubMed] [Google Scholar]
- Mendiburu B. 3D Movie Making: Stereoscopic Digital Cinema from Script to Screen. Oxford, UK: Focal Press, Elsevier; 2009. [Google Scholar]
- North R, Henson DB. Adaptation to lens-induced heterophorias. American Journal of Optometry and Physiological Optics. 1985;62(11):774–780. doi: 10.1097/00006324-198511000-00009. [DOI] [PubMed] [Google Scholar]
- Percival AS. The Prescribing of Spectacles. Bristol, UK: John Wright & Sons Ltd; 1928. [Google Scholar]
- Ravikumar S, Akeley K, Banks MS. Creating effective focus cues in multi-plane 3D displays. Optics Express. 2011;19(21):20940–20952. doi: 10.1364/OE.19.020940. [DOI] [PMC free article] [PubMed] [Google Scholar]
- Rosenfield M, Gilmartin B. The effect of vergence adaptation on convergent accommodation. Americal Journal of Optometry and Physiological Optics. 1988;65(2):118–126. doi: 10.1097/00006324-198802000-00008. [DOI] [PubMed] [Google Scholar]
- Schor CM. A dynamic model of cross-coupling between accommodation and convergence: Simulations of step and frequency responses. Optometry and Vision Science. 1992;69(4):258–269. doi: 10.1097/00006324-199204000-00002. [DOI] [PubMed] [Google Scholar]
- Schor CM. The Glenn A. Fry award lecture: Adaptive regulation of accommodative vergence and vergence accommodation. American Journal of Optometry and Physiological Optics. 1986;63(8):587–609. [PubMed] [Google Scholar]
- Schor CM, Kotulak JC. Dynamic interactions between accommodation and convergence are velocity sensitive. Vision Research. 1986;26(6):927–942. doi: 10.1016/0042-6989(86)90151-3. [DOI] [PubMed] [Google Scholar]
- Semmlow J, Wetzel P. Dynamic contributions of the components of binocular vergence. Journal of the Optical Society of America. 1979;69:639–645. doi: 10.1364/josa.69.000639. [DOI] [PubMed] [Google Scholar]
- Sheard C. Zones of ocular comfort. American Journal of Optometry. 1930;7:9–25. [Google Scholar]
- Sheedy JE, Hayes J, Engle J. Is all astenopia the same? Optometry & Visual Science. 2003;80(11):732–739. doi: 10.1097/00006324-200311000-00008. [DOI] [PubMed] [Google Scholar]
- Shibata T, Kim J, Hoffman DM, Banks MS. The zone of comfort: Predicting visual discomfort with stereo displays. Journal of Vision. 2011;11(8):11, 1–29. doi: 10.1167/11.8.11. [DOI] [PMC free article] [PubMed] [Google Scholar]
- Speranza F, Tam WJ, Renaud R, Hur N. Effect of disparity and motion on visual comfort of stereoscopic images. SPIE: Stereoscopic Displays and Virtual Reality Systems. 2006;6055:60550B. [Google Scholar]
- Tam WJ, Speranza F, Yano S, Shimono K, Ono H. Stereoscopic 3D-TV: Visual comfort. IEEE Transactions on Broadcasting. 2011;57(2):335–346. [Google Scholar]
- Yang SN, Sheedy JE. Effects of vergence and accommodative responses on viewer’s comfort in viewing 3D stimuli. SPIE. 2011;7863:1–13. [Google Scholar]


