

Abstract
Mammalian target of rapamycin (mTOR) integrates multiple signals, including nutrient status, growth factor availability, and stress, to regulate cellular and organismal growth. How mTOR regulates transcriptional programs in response to these diverse stimuli is poorly understood. MondoA and its obligate transcription partner Mlx are basic helix-loop-helix leucine zipper (bHLHZip) transcription factors that sense and execute a glucose-responsive transcriptional program. MondoA-Mlx complexes activate expression of thioredoxin-interacting protein (TXNIP), which is a potent inhibitor of cellular glucose uptake and aerobic glycolysis. Both mTOR and MondoA are central regulators of glucose metabolism, yet whether they interact physically or functionally is unknown. We show that inhibition of mTOR induces MondoA-dependent expression of TXNIP, coinciding with reduced glucose uptake. Mechanistically, mTOR binds to MondoA in the cytoplasm and prevents MondoA-Mlx complex formation, restricting MondoA's nuclear entry and reducing TXNIP expression. Further, we show that mTOR inhibitors and reactive oxygen species (ROS) regulate interaction between MondoA and mTOR in an opposing manner. Like mTOR's suppression of the MondoA-TXNIP axis, MondoA can also suppress mTOR complex 1 (mTORC1) activity via its direct transcriptional regulation of TXNIP. Collectively, these studies reveal a regulatory relationship between mTOR and the MondoA-TXNIP axis that we propose contributes to glucose homeostasis.
INTRODUCTION
Mammalian target of rapamycin (mTOR) plays a central role in cell growth and proliferation, and its dysregulation contributes to many diseases, including cancer and diabetes. mTOR is a Ser/Thr kinase that exists in two functionally distinct multiprotein complexes, rapamycin-sensitive mTOR complex 1 (mTORC1) and rapamycin-insensitive mTOR complex 2 (mTORC2). mTORC1 promotes protein synthesis by directly phosphorylating ribosomal S6 kinase (S6K) and eukaryotic translation initiation factor 4E (4E-BP1), whereas mTORC2 promotes cell survival and metabolism by phosphorylating Akt (1). Inhibition of mTOR affects global transcription, with genes driving anabolic or catabolic processes being generally repressed or activated, respectively (2–6). Because mTOR integrates progrowth and growth-suppressive signals, it is likely that mTOR regulates diverse transcription factors and chromatin modifiers to induce or repress gene expression; however, our knowledge of the transcription factors regulated by mTOR is limited (7, 8).
We focus on a family of transcription factors that respond to environmental and intracellular cues. MondoA and its dimerization partner Mlx are members of the basic helix-loop-helix leucine zipper (bHLHZip) family of transcription factors (9). MondoA-Mlx complexes shuttle between the cytosol and the nucleus; however, in response to high levels of glucose, they accumulate in the nucleus, bind the promoters of target genes, and regulate their expression. MondoA-Mlx complexes are important, perhaps the principal, regulators of glucose-induced gene expression (10, 11). MondoA must dimerize with Mlx to accumulate in the nucleus and bind promoters of regulated targets (12, 13), indicating that MondoA and Mlx are obligate dimers at target genes.
One glucose-dependent and direct target of MondoA-Mlx complexes is thioredoxin-interacting protein (TXNIP), which is a potent negative regulator of glucose uptake and aerobic glycolysis. We have proposed that the MondoA-TXNIP axis functions as a metabolic checkpoint, restoring glucose homeostasis when glycolytic flux is elevated. Consistent with this, glucose uptake, aerobic glycolysis, and growth rates are high in MondoA- and TXNIP-knockout (KO) cells (9–11). Glutamine blocks the glucose and MondoA-Mlx-dependent activation of TXNIP, indicating that MondoA-Mlx complexes can coordinate glycolysis and glutaminolysis (14). A multitude of cellular stress signals also induce TXNIP, suggesting that MondoA-Mlx complexes link the intracellular stress response with metabolic state (9, 15, 16).
Given the predominant functions of MondoA and mTOR in the adaptive cellular response to nutrient status, we investigated whether MondoA is an mTOR-regulated transcriptional effector. We show that mTOR regulates the expression of TXNIP in response to nutrient status and oxidative stress by controlling the formation of transcriptionally competent MondoA-Mlx complexes. We also demonstrate that MondoA negatively regulates mTOR activity in response to metabolic stress.
MATERIALS AND METHODS
Materials.
Reagents used included the following (sources in parentheses): 2-deoxy-d-[3H] glucose (New England Nuclear); 2-deoxyglucose, 3-[(3-cholamidopropyl)-dimethylammonio]-1-propanesulfonate (CHAPS), digitonin, polyethylenimine, H2O2, N-acetyl-l-cysteine (NAC), phenyl arsine oxide (PAO), 2′7′-dichlorodihydrofluorescein diacetate, anti-c-myc–agarose affinity gel, anti-V5–agarose affinity gel, anti-V5, anti-Flag, antitubulin, and anti-mTOR (Sigma); rapamycin, anti-mTOR, anti-S6, anti-p-S6, anti-P70S6K, anti-p-P70S6k, antiraptor, anti-TSC2, and anti-myc tag (Cell Signaling Technology); anti-TXNIP (MBL International); anti-MondoA (Proteintech); anti-ChREBP (Novus); rabbit IgG (Santa Cruz); secondary antibodies anti-mouse antibody–horseradish peroxidase (HRP) and anti-rabbit antibody–HRP (Amersham Biosciences); protein A/G-Sepharose (Pierce); Western Lightning chemiluminescence plus (Perkin-Elmer); torin1 (Cayman Chemicals); Lipofectamine 2000 and rabbit IgG (Invitrogen); luciferase reporter assay system (Promega). The rabbit polyclonal anti-MondoA was described previously (10, 17).
Cell culture.
Cells were maintained at 37°C in 5% CO2 in medium containing penicillin-streptomycin and 10% standard fetal bovine serum (FBS; HyClone) unless otherwise indicated. Mouse embryonic fibroblasts (MEFs) and HEK293T and HA1ER cells were grown in Dulbecco's modified Eagle's medium (DMEM). BxPC-3 and AsPC-1 cells were grown in RPMI medium. Nutrient depletion studies were performed as described previously (14).
Plasmids and viruses.
Plasmids expressing MondoA, MondoA-V5, Mlx-Flag, TXNIP-luciferase, and MondoA small hairpin RNA (shRNA) have been described (10, 11). Plasmid pCMV-SPORT6 expressing human ChREBP (MondoB) cDNA was obtained from Open Biosystems. Human TXNIP cDNA was cloned into pWZL-BLAST vector (Addgene) for retroviral expression in mouse embryonic fibroblasts. Plasmids expressing myc-mTOR and Raptor shRNA were from Addgene and have been described (18). Plasmids myc-tubulin, RhebQ64L, and TSC2 shRNA were provided by David Sabatini and Brendan Manning. Lentiviral and retroviral production was conducted as described previously (14).
Transient transfections.
HA1ER cells were seeded on coverslips (0.1 × 10⁶ cells/coverslip) and transfected using Lipofectamine 2000. HEK293T cells were seeded in 6-cm dishes (1.5 × 10⁶ cells/dish) and transfected using polyethylenimine (PEI) transfection reagent (19). Luciferase reporter assays, immunofluorescence, and microscopy were performed as previously described (10, 14). Generally, MondoA expression plasmid was used at 50 ng to 100 ng, mTOR expression plasmid was used at 1 μg, and Mlx expression plasmid was used at 0.1 μg to 2 μg.
Immunoprecipitations.
Whole-cell lysates were prepared in ice-cold buffer (40 mM HEPES [pH 7.5], 120 mM NaCl, 1 mM EDTA, 5 mM pyrophosphate, 10 mM glycerophosphate, 5 mM NaF, 1.5 mM Na3VO4, and protease inhibitors) containing 0.3% CHAPS or 25 μg/ml digitonin. After the lysate was cleared, supernatant (0.5 mg) was mixed with 7.5 μg of primary antibody and incubated overnight at 4°C. The next day, 30 μl of protein A/G-Sepharose (50% slurry) was added and incubated for 1 h at 4°C. Immunoprecipitates were washed 3 times in the lysis buffer. For overexpressed proteins, 1 mg of lysate and 15 μl of anti-V5 or anti-c-myc resin were used in each immunoprecipitation.
Glucose uptake assays.
MEFs were seeded in 6-well dishes and grown overnight to ∼70% confluence. After a phosphate-buffered saline (PBS) wash, fresh medium containing dimethyl sulfoxide (DMSO), rapamycin (25 nM), or torin1 (250 nM) was added to the dishes and incubated for 16 h. 2-Deoxy-d-[3H] glucose uptake assays were performed as described previously (16). The averages and standard deviations (SD) from at least two experiments performed in triplicate are shown (see Fig. 1).
FIG 1.

mTOR inhibitors block glucose metabolism. (A and B) Glucose uptake was determined in WT and MondoA-KO MEF cells cultured overnight in the presence of DMSO or 25 nM rapamycin or 250 nM torin1. (C) Glucose uptake was determined in WT and TXNIP-KO MEF cells cultured overnight in the presence of DMSO or 250 nM torin1. (D) WT and MondoA-KO MEF cells were cultured in the presence of DMSO or 25 nM rapamycin, and relative cells numbers were determined over a 3-day time period. (E) WT and TXNIP-KO MEF cells were cultured in the presence of DMSO or 250 nM torin1, and relative cells numbers were determined over a 5-day time period.
Cell proliferation assays.
Equal numbers of MEF cells were seeded in 12-well plates and allowed to grow for 24 h. Cells were washed, and fresh medium containing DMSO or 25 nM rapamycin or 250 nM torin1 was added, and cell proliferation was assessed by crystal violet stain as described previously (14). The data shown (see Fig. 1D and E) are the averages ± SD from triplicate samples.
Reactive oxygen species (ROS) measurement.
HEK293T cells were seeded in 6-cm dishes (1 × 10⁶ cells/dish) and grown overnight. After a PBS wash, cells were treated with 10 μM 2′7′-dichlorodihydrofluorescein diacetate (DCFDA) for 30 min followed by NAC (10 mM for 20 min) and/or PAO (5 μM for 10 min). Cells were trypsinized, collected, and analyzed by flow cytometry. The averages and SD from one representative experiment performed in triplicate are shown (see Fig. 6B).
FIG 6.

ROS stimulate MondoA-mTOR complex formation. (A) Levels of the indicated proteins in anti-myc immunoprecipitates and lysates prepared from HEK293T cells transfected with the indicated plasmids and treated with 5 μM PAO for 15 min were determined by Western blotting. (B) Levels of ROS in 293T cells treated with 10 mM NAC for 20 min followed by 5 μM PAO for 10 min. (C and D) Levels of the indicated proteins in anti-myc immunoprecipitates and lysates prepared from HEK293T cells transfected with the indicated plasmids and treated as described for panel B were determined by Western blotting. In panel D, H2O2 was used at 1 mM for 30 min (*, nonspecific band). (E) HEK293T cells were treated as described for panel B, except that PAO was used at 1 μM for 2.5 h. qRT-PCR was used to determine the relative expression of TXNIP, normalized to β-actin.
Size exclusion chromatography.
HEK293T cell lysates were prepared in ice-cold buffer (40 mM HEPES [pH 7.5], 120 mM NaCl, 1 mM EDTA, 0.3% CHAPS) and cleared by high-speed centrifugation. Supernatant was filtered (0.45-μm pore size) and loaded onto a Superose 6 10/300 GL column (Amersham Pharmacia Biotech). Protein was eluted at 0.5 ml/min, and 0.5-ml fractions were collected over two column volumes. A total of 40 μl of each fraction analyzed was separated by SDS-PAGE and analyzed by Western blotting.
Expression and ChIP analysis.
Cells were cultured overnight (16 to 18 h) in the presence of DMSO, torin1 (250 nM), or rapamycin (25 nM). For mRNA analysis, total RNA was extracted using an RNeasy minikit (Qiagen), and cDNA was generated from 1 μg RNA using the GoScript reverse transcription system (Promega). Chromatin immunoprecipitation (ChIP) experiments were performed as described previously using MondoA antibody (3 μg/IP; Proteintech) (11). Quantitative PCR (qPCR) analysis was performed as described previously (14). Measurements represent the averages from a minimum of two biological replicates.
Statistical analysis.
Data are expressed as averages ± SD. One-way analysis of variance (ANOVA) or paired t test was used to determine statistical significance. A P value of <0.05 was considered statistically significant.
RESULTS
mTORC1 represses TXNIP expression.
To investigate whether mTOR influences the MondoA-TXNIP axis, we first determined whether mTOR inhibitors regulated glucose uptake in wild-type (WT) and MondoA-knockout (KO) mouse embryonic fibroblasts (MEFs). Treatment of WT MEFs with the mTOR inhibitors rapamycin or torin1 suppressed glucose uptake, but MondoA-KO MEFs were insensitive to both inhibitors (Fig. 1A and B). Glucose uptake in TXNIP-KO MEFs was also insensitive to torin1, indicating that TXNIP is necessary for suppression of glucose uptake following mTOR inhibition (Fig. 1C). Consistent with our previous results (11), MondoA or TXNIP loss increased glucose uptake. Because MondoA- or TXNIP-KO MEFs have elevated glucose uptake following mTOR inhibition, they may have a growth advantage over WT cells. To test this hypothesis, we performed cell proliferation assays in the presence of mTOR inhibitors rapamycin or torin1 and found that MondoA or TXNIP loss did not block the antiproliferative effects of mTOR inhibition (Fig. 1D and E). Therefore, increased glucose uptake resulting from loss of the MondoA-TXNIP axis cannot overcome the pleiotropic growth-suppressive effects, e.g., suppression of c-myc and/or HIF-1α (20), driven by mTOR inhibition.
Given that both MondoA and TXNIP are required for rapamycin or torin1 to restrict glucose uptake and that TXNIP is a potent negative regulator of glucose uptake, we next determined whether they induced TXNIP expression. Both compounds increased TXNIP mRNA expression in wild-type MEFs, and rapamycin increased TXNIP protein levels in these cells (Fig. 2A and B). Consistent with previous reports demonstrating that TXNIP expression is highly dependent on MondoA (10, 11), induction of TXNIP by rapamycin or torin1 was dramatically reduced in MondoA-KO MEFs (Fig. 2A and B and data not shown). Torin1 also induced TXNIP in the transformed human embryonic kidney cell line HA1ER. Importantly, TXNIP induction in this human epithelial cell line was reduced by stable knockdown of MondoA, demonstrating a MondoA dependence in an isogenic setting and indicating that the effect of mTOR inhibitors on TXNIP is not restricted to murine fibroblasts (Fig. 2C and D). Supporting the latter point, mTOR inhibitors also increased TXNIP expression in two pancreatic cancer cell lines, BxPC-3 and AsPC1 (Fig. 2E to G). Additionally, rapamycin increased the activity of a TXNIP luciferase reporter construct in HA1ER cells (Fig. 2H). Together, these findings demonstrate that mTOR inhibitors increase TXNIP expression in a MondoA-dependent manner and further suggest that mTOR can reduce TXNIP expression, possibly by repressing or restricting MondoA transcriptional activity.
FIG 2.

mTOR inhibitors regulate MondoA-dependent TXNIP expression. (A) WT and MondoA-KO MEF cells were cultured overnight in the presence of DMSO or 25 nM rapamycin or 250 nM torin1, and reverse transcription-quantitative PCR (qRT-PCR) was used to determine the relative expression of TXNIP, normalized to β-actin. (B) WT and MondoA-KO MEF cells were cultured overnight in the presence of DMSO or rapamycin, and expression of the indicated proteins was determined by Western blotting. (C and D) HA1ER (scrambled and MondoA knockdown) cells were cultured overnight in the presence of DMSO or 250 nM torin1, and expression of TXNIP and MondoA was determined as described for panel A. (E) BxPC-3 cells were cultured overnight in the presence of DMSO or 25 nM rapamycin, and expression of TXNIP was determined as described for panel A. (F) BxPC-3 cells were cultured overnight in the presence of DMSO or 25 nM rapamycin, and expression of the indicated proteins was determined by Western blotting. (G) AsPC1 cells were cultured overnight in the presence of DMSO or 25 nM rapamycin, and expression of TXNIP was determined as described for panel A. (H) Activity of a TXNIP-luciferase reporter plasmid in HA1ER cells treated overnight with 25 nM rapamycin.
Because rapamycin primarily affects mTORC1, we focused our studies on this mTOR-containing complex. To confirm that mTORC1 repressed TXNIP expression, we modulated its activity using multiple approaches (Fig. 3A). First, knockdown of the mTORC1-required subunit raptor in BxPC-3 cells reduced mTORC1 activity, as evidenced by reduced levels of phosphorylated S6, and increased TXNIP expression (Fig. 3B). Second, activating mTORC1 complexes with Rheb(Q64L), which binds GTP constitutively, repressed the activity of a TXNIP luciferase reporter construct (Fig. 3C). We tested the involvement of TSC2, which is a suppressor of the mTORC1 complex, in two ways. First, knockdown of TSC2 in BxPC-3 cells elevated mTORC1 activity and suppressed TXNIP expression (Fig. 3D). Because TSC2 knockdown was not complete, the effect of its knockdown on TXNIP expression was subtle (Fig. 3D). Therefore, we next examined TXNIP expression in TSC2-KO MEFs. Consistent with the TSC2 knockdown experiment, complementing TSC2-KO MEFs, which have high basal mTORC1 activity, with human TSC2 suppressed mTORC1 activity and elevated TXNIP mRNA and protein (Fig. 3E and F). Further, inhibition of constitutive mTOR activity in TSC2-KO MEFs with rapamycin increased TXNIP mRNA. In contrast, rapamycin treatment of TSC2-complemented MEFs, which already have reduced mTORC1 activity, did not increase TXNIP expression further (Fig. 3E). We conclude that activation of the mTORC1 complex suppresses TXNIP gene expression.
FIG 3.

mTORC1 regulates TXNIP. (A) Schematic of mTORC1 signaling pathway. (B) BxPC-3 (scrambled and raptor knockdown) cells were cultured overnight under the indicated growth conditions, and the expression of the indicated proteins was determined by Western blotting. (C) Activity of a TXNIP-luciferase reporter plasmid in HEK293T cells cotransfected with expression plasmids as indicated. (D) BxPC-3 (scrambled and TSC2 knockdown) cells were cultured overnight under the indicated growth conditions, and expression of the indicated proteins was determined by Western blotting. (E) TSC2-KO and TSC2-KO MEF cells expressing human TSC2 were cultured overnight in the presence of 25 nM rapamycin (Rap), and qRT-PCR was used to determine the relative expression of TXNIP, normalized to β-actin. (F) TSC2-KO and TSC2-KO MEF cells expressing human TSC2 were cultured overnight, and expression of the indicated proteins was determined by Western blotting. G, glucose; Q, glutamine.
Previously, we showed that glutamine negatively regulates glucose-stimulated expression of TXNIP (14). Since mTORC1 activity is also stimulated by glutamine, we tested different medium conditions in our experiments. Consistent with previous studies (21), mTORC1 activity monitored by phosphorylated S6 was impaired in media lacking glucose and glutamine, but activity was rescued in media containing glutamine alone or glucose plus glutamine. As expected, TXNIP was not expressed in the absence of glucose, and glutamine repressed glucose-stimulated TXNIP expression. Although glutamine stimulated mTORC1 activity, expression of TXNIP was upregulated in raptor knockdown cells independent of glutamine status. Similarly, TXNIP expression was downregulated in TSC2 knockdown cells that were grown in the presence or absence of glutamine (Fig. 3B and D). We conclude that mTORC1 suppresses TXNIP expression independently of the previously described glutamine-dependent repression mechanism (14).
MondoA interacts with mTOR.
Because MondoA is strictly required for TXNIP transcription and mTORC1 suppresses TXNIP expression, we next determined whether MondoA transcriptional activity was repressed directly or indirectly by mTORC1. We used several different approaches to determine whether MondoA interacted with members of the mTORC1 complex. First, gel filtration chromatography of HEK293T lysate containing MondoA-V5 and myc-mTOR showed that they coelute in high-molecular-mass fractions. Consistent with previous studies (22, 23), mTOR eluted in two peaks: the first around fractions 22 to 25 (∼1 to 0.8 MDa) and the second around fractions 28 to 29 (∼0.5 to 0.4 MDa). MondoA eluted as one peak between fractions 25 to 27 (∼0.8 to 0.6 MDa) (Fig. 4A). MondoA eluted between the two major peaks of mTOR, suggesting only a portion mTOR associates with MondoA. Raptor eluted in two peaks: the first peak overlapped with the primary mTOR peak and the second peak around fractions 30 and 31, which lack mTOR and MondoA (Fig. 4A). Second, we determined the subcellular localization of MondoA-V5 and myc-mTOR proteins in HA1ER cells. Consistent with previous studies (10, 24), MondoA-V5 and myc-mTOR proteins were predominantly cytoplasmic, and a high degree of colocalization was observed in the cytoplasm as well as at the plasma membrane (Fig. 4B). Similar results were obtained in HeLa cells (data not shown). Third, reciprocal immunoprecipitations from HEK293T cells expressing MondoA-V5 and myc-mTOR proteins showed that these proteins interact in vivo. As controls for this experiment, MondoA-V5 was not immunoprecipitated in the absence of myc-mTOR, and myc-mTOR was not immunoprecipitated in the absence of MondoA-V5. Further, an unrelated myc-tagged protein (myc-tubulin) did not interact with MondoA-V5 (Fig. 4C and D). Thus, interaction between MondoA-V5 and myc-mTOR was specific. Fourth, HEK293T lysate containing myc-mTOR was fractionated by gel filtration chromatography, and immunoprecipitation of myc-mTOR from pooled fractions 21 to 24 and 25 to 28 revealed that exogenously expressed mTOR interacted with endogenous MondoA (data not shown). Fifth, we determined whether endogenous MondoA and mTOR interact. Typically, mTORC1 complexes are isolated in buffer containing the detergent CHAPS, and MondoA has not been observed in these complexes (25). Consistent with this, we observed no interaction between MondoA and mTOR in a CHAPS-based buffer. In contrast, an association between MondoA and mTOR was observed in a digitonin-containing buffer, demonstrating that these two proteins interact in vivo when expressed at endogenous levels and their association is detergent sensitive (Fig. 4E). We also observed an interaction between MondoA and mTOR in wild-type MEFs, providing additional evidence for the existence of MondoA-mTOR complexes and demonstrating that their interaction is not restricted to HEK293T cells. Further, mTOR interacted with raptor in both wild-type and MondoA-KO MEFs, demonstrating that MondoA is not required for the assembly of the mTORC1 complex (Fig. 4F). Finally, we demonstrate that the MondoA paralog ChREBP (MondoB) also interacts with mTOR (Fig. 4G), suggesting that ChREBP may also be regulated by mTOR. Collectively, these data demonstrate that MondoA interacts with mTOR and suggest that mTORC1 suppresses MondoA transcriptional activity at the TXNIP promoter by a direct mechanism.
FIG 4.

MondoA and mTOR interact. (A) Lysate from HEK293T cells expressing myc-mTOR and MondoA-V5 was fractionated using a Superose 6 10/300 GL column as described in Materials and Methods. A total of 40 μl from the indicated fractions was subjected to SDS-PAGE, and expression of myc-mTOR, MondoA-V5, and raptor was determined by Western blotting. (B) Representative images showing MondoA-V5 (red) and myc-mTOR (green) subcellular localization in HA1ER cells. (C and D) Levels of indicated proteins in anti-myc or anti-V5 immunoprecipitates and lysate prepared from HEK293T cells transfected with the indicated plasmids were determined by Western blotting. (E) Levels of the indicated proteins in anti-IgG or anti-mTOR immunoprecipitates and lysate prepared from HEK293T cells with the indicated detergents was determined by Western blotting. Digi; digitonin. (F) Levels of the indicated proteins in mTOR immunoprecipitates and lysate prepared from wild-type and MondoA-KO MEF cells were determined by Western blotting (*, nonspecific band). (G) Levels of the indicated proteins in anti-myc immunoprecipitates and lysate prepared from HEK293T cells transfected with indicated plasmids were determined by Western blotting.
Modulation of MondoA and mTOR interaction.
Mlx was not detected in mTOR immunoprecipitates (data not shown), suggesting that mTOR might suppress MondoA transcriptional activity by sequestering MondoA from its obligate partner Mlx. To investigate this sequestration model, we determined whether coexpression of Flag-Mlx affected the interaction between MondoA-V5 and myc-mTOR. Increasing levels of Flag-Mlx decreased the interaction between MondoA-V5 and myc-mTOR, demonstrating that Mlx competes with mTOR for binding to MondoA (Fig. 5A). To test this further, we used a mutant of MondoA, MondoA-V5(I766P), that has a mutation in the leucine zipper dimerization interface and does not interact with Mlx (10, 11). MondoA-V5(I766P) interacted more strongly with myc-mTOR than did MondoA-V5, and increasing Flag-Mlx did not reduce the interaction between MondoA-V5(I766P) and mTOR (Fig. 5A). These findings support the hypothesis that MondoA-Mlx and MondoA-mTOR complexes are mutually exclusive. Further, because MondoA-V5(I766P) is constitutively cytoplasmic (10, 11), these data also suggest that MondoA-mTOR complexes form in the cytoplasm.
FIG 5.

mTOR regulates MondoA-Mlx complex formation. (A) Levels of indicated proteins in anti-myc immunoprecipitates and lysate prepared from HEK293T cells transfected with the indicated plasmids were determined by Western blotting. (B and C) Levels of the indicated proteins in anti-myc immunoprecipitates and lysate prepared from HEK293T cells transfected with the indicated plasmids and treated with 25 nM rapamycin or 250 nM torin1 (B) or 20 mM 2DG (C) for 6 h were determined by Western blotting. (D) ChIP was used to determine MondoA occupancy at the TXNIP promoter in wild-type MEFs cultured overnight in the presence of 250 nM torin1.
To determine how mTOR suppresses MondoA transcriptional activity, we next examined whether mTORC1 inhibitors affect interaction between MondoA and mTOR. HEK293T cells expressing MondoA-V5 or MondoA-V5(I766P), each along with myc-mTOR, were treated with rapamycin, torin1, or 2-deoxyglucose (2DG), and mTOR complexes were analyzed by immunoprecipitation. As expected, each inhibitor attenuated mTORC1 activity, as evidenced by reduced levels of phosphorylated S6 ribosomal protein (Fig. 5B and C). All three inhibitors decreased the amount of MondoA-V5 associated with myc-mTOR. All three inhibitors also induced TXNIP expression, suggesting that once released from mTOR, MondoA-V5 bound to endogenous Mlx, translocated to the nucleus, and activated TXNIP expression (Fig. 5B and C). Consistent with this model, MondoA occupancy of the TXNIP promoter increased 2-fold in the presence of torin1 and rapamycin (Fig. 5D and data not shown); several of our previous publications demonstrate that 2DG increases the amount of MondoA on the TXNIP promoter (10, 11). Inhibition of mTOR also decreased its interaction with MondoA-V5(I766P), demonstrating that dissolution of the MondoA-mTOR complex does not require Mlx. We suspect that endogenous MondoA was responsible for increased TXNIP expression in MondoA-V5(I766P)-expressing cells.
mTORC1 comprises mTOR, raptor, and GβL. MondoA and mTOR are both large proteins, making it difficult to produce them in recombinant form, and thus making it impossible to determine whether their interaction is direct. Rapamycin and torin1 both disrupted MondoA and mTOR interaction, yet binding of raptor to mTOR was blocked by rapamycin but not by torin1, findings that are consistent with previous studies (25, 26). Thus, we conclude that the interaction between MondoA and mTOR is not mediated by a secondary interaction with raptor and speculate that they may interact directly (Fig. 5B and C). Together, these data suggest that mTORC1 inhibitors stimulate MondoA transcriptional activity by reducing the interaction between MondoA and mTOR, freeing MondoA to associate with Mlx. Formation of MondoA-Mlx heterodimers is required for nuclear accumulation, promoter binding, and transcriptional activation (11).
ROS regulate MondoA and mTOR interaction.
Because redox-sensitive mechanisms also regulate mTORC1 activity (27–29), we determined if cellular redox status affects the interaction between MondoA and mTOR. Treatment of HEK293T cells expressing MondoA-V5 and myc-mTOR with phenyl arsine oxide (PAO) increased interaction between MondoA-V5 and myc-mTOR. Consistent with previous studies (30, 31), PAO reduced the interaction between mTOR and raptor and stimulated mTORC1 activity, as evidenced by increased phosphorylation of P70S6K (Fig. 6A). Similar results were obtained with kinase-dead myc-mTOR, demonstrating that mTORC1 activity is not required for the formation of MondoA-mTOR complexes and their regulation by PAO. Endogenous mTOR must be responsible for the increased phosphorylation of P70S6K observed in kinase-dead myc-mTOR-expressing cells (Fig. 6A). PAO has at least two functions: it can cross-link vicinal thiol groups of cysteines and it can increase ROS (30, 32, 33). The reducing agent British anti-Lewisite did not reverse the stimulatory effects of PAO (data not shown), suggesting that it did not increase MondoA-mTOR interaction by cysteine cross-linking. In contrast, N-acetyl-l-cysteine (NAC) reduced the levels of PAO-driven ROS and also blocked the PAO-dependent increase in MondoA-mTOR complexes (Fig. 6B and C). Together, these studies suggest that increased intracellular ROS drive interaction between MondoA and mTOR. Substantiating this conclusion, H2O2 also increased levels of MondoA-mTOR complexes, and this increase was reversed by NAC (Fig. 6D).
Mlx overexpression blocked PAO-driven MondoA-mTOR complex formation, suggesting that ROS stimulated the formation of MondoA-mTOR complexes at the expense of transcriptionally active MondoA-Mlx complexes (Fig. 6A). Consistent with this model, both PAO and H2O2 reduced TXNIP mRNA levels, and in each case the reduction in TXNIP message was reversed by NAC (Fig. 6E and data not shown). Together, these studies suggest that increased intracellular ROS drives MondoA-mTOR complex formation at the expense of MondoA-Mlx complexes, resulting in lower TXNIP mRNA expression.
MondoA-TXNIP axis represses mTORC1 activity.
Previous studies show that in addition to stimulating MondoA transcriptional activity, 2DG can suppress mTORC1 activity (25). Therefore, we determined whether the effect of 2DG on mTORC1 requires the MondoA-TXNIP axis. As expected, treatment of WT MEFs with 2DG increased TXNIP expression and reduced mTORC1 activity, as evidenced by the reduced levels of phosphorylated P70S6K. In contrast, mTORC1 activity remained high in 2DG-treated MondoA-KO MEFs, which lack TXNIP. Complementing MondoA-KO MEFs with human MondoA restored expression of TXNIP and restored the suppression of mTORC1 activity in response to 2DG (Fig. 7A). These data show that MondoA is required for the suppression of mTORC1 activity that accompanies metabolic stress driven by 2DG.
FIG 7.
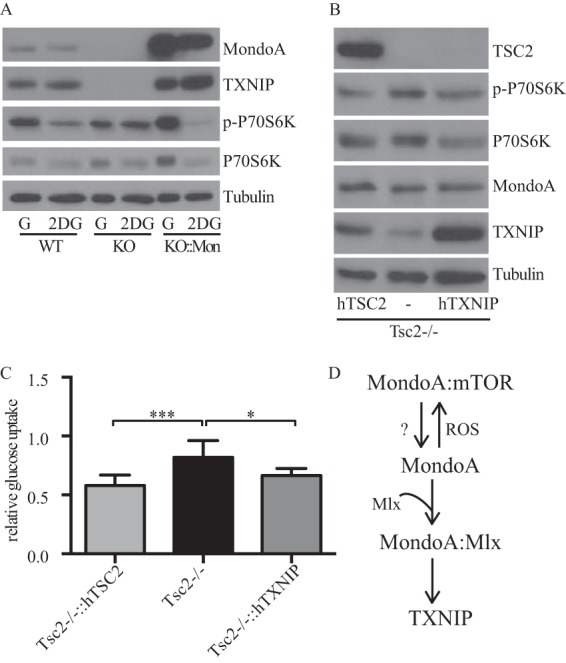
TXNIP regulates mTORC1 activity. (A) WT, MondoA-KO, and MondoA-KO MEF cells expressing human MondoA were cultured overnight in the presence of 25 mM glucose (G) or 1 mM 2-deoxyglucose (2DG), and expression of the indicated proteins was determined by Western blotting. (B) TSC2-KO and TSC2-KO MEF cells expressing human TSC2 or TXNIP were cultured overnight, and expression of the indicated proteins was determined by Western blotting. (C) Glucose uptake was determined in MEF cells described for panel B. (D) Model of mTOR-dependent regulation of MondoA. See the text for details.
Introduction of TXNIP into TSC2-KO MEFs reduced mTORC1 activity and also reduced glucose uptake (Fig. 7B and C), suggesting that the suppressive effect of MondoA on mTORC1 activity is mediated by its regulation of TXNIP. TXNIP may suppress mTORC1 activity by stabilizing Redd1, which drives the formation of TSC1/2 complexes (34) or by blocking glucose uptake. However, high TXNIP expression reduced mTORC1 activity and glucose uptake in TSC2-KO MEFs to a level comparable to that observed in TSC2-KO MEFs complemented with human TSC2 cDNA (Fig. 7B and C). Together, these data demonstrate that TXNIP suppresses mTORC1 activity independent of TSC2.
DISCUSSION
Nutrient sensing is fundamental to maintenance of cellular homeostasis. MondoA and mTORC1 are key sensors of two abundant nutrients, glucose and glutamine (9, 35, 36). Here, we established a link between MondoA and mTORC1 and demonstrate that mTORC1 negatively regulates the transcriptional activity of MondoA by sequestering it away from its obligate partner, Mlx. Further, we show that the MondoA-TXNIP axis can repress mTORC1 activity, particularly under conditions of metabolic stress. Raptor, which is an essential component of mTORC1, knockdown increased TXNIP expression, demonstrating that mTORC1 regulates the MondoA-TXNIP axis (Fig. 3B). Our experiments do not rule out the possibility that mTORC2 also regulates the MondoA-TXNIP axis. Given the central role that TXNIP plays in glucose homeostasis, our findings suggest that the regulated conversion between MondoA-mTORC1 and MondoA-Mlx complexes contributes to metabolic homeostasis.
ROS drives the interaction between MondoA and mTOR, restricting MondoA-Mlx complexes and reducing TXNIP expression (Fig. 7D). TXNIP elevates intracellular ROS by inhibiting the antioxidant function of thioredoxin, and this has been linked to oxidative stress, inflammasome activation, and apoptosis (37–41). We propose that the ROS-dependent formation of MondoA-mTOR complexes and the resultant decrease in TXNIP expression constitutes a protective mechanism that shields cells from deleterious levels of ROS. Both WT and kinase-dead mTOR interacted comparably with MondoA, and interactions between both forms of mTOR and MondoA were increased by PAO treatment (Fig. 6A). Therefore, mTOR kinase activity seems to have no role in the ROS-dependent formation of MondoA-mTOR complexes. Furthermore, a recent phosphoproteomic study identified serine 33 in MondoA as the mTOR phosphorylation site (42); however, mutation of this site did not affect MondoA's transcriptional activity at the TXNIP promoter or its association with mTOR (data not shown). Thus, whether mTOR kinase activity impacts MondoA function more directly or at different transcriptional targets remains to be clarified.
In contrast to ROS, inhibition of mTOR activity disrupts MondoA-mTOR complexes, resulting in increased TXNIP expression (Fig. 5B and C). Conceptually, elevated TXNIP may enforce or be a feature of an antiproliferative program driven by mTOR inhibition. Strikingly, MondoA, TXNIP, and Mlx (data not shown) are required for the decrease in glucose uptake following rapamycin or torin1 treatment (Fig. 1A to C). This finding demonstrates that the MondoA-TXNIP axis is required for metabolic reprogramming driven by mTOR inhibitors. Our data suggest that mTOR activity is not required for assembly of the MondoA-mTOR complex; however, it is possible that its activity is required for complex integrity. Alternatively, TXNIP is induced by many signals (9, 15, 43–45); thus, it is possible that mTOR inhibition drives disassembly of MondoA-mTOR complexes and TXNIP expression by an indirect mechanism (Fig. 7D).
Previous mTOR complex isolations have been carried out in CHAPS-based buffers (25); thus, it is not surprising that MondoA had not been previously identified as an mTOR interactor. Interestingly, a recent study showed that hexokinase II interacts with mTOR in a digitonin-based buffer but not in a CHAPS-based buffer (46); thus, MondoA is not unique in having a detergent-sensitive interaction with mTOR. Our coimmunoprecipitation studies suggest that mTOR interacts and regulates only a small fraction (∼5%) of MondoA. This finding is consistent with our findings and those of others demonstrating that only a small fraction of MondoA translocates to the nucleus to execute a glucose-responsive transcriptional program (10, 11, 47, 48). It is possible that mTOR interacts with and regulates only this small pool of MondoA, perhaps functioning as a permissivity factor for MondoA transcriptional activity. However, it is also possible that because MondoA-mTOR complexes are detergent sensitive, our experiments underrepresent the actual amount of MondoA-mTOR complexes in cells. Supporting a more stoichiometric relationship between MondoA and mTOR, our immunofluorescence analysis shows that the majority of MondoA-V5 staining overlaps with the majority of myc-mTOR staining (Fig. 4B). Regardless of the precise amount of MondoA that interacts with mTOR in vivo, we provide multiple experiments to support the conclusion that MondoA and mTOR interact in vivo and the functional significance of the interplay between MondoA-mTOR and MondoA-Mlx complexes (Fig. 4 to 6). We have performed extensive mutational analysis on MondoA, identifying two independent binding sites for mTOR, but have yet to identify a mutant that can distinguish the functions of the two MondoA-containing complexes.
Metabolic stress induced by 1 mM 2DG induced TXNIP expression and suppressed mTORC1 activity in wild-type MEFs but not in MondoA-KO MEFs (Fig. 7A), suggesting that the MondoA-TXNIP axis is required for the full metabolic stress response triggered by mTORC1 suppression. TXNIP has previously been shown to reduce mTORC1 activity via stabilization of Redd1, which drives TSC1/2 complex formation (34). However, our studies in TSC2-KO MEFs suggest that TXNIP can reduce mTORC1 activity independent of Redd1 and TSC2 (Fig. 7B). At present, we do not know how the MondoA-TXNIP axis suppresses mTORC1 activity. However, given that ectopic expression of TXNIP reduced glucose uptake in TSC2-KO MEFs (Fig. 7C), it is likely that high TXNIP expression results in activation of AMPK, which suppresses mTORC1 activity by phosphorylating TSC2 and raptor (49).
In conclusion, our studies identified mTOR as a regulator of the MondoA-TXNIP axis and provide insights into the conditions under which MondoA-mTOR complexes are formed and disrupted (Fig. 7D). Our work suggests that MondoA-mTOR complexes are regulated during normal homeostatic growth transitions or by ROS-induced stress. Whether MondoA-mTOR complexes are regulated under another condition(s) remains to be determined; however, our studies provide the foundation for a more complete understanding of how cells integrate nutrient status with growth and stress signals.
ACKNOWLEDGMENTS
We thank Timothy Parnell for technical assistance, Chintan Kikani for reagents and advice, and members of the Ayer lab for comments on the manuscript.
D.E.A. is funded by grants 5R01GM055668-15 and 5R01DK084425-03 and developmental funds from the Huntsman Cancer Foundation and Cancer Center Support Grant P30 CA42014.
REFERENCES
- 1.Laplante M, Sabatini DM. 2012. mTOR signaling in growth control and disease. Cell 149:274–293. doi: 10.1016/j.cell.2012.03.017. [DOI] [PMC free article] [PubMed] [Google Scholar]
- 2.Hardwick JS, Kuruvilla FG, Tong JK, Shamji AF, Schreiber SL. 1999. Rapamycin-modulated transcription defines the subset of nutrient-sensitive signaling pathways directly controlled by the Tor proteins. Proc Natl Acad Sci U S A 96:14866–14870. doi: 10.1073/pnas.96.26.14866. [DOI] [PMC free article] [PubMed] [Google Scholar]
- 3.Peng T, Golub TR, Sabatini DM. 2002. The immunosuppressant rapamycin mimics a starvation-like signal distinct from amino acid and glucose deprivation. Mol Cell Biol 22:5575–5584. doi: 10.1128/MCB.22.15.5575-5584.2002. [DOI] [PMC free article] [PubMed] [Google Scholar]
- 4.Yecies JL, Manning BD. 2011. Transcriptional control of cellular metabolism by mTOR signaling. Cancer Res 71:2815–2820. doi: 10.1158/0008-5472.CAN-10-4158. [DOI] [PMC free article] [PubMed] [Google Scholar]
- 5.Wang BT, Ducker GS, Barczak AJ, Barbeau R, Erle DJ, Shokat KM. 2011. The mammalian target of rapamycin regulates cholesterol biosynthetic gene expression and exhibits a rapamycin-resistant transcriptional profile. Proc Natl Acad Sci U S A 108:15201–15206. doi: 10.1073/pnas.1103746108. [DOI] [PMC free article] [PubMed] [Google Scholar]
- 6.DeBerardinis RJ, Lum JJ, Hatzivassiliou G, Thompson CB. 2008. The biology of cancer: metabolic reprogramming fuels cell growth and proliferation. Cell Metab 7:11–20. doi: 10.1016/j.cmet.2007.10.002. [DOI] [PubMed] [Google Scholar]
- 7.Laplante M, Sabatini DM. 2013. Regulation of mTORC1 and its impact on gene expression at a glance. J Cell Sci 126:1713–1719. doi: 10.1242/jcs.125773. [DOI] [PMC free article] [PubMed] [Google Scholar]
- 8.Mayer C, Grummt I. 2006. Ribosome biogenesis and cell growth: mTOR coordinates transcription by all three classes of nuclear RNA polymerases. Oncogene 25:6384–6391. doi: 10.1038/sj.onc.1209883. [DOI] [PubMed] [Google Scholar]
- 9.O'Shea JM, Ayer DE. 2013. Coordination of nutrient availability and utilization by MAX- and MLX-centered transcription networks. Cold Spring Harb Perspect Med 3:a014258. doi: 10.1101/cshperspect.a014258. [DOI] [PMC free article] [PubMed] [Google Scholar]
- 10.Stoltzman CA, Peterson CW, Breen KT, Muoio DM, Billin AN, Ayer DE. 2008. Glucose sensing by MondoA:Mlx complexes: a role for hexokinases and direct regulation of thioredoxin-interacting protein expression. Proc Natl Acad Sci U S A 105:6912–6917. doi: 10.1073/pnas.0712199105. [DOI] [PMC free article] [PubMed] [Google Scholar]
- 11.Peterson CW, Stoltzman CA, Sighinolfi MP, Han KS, Ayer DE. 2010. Glucose controls nuclear accumulation, promoter binding, and transcriptional activity of the MondoA-Mlx heterodimer. Mol Cell Biol 30:2887–2895. doi: 10.1128/MCB.01613-09. [DOI] [PMC free article] [PubMed] [Google Scholar]
- 12.Billin AN, Eilers AL, Coulter KL, Logan JS, Ayer DE. 2000. MondoA, a novel basic helix-loop-helix-leucine zipper transcriptional activator that constitutes a positive branch of a max-like network. Mol Cell Biol 20:8845–8854. doi: 10.1128/MCB.20.23.8845-8854.2000. [DOI] [PMC free article] [PubMed] [Google Scholar]
- 13.Eilers AL, Sundwall E, Lin M, Sullivan AA, Ayer DE. 2002. A novel heterodimerization domain, CRM1, and 14-3-3 control subcellular localization of the MondoA-Mlx heterocomplex. Mol Cell Biol 22:8514–8526. doi: 10.1128/MCB.22.24.8514-8526.2002. [DOI] [PMC free article] [PubMed] [Google Scholar]
- 14.Kaadige MR, Looper RE, Kamalanaadhan S, Ayer DE. 2009. Glutamine-dependent anaplerosis dictates glucose uptake and cell growth by regulating MondoA transcriptional activity. Proc Natl Acad Sci U S A 106:14878–14883. doi: 10.1073/pnas.0901221106. [DOI] [PMC free article] [PubMed] [Google Scholar]
- 15.Chen JL, Merl D, Peterson CW, Wu J, Liu PY, Yin H, Muoio DM, Ayer DE, West M, Chi JT. 2010. Lactic acidosis triggers starvation response with paradoxical induction of TXNIP through MondoA. PLoS Genet 6:e1001093. doi: 10.1371/journal.pgen.1001093. [DOI] [PMC free article] [PubMed] [Google Scholar]
- 16.Elgort MG, O'Shea JM, Jiang Y, Ayer DE. 2010. Transcriptional and translational downregulation of thioredoxin interacting protein is required for metabolic reprogramming during G1. Genes Cancer 1:893–907. doi: 10.1177/1947601910389604. [DOI] [PMC free article] [PubMed] [Google Scholar]
- 17.Sans CL, Satterwhite DJ, Stoltzman CA, Breen KT, Ayer DE. 2006. MondoA-Mlx heterodimers are candidate sensors of cellular energy status: mitochondrial localization and direct regulation of glycolysis. Mol Cell Biol 26:4863–4871. doi: 10.1128/MCB.00657-05. [DOI] [PMC free article] [PubMed] [Google Scholar]
- 18.Thoreen CC, Kang SA, Chang JW, Liu Q, Zhang J, Gao Y, Reichling LJ, Sim T, Sabatini DM, Gray NS. 2009. An ATP-competitive mammalian target of rapamycin inhibitor reveals rapamycin-resistant functions of mTORC1. J Biol Chem 284:8023–8032. doi: 10.1074/jbc.M900301200. [DOI] [PMC free article] [PubMed] [Google Scholar]
- 19.Godbey WT, Wu KK, Mikos AG. 1999. Poly(ethylenimine) and its role in gene delivery. J Control Release 60:149–160. doi: 10.1016/S0168-3659(99)00090-5. [DOI] [PubMed] [Google Scholar]
- 20.Yeung SJ, Pan J, Lee MH. 2008. Roles of p53, MYC and HIF-1 in regulating glycolysis—the seventh hallmark of cancer. Cell Mol Life Sci 65:3981–3999. doi: 10.1007/s00018-008-8224-x. [DOI] [PMC free article] [PubMed] [Google Scholar]
- 21.Nicklin P, Bergman P, Zhang B, Triantafellow E, Wang H, Nyfeler B, Yang H, Hild M, Kung C, Wilson C, Myer VE, MacKeigan JP, Porter JA, Wang YK, Cantley LC, Finan PM, Murphy LO. 2009. Bidirectional transport of amino acids regulates mTOR and autophagy. Cell 136:521–534. doi: 10.1016/j.cell.2008.11.044. [DOI] [PMC free article] [PubMed] [Google Scholar]
- 22.Wang L, Rhodes CJ, Lawrence JC Jr. 2006. Activation of mammalian target of rapamycin (mTOR) by insulin is associated with stimulation of 4EBP1 binding to dimeric mTOR complex 1. J Biol Chem 281:24293–24303. doi: 10.1074/jbc.M603566200. [DOI] [PubMed] [Google Scholar]
- 23.Takahara T, Hara K, Yonezawa K, Sorimachi H, Maeda T. 2006. Nutrient-dependent multimerization of the mammalian target of rapamycin through the N-terminal HEAT repeat region. J Biol Chem 281:28605–28614. doi: 10.1074/jbc.M606087200. [DOI] [PubMed] [Google Scholar]
- 24.Betz C, Hall MN. 2013. Where is mTOR and what is it doing there? J Cell Biol 203:563–574. doi: 10.1083/jcb.201306041. [DOI] [PMC free article] [PubMed] [Google Scholar]
- 25.Kim DH, Sarbassov DD, Ali SM, King JE, Latek RR, Erdjument-Bromage H, Tempst P, Sabatini DM. 2002. mTOR interacts with raptor to form a nutrient-sensitive complex that signals to the cell growth machinery. Cell 110:163–175. doi: 10.1016/S0092-8674(02)00808-5. [DOI] [PubMed] [Google Scholar]
- 26.Soliman GA, Acosta-Jaquez HA, Dunlop EA, Ekim B, Maj NE, Tee AR, Fingar DC. 2010. mTOR Ser-2481 autophosphorylation monitors mTORC-specific catalytic activity and clarifies rapamycin mechanism of action. J Biol Chem 285:7866–7879. doi: 10.1074/jbc.M109.096222. [DOI] [PMC free article] [PubMed] [Google Scholar]
- 27.Reiling JH, Sabatini DM. 2006. Stress and mTORture signaling. Oncogene 25:6373–6383. doi: 10.1038/sj.onc.1209889. [DOI] [PubMed] [Google Scholar]
- 28.Li M, Zhao L, Liu J, Liu A, Jia C, Ma D, Jiang Y, Bai X. 2010. Multi-mechanisms are involved in reactive oxygen species regulation of mTORC1 signaling. Cell Signal 22:1469–1476. doi: 10.1016/j.cellsig.2010.05.015. [DOI] [PubMed] [Google Scholar]
- 29.Zhang J, Kim J, Alexander A, Cai S, Tripathi DN, Dere R, Tee AR, Tait-Mulder J, Di Nardo A, Han JM, Kwiatkowski E, Dunlop EA, Dodd KM, Folkerth RD, Faust PL, Kastan MB, Sahin M, Walker CL. 2013. A tuberous sclerosis complex signalling node at the peroxisome regulates mTORC1 and autophagy in response to ROS. Nat Cell Biol 15:1186–1196. doi: 10.1038/ncb2822. [DOI] [PMC free article] [PubMed] [Google Scholar]
- 30.Sarbassov DD, Sabatini DM. 2005. Redox regulation of the nutrient-sensitive raptor-mTOR pathway and complex. J Biol Chem 280:39505–39509. doi: 10.1074/jbc.M506096200. [DOI] [PubMed] [Google Scholar]
- 31.Yoshida S, Hong S, Suzuki T, Nada S, Mannan AM, Wang J, Okada M, Guan KL, Inoki K. 2011. Redox regulates mammalian target of rapamycin complex 1 (mTORC1) activity by modulating the TSC1/TSC2-Rheb GTPase pathway. J Biol Chem 286:32651–32660. doi: 10.1074/jbc.M111.238014. [DOI] [PMC free article] [PubMed] [Google Scholar]
- 32.Fanelus I, Desrosiers RR. 2008. Reactive oxygen species generated by thiol-modifying phenylarsine oxide stimulate the expression of protein L-isoaspartyl methyltransferase. Biochem Biophys Res Commun 371:203–208. doi: 10.1016/j.bbrc.2008.04.009. [DOI] [PubMed] [Google Scholar]
- 33.Flora SJ, Bhadauria S, Kannan GM, Singh N. 2007. Arsenic induced oxidative stress and the role of antioxidant supplementation during chelation: a review. J Environ Biol 28:333–347. [PubMed] [Google Scholar]
- 34.Jin HO, Seo SK, Kim YS, Woo SH, Lee KH, Yi JY, Lee SJ, Choe TB, Lee JH, An S, Hong SI, Park IC. 2011. TXNIP potentiates Redd1-induced mTOR suppression through stabilization of Redd1. Oncogene 30:3792–3801. doi: 10.1038/onc.2011.102. [DOI] [PubMed] [Google Scholar]
- 35.Sengupta S, Peterson TR, Sabatini DM. 2010. Regulation of the mTOR complex 1 pathway by nutrients, growth factors, and stress. Mol Cell 40:310–322. doi: 10.1016/j.molcel.2010.09.026. [DOI] [PMC free article] [PubMed] [Google Scholar]
- 36.Kaadige MR, Elgort MG, Ayer DE. 2010. Coordination of glucose and glutamine utilization by an expanded Myc network. Transcription 1:36–40. doi: 10.4161/trns.1.1.12142. [DOI] [PMC free article] [PubMed] [Google Scholar]
- 37.Lane T, Flam B, Lockey R, Kolliputi N. 2013. TXNIP shuttling: missing link between oxidative stress and inflammasome activation. Front Physiol 4:50. doi: 10.3389/fphys.2013.00050. [DOI] [PMC free article] [PubMed] [Google Scholar]
- 38.Zhou J, Yu Q, Chng WJ. 2011. TXNIP (VDUP-1, TBP-2): a major redox regulator commonly suppressed in cancer by epigenetic mechanisms. Int J Biochem Cell Biol 43:1668–1673. doi: 10.1016/j.biocel.2011.09.005. [DOI] [PubMed] [Google Scholar]
- 39.Shah A, Xia L, Goldberg H, Lee KW, Quaggin SE, Fantus IG. 2013. Thioredoxin-interacting protein mediates high glucose-induced reactive oxygen species generation by mitochondria and the NADPH oxidase, Nox4, in mesangial cells. J Biol Chem 288:6835–6848. doi: 10.1074/jbc.M112.419101. [DOI] [PMC free article] [PubMed] [Google Scholar]
- 40.He X, Ma Q. 2012. Redox regulation by nuclear factor erythroid 2-related factor 2: gatekeeping for the basal and diabetes-induced expression of thioredoxin-interacting protein. Mol Pharmacol 82:887–897. doi: 10.1124/mol.112.081133. [DOI] [PMC free article] [PubMed] [Google Scholar]
- 41.Ogata FT, Batista WL, Sartori A, Gesteira TF, Masutani H, Arai RJ, Yodoi J, Stern A, Monteiro HP. 2013. Nitrosative/oxidative stress conditions regulate thioredoxin-interacting protein (TXNIP) expression and thioredoxin-1 (TRX-1) nuclear localization. PLoS One 8:e84588. doi: 10.1371/journal.pone.0084588. [DOI] [PMC free article] [PubMed] [Google Scholar]
- 42.Yu Y, Yoon SO, Poulogiannis G, Yang Q, Ma XM, Villen J, Kubica N, Hoffman GR, Cantley LC, Gygi SP, Blenis J. 2011. Phosphoproteomic analysis identifies Grb10 as an mTORC1 substrate that negatively regulates insulin signaling. Science 332:1322–1326. doi: 10.1126/science.1199484. [DOI] [PMC free article] [PubMed] [Google Scholar]
- 43.Stoltzman CA, Kaadige MR, Peterson CW, Ayer DE. 2011. MondoA senses non-glucose sugars: regulation of thioredoxin-interacting protein (TXNIP) and the hexose transport curb. J Biol Chem 286:38027–38034. doi: 10.1074/jbc.M111.275503. [DOI] [PMC free article] [PubMed] [Google Scholar]
- 44.Shalev A. 2014. Minireview: thioredoxin-interacting protein: regulation and function in the pancreatic beta-cell. Mol Endocrinol 28:1211–1220. doi: 10.1210/me.2014-1095. [DOI] [PMC free article] [PubMed] [Google Scholar]
- 45.Versari S, Longinotti G, Barenghi L, Maier JA, Bradamante S. 2013. The challenging environment on board the International Space Station affects endothelial cell function by triggering oxidative stress through thioredoxin interacting protein overexpression: the ESA-SPHINX experiment. FASEB J 27:4466–4475. doi: 10.1096/fj.13-229195. [DOI] [PubMed] [Google Scholar]
- 46.Roberts DJ, Tan-Sah VP, Ding EY, Smith JM, Miyamoto S. 2014. Hexokinase-II positively regulates glucose starvation-induced autophagy through TORC1 inhibition. Mol Cell 53:521–533. doi: 10.1016/j.molcel.2013.12.019. [DOI] [PMC free article] [PubMed] [Google Scholar]
- 47.Davies MN, O'Callaghan BL, Towle HC. 2008. Glucose activates ChREBP by increasing its rate of nuclear entry and relieving repression of its transcriptional activity. J Biol Chem 283:24029–24038. doi: 10.1074/jbc.M801539200. [DOI] [PMC free article] [PubMed] [Google Scholar]
- 48.Havula E, Hietakangas V. 2012. Glucose sensing by ChREBP/MondoA-Mlx transcription factors. Semin Cell Dev Biol 23:640–647. doi: 10.1016/j.semcdb.2012.02.007. [DOI] [PubMed] [Google Scholar]
- 49.Shackelford DB, Shaw RJ. 2009. The LKB1-AMPK pathway: metabolism and growth control in tumour suppression. Nat Rev Cancer 9:563–575. doi: 10.1038/nrc2676. [DOI] [PMC free article] [PubMed] [Google Scholar]