Abstract
Plasma cells (PCs) are responsible for the secretion of antibodies. The development of fully functional PCs relies on the activation of the inositol-requiring enzyme 1/X-box binding protein 1 (IRE1/XBP-1) arm of the unfolded protein response (UPR). XBP-1-deficient PCs secrete antibodies poorly and exhibit distensions of the endoplasmic reticulum (ER). The kinase mammalian target of rapamycin (mTOR) promotes anabolic activities and is negatively regulated by the tuberous sclerosis complex (TSC). Deletion of TSC1 renders mTOR hyperactive. To explore the relationship between mTOR and the UPR in PC development and function, mice with conditional deletions of XBP-1 and/or TSC1 in their B cell lineage were generated. Deletion of TSC1 enhanced Ig synthesis and promoted differentiation into PCs independently of XBP-1, as evidenced by comparison of TSC1/XBP-1 double-knockout (DKO) PCs to XBP-1 knockout (KO) PCs. The typical morphological abnormalities of the ER in XBP-1 KO PCs were alleviated in the DKO PCs. Expression profiling identified the glycoprotein Ly6C as an mTOR target. Ly6C expression contributed to the enhanced Ig secretion from DKO PCs. Our data reveal a functional overlap between mTOR and the UPR in promoting PC development. In addition to the classical mTOR role in promoting protein synthesis, the mechanism entails transcription regulation of accessory molecules, such as Ly6C.
INTRODUCTION
The endoplasmic reticulum (ER) is the port of entry into the secretory pathway. ER stress is a state of imbalance between the protein-folding capacities and the amount of proteins in the ER. A network of signaling pathways termed the unfolded protein response (UPR) restores the disrupted balance in the ER or executes apoptosis when ER stress becomes terminal. In mammalian cells, the UPR operates in three parallel pathways named for ER stress sensors: inositol-requiring enzyme 1 (IRE1), protein kinase-like endoplasmic reticulum kinase (PERK), and activating transcription factor 6 (ATF6). These sensors activate downstream signals that regulate gene transcription and protein synthesis (1).
Following a signal to differentiate into plasma cells (PCs), the ER of a B cell expands and becomes permissive for the synthesis, proper folding, assembly, and secretion of copious amounts of antibodies. For reasons that are not fully understood, the remodeling of the ER in the course of PC differentiation is controlled solely by the IRE1/X-box binding protein 1 (XBP-1) pathway of the UPR (2, 3). In the absence of XBP-1 or IRE1, B cells develop normally to the mature state but yield long-lived PCs that secrete small amounts of Igs (4–7).
Mammalian target of rapamycin (mTOR) is a key metabolic serine/threonine kinase which exists in at least two multisubunit complexes, referred to as mTOR complex 1 (mTORC1) and mTORC2 (8). mTORC1 funnels multiple signaling pathways from inside and outside the cell. When activated, mTORC1 promotes anabolic processes and enhances protein synthesis and cell growth (9). When it is inhibited, macroautophagy is induced (10). mTOR, primarily in the form of mTORC1, plays major roles in cancer and immune functions (11, 12). Much of the knowledge on the role of mTOR in immune regulation has been obtained from loss-of-function experiments using rapamycin or analogs thereof. However, the effect that mTOR activation has on the immune system remains unclear. At the mature state of B cell development, mTOR is activated in response to Toll-like receptor and B cell receptor (BCR) stimulation downstream from the phosphatidylinositol 3-kinase (PI3K)/Akt signaling pathway. Akt activates mTORC1 indirectly by reversing the tuber sclerosis complex (TSC) inhibition of mTOR. TSC is a complex that contains TSC1 and TSC2. Among many other functions, the mTOR pathway adjusts protein synthesis to the prosperity conditions of the cell. mTOR is activated when the ATP/AMP ratio or the intracellular pool of amino acids is high. The control of protein synthesis is regulated by mTOR-specific phosphorylation of 4E-BP1 and p70S6K1, both of which, when phosphorylated, mediate acceleration of protein synthesis and cell growth (13–15). Hence, inhibition of the mTOR globally reduces protein synthesis and cell size.
We previously reported that mTOR is the predominant mechanism that controls protein synthesis in the late phase of lipopolysaccharide (LPS)-activated B cells, in a manner rigorously controlled by ER stress. Genetic ablation of TSC1 ex vivo resulted in enhanced apoptosis of developing PCs (16). A follow-up study using CD19-Cre-mediated deletion of TSC1 identified a role of mTOR in controlling B cell development into the marginal zone (MZ) subset (17). We surmised that exaggerated activation of mTOR is toxic to MZ cells, perhaps due to ER stress. However, antibody titers were normal despite the severe impairment in B cell development in CD19-Cre/TSC1flox/flox (TSC1 knockout [KO]) mice. This unexpected observation led us to characterize PC differentiation in B cells in which TSC1 was deleted. We further generated CD19-Cre/XBP-1flox/flox/TSC1flox/flox mice (referred to as double-knockout [DKO] mice) to investigate the cross talk between the mTOR and UPR pathways.
Here, we show that mTOR positively regulates PC differentiation. PCs were enriched in TSC1 KO and DKO lymphoid organs and bone marrow (BM). The serum Ig titers of DKO mice were significantly higher than those of B cell-specific XBP-1 KO animals. In particular, the IgA titers were in the normal range. In vitro, B cells of DKO mice generated higher levels of Ig molecules than XBP-1 KO B cells upon stimulation. Remarkably, mTOR activation corrected the distended ER morphology of XBP-1 KO PCs. Finally, we identified Ly6C as a downstream target of mTOR activation, which contributes to the elevated Ig secretion in DKO PCs relative to that of XBP-1 KO PCs.
MATERIALS AND METHODS
Mice.
CD19-Cre/XBP1flox/flox, CD19-Cre/TSC1flox/flox, and RERT/TSC1flox/flox mice were previously described (16, 18). ROSA26-floxed stop-lacZ yellow fluorescent protein (YFP) reporter mice were provided by Yuval Dor (Hebrew University). All CD19-Cre strains were crossed for 5 generations onto the YFP reporter strain, and all RERT strains were crossed for 5 generations onto the BALB/c background. All animal studies were conducted in accordance with the Principles of Laboratory Animal Care (46). The ethical committee for animal use of Hadassah and the Faculty of Medicine reviewed and approved the protocols for animal welfare.
Antibodies and reagents.
Antibodies against phosphorylated S6 (P-S6), S6, P-AKT(S473) (serine residue at position 473), AKT, and IRE1 were purchased from Cell Signaling Technology. Anti-XBP-1 was purchased from Santa Cruz Biotechnology. Allophycocyanin (APC)-annexin V, rat anti-CD138-APC antibody, rat anti-mouse CD45R/B220-peridinin chlorophyll protein (PerCP) antibody, rat anti-mouse Ly6C-phycoerythrin (PE) antibody, rat anti-mouse CD5-PE antibody, and isotype control rat IgG2a-PerCP antibody were purchased from BioLegend, Inc. (San Diego, CA). Rat anti-mouse Kappa-PE antibody (κ chain specific) was purchased from Southern Biotechnology Associates, Inc. (Birmingham, AL). Isotype control rat IgG2b was purchased from Ebioscience (San Diego, CA). Rapamycin was purchased from LC Laboratories (Woburn, MA). Horseradish peroxidase (HRP)-conjugated LC3 was purchased from Novus Biological (Littleton, CO). TSC-1 antibody and p62 antibody were purchased from Cell Signaling (Danvers, MA). Ly6C blocking antibody (clone 1G7G10) was kindly provided by Sirpa Jalkanen (University of Turku, Finland) and used at 10 μg/ml. Carboxyfluorescein diacetate succinimidyl ester (CFSE) was purchased from Invitrogen.
B cell isolation and culture.
Mature B cells were purified from mouse splenocytes by magnetic depletion with anti-CD43 antibody (Miltenyi Biotec, Bergisch Gladbach, Germany). Cells were plated at 1.5 × 10⁶ cells/ml in complete medium (RPMI 1640; Invitrogen-Gibco) supplemented with 10% fetal bovine serum (FBS; Biological Industries, Kibbutz Beit Haemek, Israel), 2 mM glutamine, 50 U/ml penicillin, 50 μg/ml streptomycin, 50 μM β-mercaptoethanol (β-ME), 25 mM 1× nonessential amino acids, 1 mM sodium pyruvate (Biological Industries, Kibbutz Beit Haemek, Israel), and 20 mg/ml Escherichia coli LPS (product number L3755; Sigma). Peripheral lymph nodes (pLN; including axilar, inguinal, and popliteal lymph nodes) were excised and the tissues mechanically dissociated to produce a single-cell suspension. Mesenteric lymph nodes (MLN) were excised from the mesenteric tissue, rinsed in cold phosphate-buffered saline (PBS), and incubated in digestion solution comprising 1 mg/ml collagenase (Sigma), 0.33 mg/ml DNase I (Roche Diagnostics, Mannheim, Germany), and 0.1 mg/ml dispase II (Sigma). The MLN cells were shaken for 45 min at 37°C, gently scratched, resuspended, filtered through a 70-μm cell strainer, and plated at 2 × 10⁶ cells/ml in complete medium. Stimulation was performed with 0.4 mg/ml APRIL (Peprotech/Tebu, Frankfurt, Germany) for 6 days.
Bone marrow (BM) cells were extracted from femurs and tibiae of mice, and surrounding muscle tissue removed. Thereafter, intact bones were left for disinfection in 70% ethanol for 1 min, washed twice in PBS, and transferred into a fresh dish with RPMI 1640. Then, both ends of the bone were cut with scissors and the marrow was flushed with 2 ml of RPMI 1640 using a syringe and 25-gauge needle. Clusters within the marrow suspension were disintegrated by vigorous pipetting, put on ice for 3 min to remove debris, and treated with red blood cell lysis buffer.
Measurement of serum immunoglobulins.
Immunoglobulin concentrations were assessed by enzyme-linked immunosorbent assay (ELISA) in the sera and in culture supernatants of spleens or in the supernatants of mesenteric lymph nodes using SBA clonotyping system-HRP kits (Southern Biotechnology Associates, Inc., Birmingham, AL). Series dilutions were performed. The optical density measurements at the linear phase of dilutions are shown in the figures.
Flow cytometry analysis.
Single cells were stained with conjugated mouse antibodies or mouse isotype control antibodies for 30 to 45 min on ice and washed. Propidium iodide (PI) labeling (50 mg/ml) was done for 10 min. CFSE labeling (1 μM) was performed for 5 min at room temperature. Flow cytometry was performed on a BD LSRII flow cytometer (Becton Dickinson, Franklin Lakes, NJ), and data were analyzed using FCS Express V3 analysis software (De Novo, Glendale, CA).
Preparation of cells for transmission electron microscopy.
LPS-induced plasmablasts were isolated from day 3 LPS-stimulated cultures using the CD138+ plasma cell isolation kit of Miltenyi Biotec. For bone marrow PCs, cells were sorted from the bone marrow based on YFP and CD138 expression. Cells were collected and fixed in 2.5% glutaraldehyde, 2% paraformaldehyde in 0.1 M cacodylate buffer (pH 7.4) for 2 h at room temperature and then rinsed 4 times for 10 min each time in cacodylate buffer, postfixed, and stained with 1% osmium tetroxide, 1.5% potassium ferricyanide in 0.1 M cacodylate buffer for 1 h. Cells were then washed 4 times in cacodylate buffer, followed by dehydration in increasing concentrations of ethanol consisting of 30, 50, 70, 80, 90, and 95% for 10 min at each step, followed by 100% anhydrous ethanol 3 times for 20 min each time and propylene oxide 2 times for 10 min each time. Following dehydration, the cells were infiltrated with increasing concentrations of agar 100 resin in propylene oxide, consisting of 25, 50, 75, and 100% resin for 16 h at each step. The cells were then embedded in fresh resin and allowed to polymerize in an oven at 60°C for 48 h.
Embedded cells in blocks were sectioned with a diamond knife on an LKB 3 microtome, and ultrathin sections (80 nm) were collected onto 200-mesh thin-bar copper grids. The sections on the grids were sequentially stained with uranyl acetate and lead citrate for 10 min each and viewed with a Tecnai 12 transmission electron microscope (TEM) at 100 kV (Phillips, Eindhoven, the Netherlands) and equipped with a MegaView II charge-coupled-device (CCD) camera and Analysis version 3.0 software (SoftImaging System GmbH, Munster, Germany).
IgA ELISpot analysis.
IgA-secreting plasma cells in mesenteric lymph node cells were determined by enzyme-linked immunosorbent spot assay (ELISpot) using an ELISpotPlus kit for mouse IgA (Mabtech, Sophia Antipolis, France). Briefly, the ELISpot plate was prewetted by adding 50 ml 70% ethanol per well for 2 min and coated with total IgA antibody diluted in PBS overnight at 4°C. After 5 washes with sterile PBS, the plate was blocked with complete medium (RPMI 1640, 2 mM glutamine, 50 U/ml penicillin, 50 μg/ml streptomycin, 50 μM β-ME, 25 mM 1× nonessential amino acids, and 1 mM sodium pyruvate) containing 10% FBS for 30 min at room temperature. Cell suspensions were added to the ELISpot plate (50,000 cells/200 ml/well), and the plate was incubated in a 37°C humidified incubator with 5% CO2 for 16 to 24 h. The plate was washed 5 times with sterile PBS and biotinylated with anti-IgA to 1 mg/ml in PBS containing 0.5% FBS for 2 h at room temperature. After washing in sterile PBS, streptavidin-alkaline phosphatase (ALP) (1:1,000) in PBS–0.5% FBS was added and the plate incubated for 1 h at room temperature. After washing in sterile PBS, the individual IgA-secreting cells were visualized by adding the BCIP–NBT-plus substrate (0.692 mM 5-bromo-4-chloro-3-indolylphosphate and 0.734 mM nitroblue tetrazolium in a 2-amino-2-methyl-1-propanol buffer at pH 9.8) (Mabtech), and the reaction was stopped by extensive washing in tap water.
Metabolic labeling, pulse-chase analysis, and immunoprecipitation.
Pulse labeling was performed as previously described (6). Briefly, after starvation in methionine- and cysteine-free Dulbecco's modified Eagle's medium (Biological Industries, Beit Haemek, Israel) for 45 min, cells were metabolically labeled with [35S]methionine-cysteine (7.5 μCi/500 μl) (PerkinElmer, USA) at 37°C for 20 min. To compare the incorporation of radiolabeled [35S]methionine, lysates of an equal number of metabolically labeled cells were prepared in 1% SDS diluted in lysis buffer (50 mM Tris, pH 8, 200 mM NaCl, 20 mM MgCl2, 1% NP-40, 3 μl/ml normal rabbit serum, 10 μl/ml 0.1% bovine serum albumin [BSA], and protease inhibitors). Goat anti-mouse isotype-specific antibodies were used for immunoprecipitation.
qRT-PCR.
Total RNA was isolated using TriReagent (Sigma). RNA samples were treated with DNase I and purified by ethanol precipitation. One microgram of total RNA was transcribed into cDNA using a Reverse-iT first-strand synthesis kit with random decamers (Fermentas). Real-time PCRs were performed using a SYBR green PCR master mix (Finnzyme) and CFX Connect real-time PCR system (Bio-Rad). The Ly6C expression level in all samples compared to that of ubiquitin C was determined to control for any variability in RNA input. The following primers were used for quantitative real-time (qRT)-PCR: Ly6C-F, GCA GTG CTA CGA GTG CTA TGG; Ly6C-R, ACT GAC GGG TCT TTA GTT TCC TT; UBC-F, CAG CCG TAT ATC TTC CCA GAC T; ERp72-F, AGT CAA GGT GGT GGT GGG AAA G; ERp72-R, TGG GAG CAA AAT AGA TGG TAG GG; Derlin 3-F, TGG GAT TCG GCT TCT TTT TC; Derlin 3-R, GAA CCC TCC TCC AGC AT; and UBC-R, CTC AGA GGG ATG CCA GTA ATC TA. The thermal cycling conditions included initial denaturation at 95°C for 3 min, followed by 39 cycles of 3 s at 95°C, 30 s at 60°C and then 10 s at 95°C, 5 s at 65°C, and 50 s at 95°C.
Analysis of XBP-1 deletion by PCR.
Mature B cells from the spleens of DKO/YFP mice were purified as described above and sorted for YFP fractions. DNA was purified and subjected to PCR analysis (annealing temperature, 58°C, 40 cycles) with the following primers: INT1-S, CTTTGTGGTCGTAGGGTAGGAACC; 3′lox-S, ACTTGCACCAACACTTGCCATTTC; and 3′lox-A, CAAGGTGGTTCACTGCCTGTAATG.
Single-cell XBP-1 deletion in PCs was performed by sorting YFP CD138 doubly positive cells from the bone marrow and amplifying the genome with a single-cell whole-genome amplification (WGA) kit (New England BioLabs) according to the manufacturer's instructions.
Western blot analysis.
Cells were washed twice with cold phosphate-buffered saline, and whole-cell lysates were prepared in radioimmunoprecipitation assay (RIPA) buffer (25 mM Tris-HCl, pH 7.6, 150 mM NaCl, 1% NP-40, 1% sodium deoxycholate, 0.1% SDS, 1 mM Na3VO4, 50 mM NaF, 10 mM sodium glycerophosphate, 10 mM sodium pyrophosphate, and protease inhibitors [catalog number S8820; Sigma-Aldrich]). The lysate was cleared by centrifugation. Total protein concentration was determined using the bicinchoninic acid (BCA) protein assay reagent kit (Pierce). Following SDS-PAGE analysis under reducing conditions, gels were electrotransferred to nitrocellulose membranes. Membranes were blocked in Tris-buffered saline containing 0.1% Tween 20 (TBST), 5% milk powder and probed with the specific antibodies, followed by secondary horseradish peroxidase-conjugated antibodies. Enhanced chemiluminescence (ECL) reagents (Biological Industries, Beit Haemek, Israel) were used to develop the blots by chemiluminescence. p97 was used for controlling protein loading.
RESULTS
TSC1 deletion promotes PC differentiation.
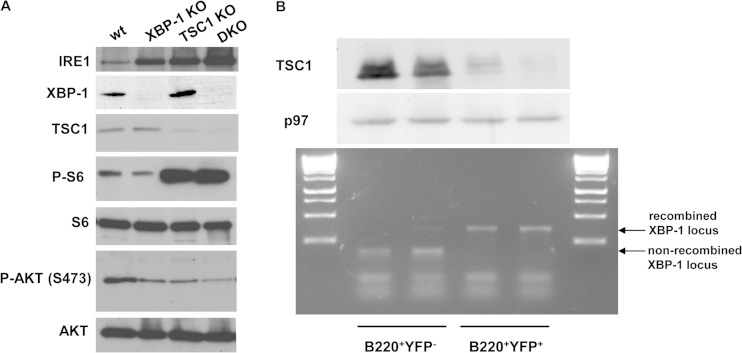
To verify that the deletion of TSC1 in the context of XBP-1 deletion induces the activity of mTOR, splenic B cells from wild-type (wt), XBP-1 KO, TSC1 KO, and DKO animals were isolated and stimulated with LPS for 3 days. Live cells were isolated by centrifugation over Lympholyte M, and protein extracts were made. As seen by the results in Fig. 1A, immunoblot analyses demonstrated the loss of TSC1 expression in the TSC1 KO and DKO cells and the corresponding increase in mTOR activity, determined by P-S6 levels. The total levels of p70 S6K1 were similar between the 4 genotypes (not shown), while P-S6K1 levels were below the detection limit.
FIG 1.
TSC1 KO and DKO PCs display elevated mTOR activity and IRE1 expression levels. (A) B cells were isolated from the spleens of wt/YFP, XBP-1 KO/YFP, TSC1 KO/YFP, and DKO/YFP mice and subjected to stimulation with LPS for 3 days. At day 3, live cells were separated over Lympholyte M and total cell extracts were made in RIPA buffer. Shown is a typical immunoblot from three independent analyses with the indicated antibodies. (B) MLN cells were isolated from DKO/YFP mice and subjected to stimulation with APRIL for 6 days. Cells were stained for B220 and YFP+ B220+, and YFP− B220+ cells were sorted. Immunoblotting for TSC1 confirmed the reduction in its expression in the YFP+ cells. PCR for the floxed XBP-1 allele confirmed the recombination of the locus in the YFP+ cells. Shown are the results of two independent experiments.
Immunoblots confirmed the deletion of XBP-1 in XBP-1 KO and DKO cells and the concomitant, well characterized increase in the level of expression of IRE1 (7). Interestingly, the expression of IRE1 was induced also in TSC1 KO cells, serving as an indication of stress conditions that develop in the stimulated cells. We also checked the activation status of AKT, measuring the mTORC2-dependent phosphorylation on S473. As was shown for TSC1 macrophages (19), the P-AKT level was reduced following TSC1 deletion in either TSC1 KO or DKO cells compared to the level in wt cells. XBP-1 KO cells had a similar level of P-AKT, perhaps indicating reduced BCR tonic signaling, as was recently suggested (20). These data confirm that DKO cells display the combined biochemical signature of XBP-1 and TSC1 deletions.
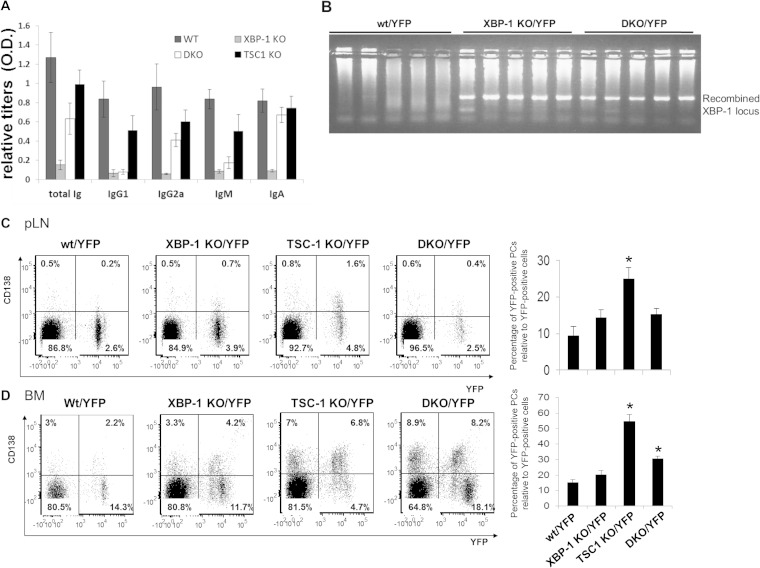
The CD19-driven Cre deletion of TSC1 delays B cell maturation in the spleen and impairs the generation of MZ B cells and germinal center formation. And yet, naive TSC1 KO mice display normal antibody titers. This prompted us to enumerate the PCs in wt and TSC1 deletion mutant animals. Since deletion of TSC1 in some cell types induces UPR (14, 21) and, thus, may contribute to PC development indirectly, CD19-Cre/TSC1flox/flox (TSC1 KO) mice were crossed to a floxed XBP-1 background (DKO) to assess the contribution of UPR. Comparison of the serum Ig titers of XBP-1 KO and DKO mice relative to those of wt and TSC1 KO mice indicated the expected reduction in IgM and IgG1 levels in the XBP-1-deficient animals. However, in stark contrast to XBP-1 KO mice, DKO mice exhibited a marked elevation, particularly for IgA levels. In fact, the IgA titers for a portion of DKO mice were equivalent to those of wt and TSC1 KO mice (Fig. 2A). These data suggest that mTOR activation can override the need for XBP-1 in antibody secretion, at least for certain isotypes.
FIG 2.
Deletion of TSC1 promotes PC differentiation. (A) Sera of wt, XBP-1 KO, TSC1 KO, and DKO mice were analyzed for antibody titers by ELISA (n = 10). (B) Single-cell PCR analysis for XBP-1 recombination of YFP/CD138 double-positive PCs derived from bone marrow of wt, XBP-1 KO, and DKO mice. (C and D) Cells derived from pLN (C) and BM (D) of the various CD19-Cre/YFP strains were stained for the CD138 plasma cell marker and analyzed by flow cytometry according to the markers shown. The graphs show the average results of three independent analyses. Statistical significance was calculated by Student's t test, comparing results for TSC1 KO mice and wt mice and results for DKO mice and XBP-1 KO mice (*, P < 0.05). Error bars indicate standard errors (SE).
To facilitate enumeration of the KO cells by flow cytometry, all the conditional KO strains were crossed to a ROSA26-STOP-YFP knocked-in reporter strain, in which YFP is expressed only upon Cre-mediated recombination (14). In total, four strains were generated: wt/YFP, XBP-1 KO/YFP, TSC1 KO/YFP, and DKO/YFP. YFP-positive (YFP+) and -negative (YFP−) cells were sorted from the spleens of DKO/YFP mice to ensure that the YFP expression represents a successful recombination of both TSC1 and XBP-1 genes. Immunoblot analysis indicated that TSC1 was not expressed in the YFP-positive fraction, implicating YFP as a reliable marker of TSC1 recombination. PCR analysis for the XBP-1 locus from the same fractions demonstrated the full recombination of the XBP-1 floxed gene (Fig. 1B). Similar results were obtained for B cells sorted from the various lymph nodes. To ensure that deletion of the XBP-1 locus occurs in the PC compartment, single PCs were also isolated from the bone marrow of wt/YFP, XBP-1 KO/YFP, and DKO/YFP mice based on YFP and surface CD138 expression. Following amplification of their DNA content, XBP-1 recombination was observed in all PCs analyzed (Fig. 2B). We conclude that YFP expression reliably indicates CD19-driven recombination of both the XBP-1 and TSC1 locus.
Next, we isolated single-cell suspensions of spleens, peripheral lymph nodes (pLN), and bone marrow (BM) from all four strains and analyzed them for YFP (an indicator for CD19 expression) and the PC marker CD138. PCs were not detected in naive spleens of either YFP strain. We detected an enrichment of surface CD138 in the YFP-positive pLN cells of TSC1 KO mice. This increase was abrogated in the DKO pLN, suggesting that the mechanism may involve the induction of UPR. It is noteworthy that TSC1 KO and DKO pLN cells contained fewer YFP-positive B cells to begin with (Fig. 2C). Our data indicate that although TSC1 is required for proper B cell maturation, its absence promotes the expansion of PCs in pLN in a mechanism that involves XBP-1.
Long-lived PCs reside primarily in the BM (22). Analysis of BM PCs showed that, while the majority of YFP-positive cells in wt and XBP-1 KO mice were CD138 negative, a greater amount of the YFP-positive cells were positive for CD138 in TSC1 KO BM, as observed in pLN cells. A more modest but significant enrichment in CD138 population was observed in DKO mouse BM relative to that of wt and XBP-1 KO mice (Fig. 2D). We conclude that the deletion of TSC1 confers enrichment in PCs in the lymph nodes and BM. The milder phenotype of the DKO mice suggests that the mechanism is partially mediated by XBP-1.
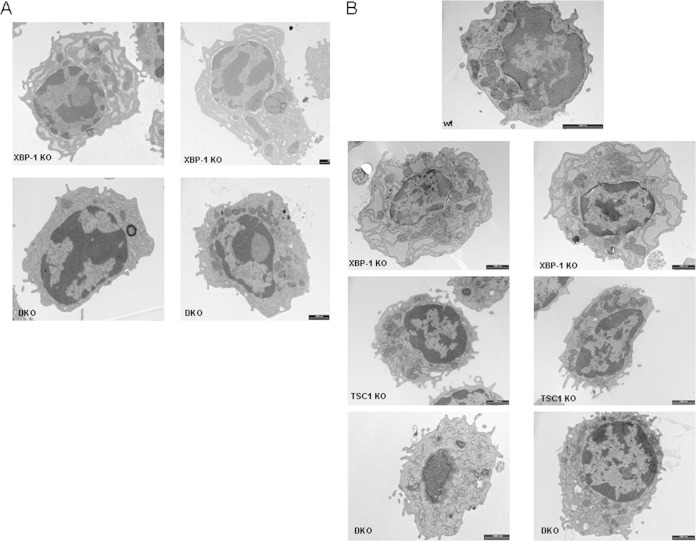
A recent study utilizing Blimp-1/green fluorescent protein (GFP) knock-in mice to enumerate and characterize the role of XBP-1 in PC development demonstrated normal development of PCs in the absence of XBP-1. However, these cells exhibit a defect in ER morphology (5). We confirmed this phenotype also for LPS-induced plasmablasts (7). To explore whether TSC1 deletion affects the morphology of the ER, DKO LPS-induced plasmablasts were isolated in parallel to the XBP-1 KO cells and subjected to EM analysis. It was clear that the ER was less deflated in the DKO cells (Fig. 3A). Inclusion of rapamycin in the last 24 h of culture did not affect the morphology of the ER in XBP-1 KO and DKO plasmablasts (not shown). This suggests an intricate cross talk between the UPR and mTOR pathways that control the homeostasis and remodeling of the ER following B cell stimulation.
FIG 3.
ER distensions are reduced in DKO PCs relative to the ER morphology in XBP-1 KO PCs. (A) B cells of XBP-1 KO and DKO mice were isolated and stimulated for 3 days with LPS. At day 3, CD138-positive cells were separated by magnetic sorting and subjected to TEM. (B) Bone marrow of the various CD19-Cre/YFP strain mice was sorted for YFP and CD138 markers and visualized by TEM. More than 50 cells for each genotype were inspected. Shown are typical cells from 2 independent separations. Bars, 1 μm.
We were interested to assess whether bone marrow PCs also share this feature. Based on the CD138/YFP markers, PCs were sorted from the BM and processed for transmission electron microscopy (TEM). As expected, XBP-1-deficient PCs exhibited a dilated ER morphology. The vast majority of the DKO PCs had an ER morphology indistinguishable from that of wt or TSC1 KO PCs (Fig. 3B), reinforcing the conclusion that mTOR either promotes corrective measures for ER homeostasis under conditions of impaired UPR or selects for PCs with a functional ER.
TSC1 deletion promotes IgA secretion in the absence of XBP-1.
Because IgA was enriched in the sera of DKO mice relative to its levels in sera of XBP-1 KO mice, we wanted to assess the contribution of mTOR activation to IgA synthesis and secretion in vitro. To this end, we subjected isolated mesenteric lymph node (MLN) lymphocytes of the various YFP strains to stimulation by APRIL, a tumor necrosis factor alpha (TNF) superfamily cytokine. This protocol is far less efficient than generating IgM-secreting cells from splenic B cells by LPS or other cytokine combinations. However, to our knowledge, it is the most specific protocol to generate IgA-secreting cells (23). It should be emphasized that if B cells are isolated at day 0, their survival is compromised relative to B cell survival when the entire MLN cell contents are cultured. Therefore, as an indicator of PC differentiation, we calculated the relative proportion of CD138+/YFP+ cells from the entire population of YFP+ cells.
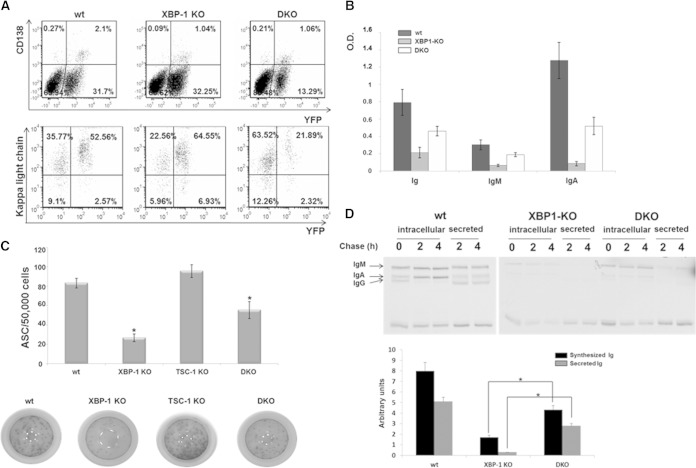
At the time of extraction, most of the MLN B cells were YFP positive. The YFP-negative population mostly comprised CD5-positive, CD19-negative cells (not shown). Following stimulation, the intracellular light chain content was higher in YFP+ than in YFP− cells of wt mice, and CD138 was expressed exclusively in the YFP+ compartment, indicating that antibody-forming cells (AFCs) are mostly in the YFP+ population (Fig. 4A). YFP-positive DKO B cells were strongly reduced in their proportion relative to the YFP-negative B cells, a phenomenon that was not observed for wt or XBP-1 KO cells. However, consistent with the findings in BM, the percentage of the CD138+ YFP+ DKO B cells relative to the entire YFP+ population was elevated in DKO cells relative to the percentage in XBP-1 KO cells (Fig. 4A).
FIG 4.
mTOR activation promotes IgA secretion in the absence of XBP-1. (A) MLN cells of wt/YFP, XBP-1 KO/YFP, and DKO/YFP mice were extracted, stimulated for 6 days with APRIL, and analyzed by flow cytometry analysis for the CD138 marker and their intracellular content of the Ig light chain as indicators of PCs. (B) Supernatants of APRIL-stimulated MLN cells of wt, XBP-1 KO, and DKO were analyzed for Ig, IgM, and IgA secretion by ELISA (n = 6). O.D., optical density. (C) At day 6 of stimulation, YFP-positive MLN cells of wt/YFP, XBP-1 KO/YFP, TSC-1 KO/YFP, and DKO/YFP mice were sorted and enumerated for antibody-secreting cells (ASC) by IgA ELISpot (n = 3). (D) Equal numbers of YFP-sorted wt, XBP-1 KO, and DKO MLN cells were metabolically labeled for 20 min with [35S]methionine and chased up to 4 h. Anti-Ig immunoprecipitation was performed. Synthesized Ig at the end of the pulse and secreted Ig after 4 h were quantified by using a phosphorimager (n = 3). Error bars indicate standard errors of the means (SEM).
Analysis of the supernatants for the content of IgA following APRIL stimulation showed that IgA levels were significantly higher for DKO than for XBP-1 KO cells, despite the reduction in total B cell numbers (Fig. 4B). This was supported by the results of an IgA ELISpot assay for YFP-sorted cells, which showed significantly higher numbers of DKO-derived than of XBP-1 KO-derived AFCs (Fig. 4C).
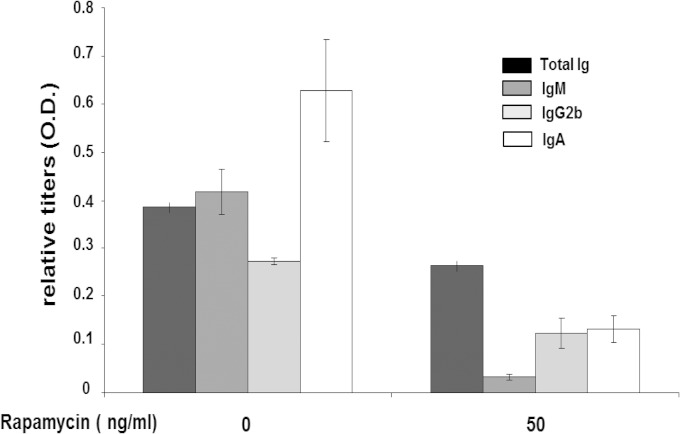
Because mTOR promotes protein synthesis utilizing various mechanisms, such as phosphorylation of 4E-BP and S6K1, the capacity of DKO cells to synthesize Ig molecules was compared to that of XBP-1 KO cells on a per-cell basis, using YFP-positive cells sorted at day 6. Equal numbers of YFP-sorted cells from wt, XBP-1 KO, and DKO mice were subjected to pulse labeling with [35S]methionine, followed by a chase period. We observed an increased synthesis of IgA heavy chains in DKO cells compared to that in XBP-1 KO cells, as well as higher levels of radioactive IgA in the supernatants (Fig. 4D). The addition of rapamycin in the last 24 h of culture strongly reduced IgA secretion from DKO cells (Fig. 5). Taking these results together, when XBP-1 is deleted, mTOR activation leads to a higher secretion of IgA and promotes differentiation into AFCs in vitro and in vivo.
FIG 5.
IgA secretion from DKO cells was reduced by rapamycin treatment. MLN cells from DKO/YFP mice were cultured in the presence of APRIL and 50 ng/ml of rapamycin for last 24 h of a 6-day culture, and the supernatants were analyzed by ELISA for the various Ig isotypes secreted since rapamycin addition (n = 4). Error bars indicate SEM.
mTOR activation increases IgA secretion, which may be, at least in part, a result of the abnormal B cell development rather than having a direct relation to specific elements in the IgA secretion process. We therefore tested whether knockout of TSC1 following B cell maturation also affects Ig synthesis and differentiation into PCs. We utilized the RERT strain, which, due to the knock-in of the Cre-ER fusion into the heavy subunit of RNA polymerase II, allows the activation of Cre by tamoxifen in all cell types (24). Mice with floxed XBP-1 or TSC1 or a combination of these mutations were crossed to the RERT strain (termed RERT/XBP-1flox/flox, RERT/TSC1flox/flox, and RERT/TSC1flox/flox/XBP-1flox/flox mice, respectively). Tamoxifen-treated XBP-1flox/flox mice were used as wt controls. Eight days after tamoxifen treatment, a period of time in which efficient deletion of the floxed genes was observed and no aberrations were seen for B cell development, splenic B cells were isolated and subjected to stimulation with LPS.
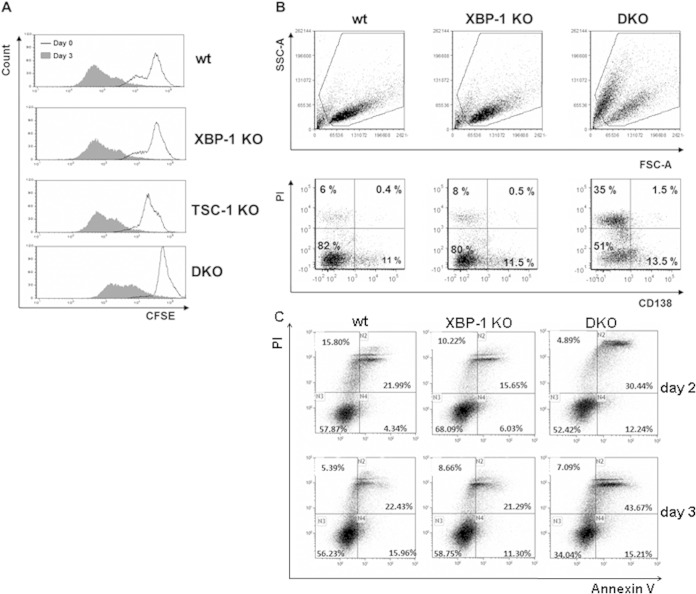
Deletion of TSC1 did not affect proliferation as determined by CFSE dilution analysis (Fig. 6A). However, cell viability was severely compromised by apoptosis in the DKO cells, as evident from their forward and side scatter properties and the accumulation of PI-positive, annexin V-positive cells (Fig. 6C). Importantly, when gated on the live cells, CD138 surface expression was enriched for the cells in which TSC1 was deleted (Fig. 6B).
FIG 6.
Deletion of TSC1 does not affect B cell proliferation but compromises viability following stimulation. (A) Splenic B cells were isolated a week after tamoxifen administration. Cells were labeled with CFSE; a portion were analyzed by flow cytometry, and the rest were treated for 3 days with LPS. Cells were then analyzed by flow cytometry using the same conditions. Cells were gated on live cells based on their side scatter and forward scatter (SSC/FSC) properties. (B) Splenic B cells were isolated from RERT wt, XBP-1 KO, and DKO mice 8 days after injection of tamoxifen. Cells were stimulated with LPS and analyzed on day 3 with propidium iodide (PI) and CD138 marker by flow cytometry. (C) day 2 and day 3 stimulated cells were stained with APC-labeled annexin V and PI. Shown are histograms typical of 3 to 5 independent experiments.
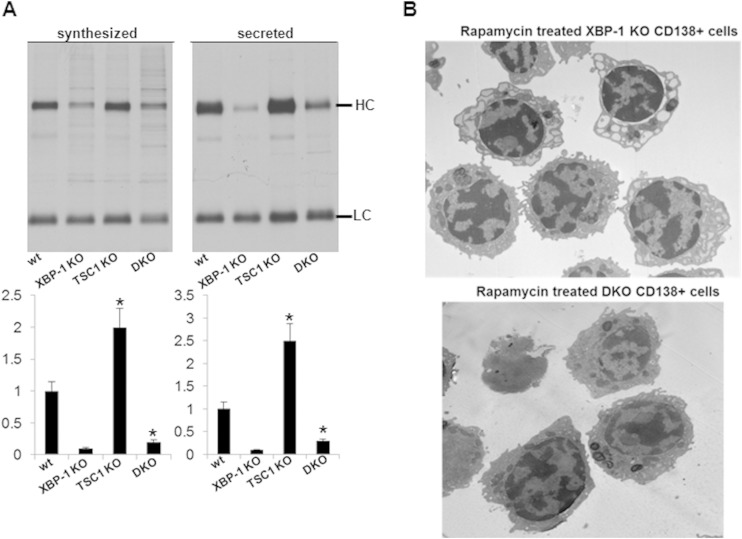
To examine whether TSC1 deletion also promotes Ig secretion in the context of splenic B cells ex vivo, day 3 LPS-stimulated cells were subjected to [35S]methionine pulse-chase analysis. In these experiments, we carefully labeled equal numbers of live cells to assess the cell secretion capacity at a base level. An increased production of IgM heavy chains was found for TSC1 KO cells relative to that in wt cells and for DKO cells relative to the level in XBP-1 KO cells. The differences were more pronounced for the secreted IgM, suggesting that mTOR activation also affects the efficiency of secretion (Fig. 7A). Together, these data demonstrate that mTORC1 activation provides a general enhancement of PC differentiation and confers induction of Ig synthesis and secretion.
FIG 7.
TSC1 deletion promotes Ig secretion and irreversibly corrects ER distensions. (A) IgM synthesis and secretion were determined in LPS-stimulated RERT wt, XBP-1 KO, and DKO cells by pulse-chase analysis. Shown are average densitometry measurements from 3 independent experiments. Error bars indicate SEM. Statistical significance was calculated by Student's t test, comparing results for TSC1 KO and wt cells and results for DKO and XBP-1 cells KO (*, P < 0.05). Error bars indicate SE. HC, heavy chain; LC, light chain. (B) Splenic B cells were isolated from XBP-1 KO and DKO mice. Cells were stimulated with LPS for 3 days. Rapamycin (100 ng/ml) was added between day 2 and day 3 of stimulation, and CD138-positive cells were isolated by magnetically activated cell sorting (MACS). Cells were analyzed by TEM.
We further utilized the tamoxifen-induced deletion model to assess whether the addition of rapamycin may reverse the ER distensions observed in LPS-induced plasmablasts generated from XBP-1-deficient B cells and whether rapamycin can enforce ER distensions in the DKO cells. B cells were isolated from the tamoxifen-induced XBP-1 KO or DKO animals and subjected to LPS stimulation. At day 2, rapamycin (100 ng/ml) was added for an additional 24 h. At day 3, CD138-positive cells were isolated by magnetic sorting and analyzed by TEM. We observed no significant effect of the rapamycin treatment with respect to ER morphology. Distensions of the ER were clearly seen in the XBP-1 KO cells, and normal morphology was maintained in the DKO cells (Fig. 7B). These data suggest that the pathology of the ER is generated in a plastic fashion early upon commitment to differentiation.
Ly6C is a target of mTOR in B cells and is involved in promoting IgA secretion in an XBP-1-independent mechanism.
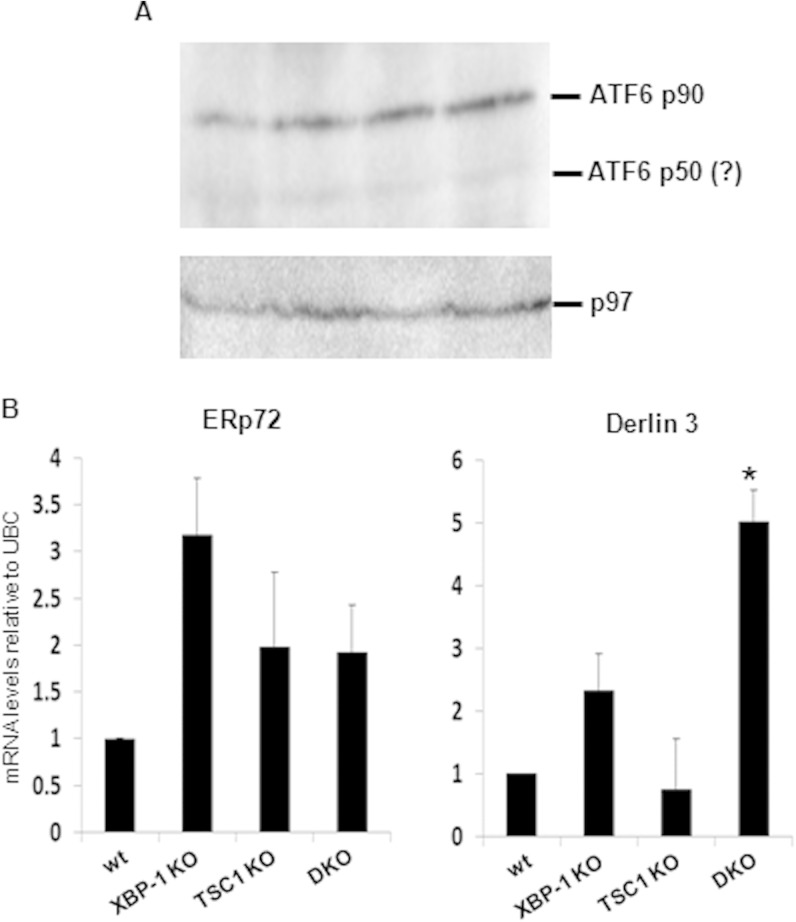
One possibility for the recovery of antibodies in the DKO animals may be an exaggerated signaling through compensatory UPR pathways, such as ATF6. Although the deletion of ATF6 had no effect on PC differentiation, induction, and activity (2), enforced ATF6 expression was demonstrated to promote ER expansion in XBP-1-deficient cells (25). To address this possibility, ATF6 expression levels and activity were assessed in the various types of plasmablasts. The full-length inactive ATF6 90-kDa protein was expressed at similar levels in all 4 types of PCs (Fig. 8A). The levels of the nuclear portion of ATF6 were below detection levels, probably because of its rapid turnover (26). Based on tunicamycin treatment of fibroblasts with or without deletion of ATF6, several ATF6 targets were described; at the top of the list were Derlin 3 and ERp72 (27). We therefore analyzed their mRNA levels by qPCR. Interestingly, Derlin 3 mRNA levels were enriched in the DKO cells relative to their levels in all other cell types. Analysis of the same samples for ERp72 did not indicate a significant difference (Fig. 8B). These results suggest that UPR targets undergo modulation in their activities when mTOR is overactivated. However, the contribution of ATF6 to this modulation is not clear.
FIG 8.
Derlin 3 but not ERp72 is induced in DKO plasmablasts. Splenic B cells of wt, RERT/XBP-1flox/flox, RERT/TSC1flox/flox, and RERT/DKO mice were isolated a week after tamoxifen administration. Cells were cultured in the presence of LPS for 3 days and then harvested for protein and mRNA analyses. (A) Expression of ATF6 in total cell extracts. The immunoblot shown is typical of three independent extractions. No significant difference in full-length ATF6 expression is seen between the various genotypes. (B) qPCR analysis of mRNA levels of ERp72 and Derlin 3 relative to ubiquitin C (UBC). Shown is the average of three independent extractions. Error bars represent standard deviations. *, P < 0.05 (DKO versus XBP-1 KO).
As addressed above, mTOR may influence PC development and function directly, by enhancing Ig synthesis and/or inhibiting degradative pathways likeautophagy (28), or indirectly, by promoting the expression of molecules that signal for enhanced PC differentiation. We reasoned that the direct effect of mTOR on protein synthesis cannot fully explain the increased expression of CD138 in the TSC1 KO cells and the higher number of PCs, suggesting that mTOR integrates signals into the physiological PC program. Initial studies looking at LC3-I and LC3-II ratios and p62 expression levels as indicators for inhibition of autophagy by the TSC1 KO did not indicate a significant difference at the late times after LPS stimulation of splenic cells (not shown). This further suggests that mTOR affects the PC program directly.
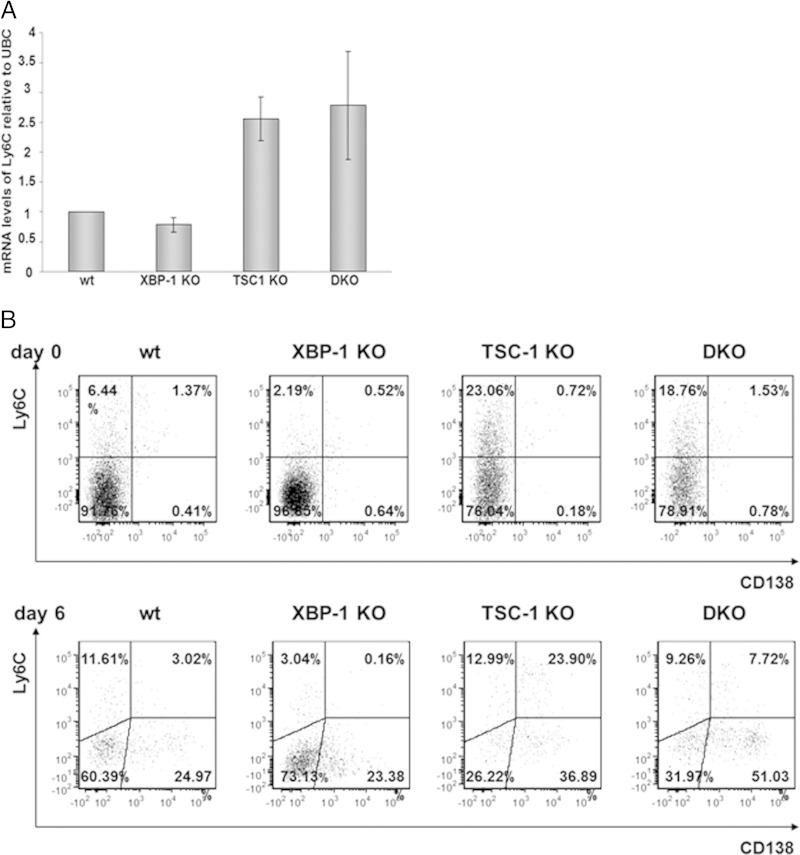
Ly6C is typically expressed on neutrophils, monocytes, a subset of T cells, and NK cells (29). In the B cell lineage, Ly6C expression is elevated in PCs. Although extensive characterization was not done, the highest expression was documented for IgA-secreting PCs (30). We therefore assessed the expression of Ly6C in the various mice. Quantitative PCR analysis of day 6 APRIL-stimulated, YFP-sorted MLN B cells revealed a 2.5-fold higher Ly6C mRNA level in DKO cells than in XBP-1 KO cells (Fig. 9A). As evident from the results shown in Fig. 9B, MLN cells of TSC1 KO and DKO mice contain fewer YFP-positive B cells than MLN cells of wt or XBP-1 KO mice. Moreover, upon stimulation with APRIL, the percentages of YFP-positive cells among TSC1 KO and DKO MLN cells drop further. Analysis of the remaining cells for surface expression of Ly6C demonstrated a strong increase on TSC1 KO and DKO YFP+ MLN B cells relative to the levels of expression on wt and XBP-1 KO MLN B cells, indicating that mTOR activation by a still-unknown mechanism alters the PC program.
FIG 9.
mTOR promotes Ly6C expression in MLN B cells. (A) MLN cells of wt, XBP-1 KO, TSC-1 KO, and DKO YFP mice, stimulated for 6 days with APRIL, were sorted for YFP, and Ly6C mRNA levels were analyzed by quantitative PCR. Error bars represent standard deviations. (B) MLN cells of wt/YFP, XBP-1 KO/YFP, TSC-1 KO/YFP, and DKO/YFP mice were gated on YFP and analyzed for Ly6C and CD138 markers on day 0 and day 6 after APRIL treatment.
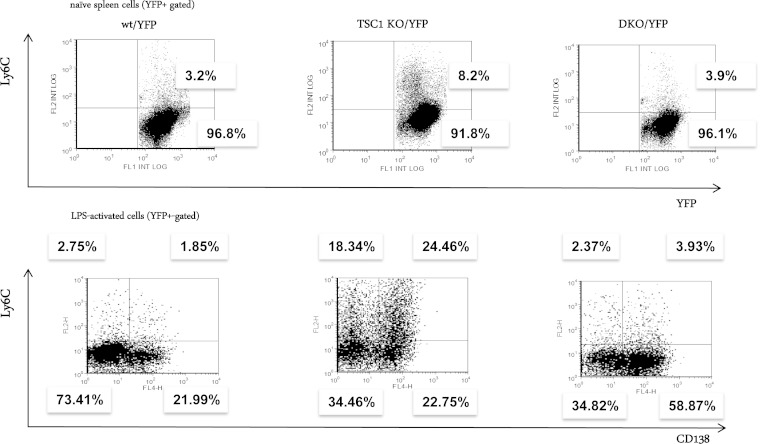
To explore whether Ly6C represents a general target of mTOR, we isolated splenic B cells from wt/YFP, TSC1/YFP, and DKO/YFP mice and measured surface Ly6C on YFP-positive cells. Ly6C was highly enriched only in TSC1 KO splenic B cells. Further enrichment was observed following LPS stimulation (Fig. 10), indicating Ly6C as a general target of mTOR. However, in contrast to MLN cells, the expression of Ly6C in splenic B cells was largely dependent on XBP-1. As was observed for the ER morphology, the inclusion of rapamycin in the 24 h of culture did not affect mRNA levels of Ly6C and did not affect the surface expression of the derived molecule.
FIG 10.
mTOR promotes Ly6C expression in naive and activated splenic B cells in an XBP-1-dependent manner. Splenic B cells were isolated from the YFP strains and stimulated with LPS for up to 3 days. Flow cytometry analysis was performed at day 0 and at day 3 for analysis of Ly6C expression on naive B cells and on PCs. The results shown are typical of three independent experiments.
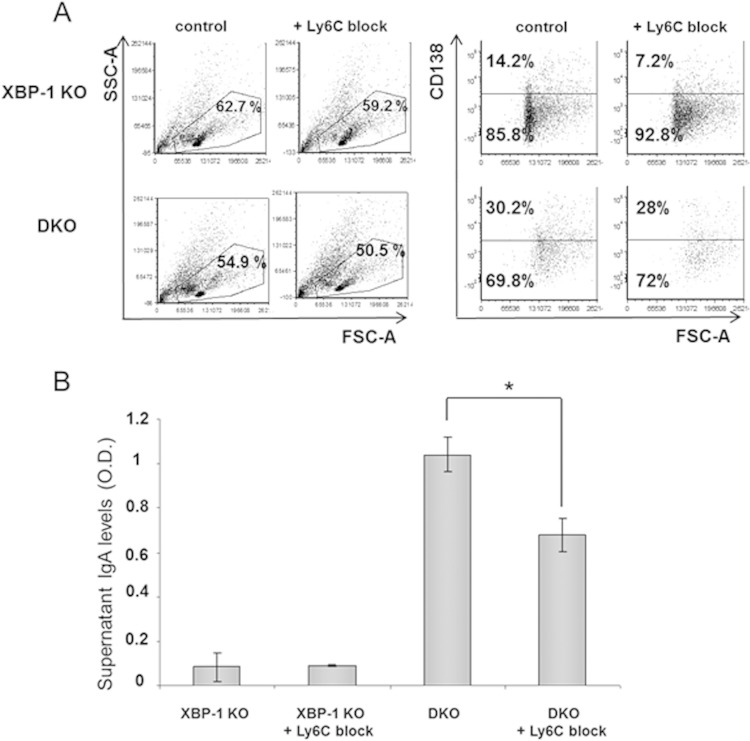
To assess whether Ly6C indeed plays a role in PC differentiation and in IgA secretion from the DKO cells, a blocking antibody to Ly6C was added to MLN cultures. This did not significantly affect the proportion of PCs as determined by CD138 staining. However, IgA secretion was reduced by 35% in DKO B cells without affecting overall B cell viability (Fig. 11A and B). Our data indicate that activation of mTORC1 by TSC1 deletion compromises B cell viability when cells are stimulated to become AFCs. However, cells that endure the process display a better secretory capacity. This is due in part to elevated Ig synthesis and in part to the expression of specific elements in the PC program, such as Ly6C. Strikingly, these activities do not require the IRE1/XBP-1 arm of the UPR.
FIG 11.
Block of Ly6C reduces IgA secretion from DKO cells. (A) MLN cells of XBP-1 KO/YFP and DKO/YFP mice were cultivated with APRIL in the presence and absence of a Ly6C blocking antibody. On day 6, cells were assessed for PCs by CD138 staining (histograms show results of gating on YFP+ cells). (B) Culture supernatants were analyzed for IgA levels by ELISA (n = 3). Error bars indicate SEM. Statistical significance was calculated by Student's t test, comparing results for DKO cells with antibody to results for the control (*, P < 0.05).
DISCUSSION
Cellular energetics plays important roles in immune cell function. Rapid proliferation in response to pathogens and acquisition of effector functions often require metabolic adaptation. As the mTOR pathway plays key roles in regulating cellular metabolism, it is not surprising, therefore, that deletion of one of its inhibitory molecules, TSC1 or TSC2, was found to affect various types of immune cells, primarily in response to stimulations. For instance, in the T cell lineage, TSC1 deletion in naive T cells confers cell quiescence (31). Differentiation of Foxp3-positive regulatory T cells is enhanced (32), and so is the differentiation of Th1 and Th17 cells (33). Interestingly, only some of these effects are reversed by rapamycin, suggesting that TSC deficiency irreversibly alters cell fate. Phenotypes attributed to TSC1 loss in the myeloid lineage are related to cell plasticity, either of dendritic cells (34) or macrophages (19). In the B cell lineage, TSC1 deletion partially impairs the transition from immature to mature cells and diverts mature B cells from the marginal zone subset (17).
Gene expression profiling in B cells overexpressing Blimp-1 or XBP-1 ascribed to the UPR a major role in adapting the secretory pathway of PCs for Ig secretion (35). However, accompanying proteomic analyses of LPS-driven PC differentiation demonstrated an early increase in metabolic demand and energy production, even before ER proteins were induced (36, 37). This suggests that PC differentiation occurs in waves in which ER modulation is a late event. The mechanisms that control the early metabolic wave of PC differentiation are not known but are most likely related to the PI3K pathway that is essential for B cell survival (38). In particular, the significance of mTOR in this process remains unclear.
Here, we showed that mTOR activation promotes the differentiation of PCs in naive mice. UPR and mTOR cross-regulate each other. Utilizing the DKO mice, in which exaggerated mTOR operates under handicapped UPR (Fig. 1), we demonstrated a positive effect of mTOR on B cell secretory functions independent of XBP-1. This indicates that the UPR and mTOR programs have shared but also separate components to promote protein secretion (Fig. 2). Not only did mTOR enrich the accumulation of PCs in vivo, it also enhanced the secretory capacity of PCs at the cellular level ex vivo. This was particularly evident on the background of XBP-1 deficiency (Fig. 4 to 7).
Rapamycin treatment is often used to demonstrate the specificity of the mTOR function in a specific process, and when it reverses the phenotype of compromised TSC activity, it serves as a nice loss-of-function, gain-of-function control. However, in particular cases, manifested primarily for immune cells, rapamycin does not always reverse the TSC KO phenotype (32). This is due to plastic changes that occur early upon activation. In addition, the fact that rapamycin affects B cell proliferation, as was also demonstrated for raptor and mTOR B cell-specific KO, means that it causes impairment in their differentiation into PCs. Therefore, treatment with rapamycin was confined to the last stages of PC differentiation. In our system, rapamycin treatment did not significantly affect the morphology of the ER in either XBP-1 KO or DKO LPS-induced plasmablasts (Fig. 7B). It did reduce their productivity, probably through its effect on protein synthesis (Fig. 5).
While the information that links mTOR to cell proliferation, metabolism, and protein translation has been extensively studied (39), less is known about the role mTOR plays in regulating transcription. Because mTOR is a kinase which feeds to many signaling pathways either directly or indirectly, the transcription component of its activity may be cell specific, just like the UPR. Utilizing mouse models of mTOR gain of function accompanied by loss-of-function studies with mTOR-specific inhibitors and the dissection of UPR-dependent and -independent analyses, it should be feasible to decipher the transcription elements of this program. This may have a direct relevance to immunity and to cancers of the B cell lineage, which often find strategies to activate the PI3K/AKT/mTOR pathway (40).
Activation of the mTOR in an XBP-1-deficient background may trigger compensatory UPR activities that under normal conditions are not engaged. We sought to assess whether ATF6 might be overutilized. ATF6 operates in heterodimers; a prominent one is with XBP-1 itself (41). Thus, its functions are dynamic and rely on its interaction partners. We did observe that the mRNA level of one of its more specific targets, Derlin 3, is enhanced, while the mRNA level of another, ERp72, is not altered (Fig. 8). The generation of a TSC1/XBP-1/ATF6 triple KO would provide the definitive answer to the contribution of ATF6.
Based on the hypothesis that mTOR controls a program for PC development, as manifested by the increase propensity of B cells to become PCs in vivo and in vitro, we searched for molecules that may facilitate Ig secretion downstream from mTOR activation. This led us to the identification of Ly6C as an mTOR-regulated gene in B cells. Interestingly, splenic TSC1 KO B cells stimulated by LPS differentiated into Ly6C-positive and -negative PCs in an approximately 1:1 ratio. In monocytes, the expression of Ly6C is associated with a proinflammatory phenotype and is connected to a repertoire of cytokines and chemokines (42). In analogy to monocytes, it is tempting to speculate that Ly6C reports a proinflammatory program also in PCs, rather than being expressed stochastically on metabolically hyperactive cells. If so, inflammation may be controlled metabolically in a much profound manner and, thus, can be manipulated more specifically than by mTOR inhibitors.
The deployment of Ly6C to the cell surface of activated splenic cells was completely dependent on XBP-1. It is unlikely that Ly6C is as a direct target of XBP-1. Rather, we speculate that when the process of PC differentiation is strong and fast, as governed by LPS stimulation, intact UPR is most likely needed to allow the differentiation of Ly6C-positive PCs (Fig. 10). However, when the process of PC differentiation is slower and less robust, as promoted by APRIL, the requirement for XBP-1 is less stringent (Fig. 9). As was seen for ER morphology, rapamycin treatment did not affect the mRNA levels of Ly6C or its surface expression in TSC1 KO cells (not shown). This suggests that the control of Ly6C transcription may be dependent on the differentiation state.
Why is IgA the major isotype elevated in DKO mice? Ex vivo activation of mTOR uniformly increases the synthesis of all Ig isotypes (Fig. 2 and 5). Therefore, we think that the bias to IgA is a result of the effects mTOR has on early B cell development. In addition to the lack of MZ B cells, a major source of IgM-secreting PCs, in TSC1 KO mice, the B cell numbers were reduced in the peripheral lymph nodes of DKO mice relative to the numbers in wt mice. In contrast, the percentage of B cells in the MLN was normal (not shown).
The exact triggers that promote the UPR in the course of B cell-to-PC transition are not clear. While initially the UPR was thought to be induced due to the ramping up of secretory μ synthesis in a manner that stresses the ER (4), B cells that have the μs deleted activate the UPR normally in response to LPS stimulation (20). Whether lipid composition is the trigger for ER stress in developing PCs, as was demonstrated in the context of obesity, has not been studied in B cells (43). It may very well be that cellular metabolism, including the mTOR pathway as a key regulator thereof, is an integral part of the PC differentiation process and an instigator of UPR. Because the mTOR pathway affects several checkpoints in B cell development, including germinal center reaction and isotype switching (44, 45), it is difficult to directly stratify the specific roles of mTOR in remodeling the secretory machinery of PCs. We suggest that ex vivo manipulation of the mTOR either genetically or pharmacologically at the very last stages of PC differentiation should allow these confounding factors to be overcome and help to delineate this alternative program for generating PCs.
ACKNOWLEDGMENTS
Research was funded by grants from the David R. Bloom Center for Pharmacy, the Dr. Adolph and Klara Brettler Center for Research in Pharmacology, the Rosetrees Trust, Israeli Cancer Association, Israeli Multiple Myeloma Fund, and the Israel Science Foundation (grant no. 696/14) to B.T. S.B. is a recipient of the Lady Davis Fund postdoctoral fellowship.
REFERENCES
- 1.Ron D, Walter P. 2007. Signal integration in the endoplasmic reticulum unfolded protein response. Nat Rev Mol Cell Biol 8:519–529. doi: 10.1038/nrm2199. [DOI] [PubMed] [Google Scholar]
- 2.Aragon IV, Barrington RA, Jackowski S, Mori K, Brewer JW. 2012. The specialized unfolded protein response of B lymphocytes: ATF6alpha-independent development of antibody-secreting B cells. Mol Immunol 51:347–355. doi: 10.1016/j.molimm.2012.04.001. [DOI] [PMC free article] [PubMed] [Google Scholar]
- 3.Gass JN, Jiang HY, Wek RC, Brewer JW. 2008. The unfolded protein response of B-lymphocytes: PERK-independent development of antibody-secreting cells. Mol Immunol 45:1035–1043. doi: 10.1016/j.molimm.2007.07.029. [DOI] [PMC free article] [PubMed] [Google Scholar]
- 4.Iwakoshi NN, Lee AH, Vallabhajosyula P, Otipoby KL, Rajewsky K, Glimcher LH. 2003. Plasma cell differentiation and the unfolded protein response intersect at the transcription factor XBP-1. Nat Immunol 4:321–329. doi: 10.1038/ni907. [DOI] [PubMed] [Google Scholar]
- 5.Taubenheim N, Tarlinton DM, Crawford S, Corcoran LM, Hodgkin PD, Nutt SL. 2012. High rate of antibody secretion is not integral to plasma cell differentiation as revealed by XBP-1 deficiency. J Immunol 189:3328–3338. doi: 10.4049/jimmunol.1201042. [DOI] [PubMed] [Google Scholar]
- 6.Tirosh B, Iwakoshi NN, Glimcher LH, Ploegh HL. 2005. XBP-1 specifically promotes IgM synthesis and secretion, but is dispensable for degradation of glycoproteins in primary B cells. J Exp Med 202:505–516. doi: 10.1084/jem.20050575. [DOI] [PMC free article] [PubMed] [Google Scholar]
- 7.Benhamron S, Hadar R, Iwawaky T, So JS, Lee AH, Tirosh B. 2014. Regulated IRE1-dependent decay participates in curtailing immunoglobulin secretion from plasma cells. Eur J Immunol 44:867–876. doi: 10.1002/eji.201343953. [DOI] [PubMed] [Google Scholar]
- 8.Sarbassov DD, Ali SM, Sengupta S, Sheen JH, Hsu PP, Bagley AF, Markhard AL, Sabatini DM. 2006. Prolonged rapamycin treatment inhibits mTORC2 assembly and Akt/PKB. Mol Cell 22:159–168. doi: 10.1016/j.molcel.2006.03.029. [DOI] [PubMed] [Google Scholar]
- 9.Sengupta S, Peterson TR, Sabatini DM. 2010. Regulation of the mTOR complex 1 pathway by nutrients, growth factors, and stress. Mol Cell 40:310–322. doi: 10.1016/j.molcel.2010.09.026. [DOI] [PMC free article] [PubMed] [Google Scholar]
- 10.Kamada Y, Funakoshi T, Shintani T, Nagano K, Ohsumi M, Ohsumi Y. 2000. Tor-mediated induction of autophagy via an Apg1 protein kinase complex. J Cell Biol 150:1507–1513. doi: 10.1083/jcb.150.6.1507. [DOI] [PMC free article] [PubMed] [Google Scholar]
- 11.Menon S, Manning BD. 2008. Common corruption of the mTOR signaling network in human tumors. Oncogene 27(Suppl 2):S43–S51. doi: 10.1038/onc.2009.352. [DOI] [PMC free article] [PubMed] [Google Scholar]
- 12.Powell JD, Delgoffe GM. 2010. The mammalian target of rapamycin: linking T cell differentiation, function, and metabolism. Immunity 33:301–311. doi: 10.1016/j.immuni.2010.09.002. [DOI] [PMC free article] [PubMed] [Google Scholar]
- 13.Donahue AC, Fruman DA. 2007. Distinct signaling mechanisms activate the target of rapamycin in response to different B-cell stimuli. Eur J Immunol 37:2923–2936. doi: 10.1002/eji.200737281. [DOI] [PubMed] [Google Scholar]
- 14.Ozcan U, Ozcan L, Yilmaz E, Duvel K, Sahin M, Manning BD, Hotamisligil GS. 2008. Loss of the tuberous sclerosis complex tumor suppressors triggers the unfolded protein response to regulate insulin signaling and apoptosis. Mol Cell 29:541–551. doi: 10.1016/j.molcel.2007.12.023. [DOI] [PMC free article] [PubMed] [Google Scholar]
- 15.Weichhart T, Costantino G, Poglitsch M, Rosner M, Zeyda M, Stuhlmeier KM, Kolbe T, Stulnig TM, Horl WH, Hengstschlager M, Muller M, Saemann MD. 2008. The TSC-mTOR signaling pathway regulates the innate inflammatory response. Immunity 29:565–577. doi: 10.1016/j.immuni.2008.08.012. [DOI] [PubMed] [Google Scholar]
- 16.Goldfinger M, Shmuel M, Benhamron S, Tirosh B. 2011. Protein synthesis in plasma cells is regulated by crosstalk between endoplasmic reticulum stress and mTOR signaling. Eur J Immunol 41:491–502. doi: 10.1002/eji.201040677. [DOI] [PubMed] [Google Scholar]
- 17.Benhamron S, Tirosh B. 2011. Direct activation of mTOR in B lymphocytes confers impairment in B-cell maturation and loss of marginal zone B cells. Eur J Immunol 41:2390–2396. doi: 10.1002/eji.201041336. [DOI] [PubMed] [Google Scholar]
- 18.Basarir T, Schwingshandl J, Borkenstein M, Rosegger H, Fueger GF. 1991. Normal values for free thyroxine, free triiodothyronine, reverse triiodothyronine, thyrotropin, thyroglobulin and thyroxine-binding globulin in umbilical cord blood of healthy mature newborn infants. Padiatr Padol 26:93–95. (In German.) [PubMed] [Google Scholar]
- 19.Byles V, Covarrubias AJ, Ben-Sahra I, Lamming DW, Sabatini DM, Manning BD, Horng T. 2013. The TSC-mTOR pathway regulates macrophage polarization. Nat Commun 4:2834. doi: 10.1038/ncomms3834. [DOI] [PMC free article] [PubMed] [Google Scholar]
- 20.Hu CC, Dougan SK, McGehee AM, Love JC, Ploegh HL. 2009. XBP-1 regulates signal transduction, transcription factors and bone marrow colonization in B cells. EMBO J 28:1624–1636. doi: 10.1038/emboj.2009.117. [DOI] [PMC free article] [PubMed] [Google Scholar]
- 21.Kang YJ, Lu MK, Guan KL. 2011. The TSC1 and TSC2 tumor suppressors are required for proper ER stress response and protect cells from ER stress-induced apoptosis. Cell Death Differ 18:133–144. doi: 10.1038/cdd.2010.82. [DOI] [PMC free article] [PubMed] [Google Scholar]
- 22.Moser K, Muehlinghaus G, Manz R, Mei H, Voigt C, Yoshida T, Dorner T, Hiepe F, Radbruch A. 2006. Long-lived plasma cells in immunity and immunopathology. Immunol Lett 103:83–85. doi: 10.1016/j.imlet.2005.09.009. [DOI] [PubMed] [Google Scholar]
- 23.Tezuka H, Abe Y, Asano J, Sato T, Liu J, Iwata M, Ohteki T. 2011. Prominent role for plasmacytoid dendritic cells in mucosal T cell-independent IgA induction. Immunity 34:247–257. doi: 10.1016/j.immuni.2011.02.002. [DOI] [PubMed] [Google Scholar]
- 24.Mijimolle N, Velasco J, Dubus P, Guerra C, Weinbaum CA, Casey PJ, Campuzano V, Barbacid M. 2005. Protein farnesyltransferase in embryogenesis, adult homeostasis, and tumor development. Cancer Cell 7:313–324. doi: 10.1016/j.ccr.2005.03.004. [DOI] [PubMed] [Google Scholar]
- 25.Bommiasamy H, Back SH, Fagone P, Lee K, Meshinchi S, Vink E, Sriburi R, Frank M, Jackowski S, Kaufman RJ, Brewer JW. 2009. ATF6alpha induces XBP1-independent expansion of the endoplasmic reticulum. J Cell Sci 122:1626–1636. doi: 10.1242/jcs.045625. [DOI] [PMC free article] [PubMed] [Google Scholar]
- 26.Thuerauf DJ, Morrison LE, Hoover H, Glembotski CC. 2002. Coordination of ATF6-mediated transcription and ATF6 degradation by a domain that is shared with the viral transcription factor, VP16. J Biol Chem 277:20734–20739. doi: 10.1074/jbc.M201749200. [DOI] [PubMed] [Google Scholar]
- 27.Wu J, Rutkowski DT, Dubois M, Swathirajan J, Saunders T, Wang J, Song B, Yau GD, Kaufman RJ. 2007. ATF6alpha optimizes long-term endoplasmic reticulum function to protect cells from chronic stress. Dev Cell 13:351–364. doi: 10.1016/j.devcel.2007.07.005. [DOI] [PubMed] [Google Scholar]
- 28.Pengo N, Scolari M, Oliva L, Milan E, Mainoldi F, Raimondi A, Fagioli C, Merlini A, Mariani E, Pasqualetto E, Orfanelli U, Ponzoni M, Sitia R, Casola S, Cenci S. 2013. Plasma cells require autophagy for sustainable immunoglobulin production. Nat Immunol 14:298–305. doi: 10.1038/ni.2524. [DOI] [PubMed] [Google Scholar]
- 29.Lee PY, Wang JX, Parisini E, Dascher CC, Nigrovic PA. 2013. Ly6 family proteins in neutrophil biology. J Leukoc Biol 94:585–594. doi: 10.1189/jlb.0113014. [DOI] [PubMed] [Google Scholar]
- 30.Wrammert J, Kallberg E, Agace WW, Leanderson T. 2002. Ly6C expression differentiates plasma cells from other B cell subsets in mice. Eur J Immunol 32:97–103. doi:. [DOI] [PubMed] [Google Scholar]
- 31.Yang K, Neale G, Green DR, He W, Chi H. 2011. The tumor suppressor Tsc1 enforces quiescence of naive T cells to promote immune homeostasis and function. Nat Immunol 12:888–897. doi: 10.1038/ni.2068. [DOI] [PMC free article] [PubMed] [Google Scholar]
- 32.Chen H, Zhang L, Zhang H, Xiao Y, Shao L, Li H, Yin H, Wang R, Liu G, Corley D, Yang Z, Zhao Y. 2013. Disruption of TSC1/2 signaling complex reveals a checkpoint governing thymic CD4+ CD25+ Foxp3+ regulatory T-cell development in mice. FASEB J 27:3979–3990. doi: 10.1096/fj.13-235408. [DOI] [PubMed] [Google Scholar]
- 33.Park Y, Jin HS, Lopez J, Elly C, Kim G, Murai M, Kronenberg M, Liu YC. 2013. TSC1 regulates the balance between effector and regulatory T cells. J Clin Invest 123:5165–5178. doi: 10.1172/JCI69751. [DOI] [PMC free article] [PubMed] [Google Scholar]
- 34.Wang Y, Huang G, Zeng H, Yang K, Lamb RF, Chi H. 2013. Tuberous sclerosis 1 (Tsc1)-dependent metabolic checkpoint controls development of dendritic cells. Proc Natl Acad Sci U S A 110:E4894–E4903. doi: 10.1073/pnas.1308905110. [DOI] [PMC free article] [PubMed] [Google Scholar]
- 35.Shaffer AL, Shapiro-Shelef M, Iwakoshi NN, Lee AH, Qian SB, Zhao H, Yu X, Yang L, Tan BK, Rosenwald A, Hurt EM, Petroulakis E, Sonenberg N, Yewdell JW, Calame K, Glimcher LH, Staudt LM. 2004. XBP1, downstream of Blimp-1, expands the secretory apparatus and other organelles, and increases protein synthesis in plasma cell differentiation. Immunity 21:81–93. doi: 10.1016/j.immuni.2004.06.010. [DOI] [PubMed] [Google Scholar]
- 36.van Anken E, Romijn EP, Maggioni C, Mezghrani A, Sitia R, Braakman I, Heck AJ. 2003. Sequential waves of functionally related proteins are expressed when B cells prepare for antibody secretion. Immunity 18:243–253. doi: 10.1016/S1074-7613(03)00024-4. [DOI] [PubMed] [Google Scholar]
- 37.Vettermann C, Castor D, Mekker A, Gerrits B, Karas M, Jack HM. 2011. Proteome profiling suggests a pro-inflammatory role for plasma cells through release of high-mobility group box 1 protein. Proteomics 11:1228–1237. doi: 10.1002/pmic.201000491. [DOI] [PubMed] [Google Scholar]
- 38.Srinivasan L, Sasaki Y, Calado DP, Zhang B, Paik JH, DePinho RA, Kutok JL, Kearney JF, Otipoby KL, Rajewsky K. 2009. PI3 kinase signals BCR-dependent mature B cell survival. Cell 139:573–586. doi: 10.1016/j.cell.2009.08.041. [DOI] [PMC free article] [PubMed] [Google Scholar]
- 39.Dowling RJ, Topisirovic I, Fonseca BD, Sonenberg N. 2010. Dissecting the role of mTOR: lessons from mTOR inhibitors. Biochim Biophys Acta 1804:433–439. doi: 10.1016/j.bbapap.2009.12.001. [DOI] [PubMed] [Google Scholar]
- 40.Janes MR, Limon JJ, So L, Chen J, Lim RJ, Chavez MA, Vu C, Lilly MB, Mallya S, Ong ST, Konopleva M, Martin MB, Ren P, Liu Y, Rommel C, Fruman DA. 2010. Effective and selective targeting of leukemia cells using a TORC1/2 kinase inhibitor. Nat Med 16:205–213. doi: 10.1038/nm.2091. [DOI] [PMC free article] [PubMed] [Google Scholar]
- 41.Lee K, Tirasophon W, Shen X, Michalak M, Prywes R, Okada T, Yoshida H, Mori K, Kaufman RJ. 2002. IRE1-mediated unconventional mRNA splicing and S2P-mediated ATF6 cleavage merge to regulate XBP1 in signaling the unfolded protein response. Genes Dev 16:452–466. doi: 10.1101/gad.964702. [DOI] [PMC free article] [PubMed] [Google Scholar]
- 42.Zigmond E, Varol C, Farache J, Elmaliah E, Satpathy AT, Friedlander G, Mack M, Shpigel N, Boneca IG, Murphy KM, Shakhar G, Halpern Z, Jung S. 2012. Ly6C hi monocytes in the inflamed colon give rise to proinflammatory effector cells and migratory antigen-presenting cells. Immunity 37:1076–1090. doi: 10.1016/j.immuni.2012.08.026. [DOI] [PubMed] [Google Scholar]
- 43.Fu S, Yang L, Li P, Hofmann O, Dicker L, Hide W, Lin X, Watkins SM, Ivanov AR, Hotamisligil GS. 2011. Aberrant lipid metabolism disrupts calcium homeostasis causing liver endoplasmic reticulum stress in obesity. Nature 473:528–531. doi: 10.1038/nature09968. [DOI] [PMC free article] [PubMed] [Google Scholar]
- 44.Lee K, Heffington L, Jellusova J, Nam KT, Raybuck A, Cho SH, Thomas JW, Rickert RC, Boothby M. 2013. Requirement for Rictor in homeostasis and function of mature B lymphoid cells. Blood 122:2369–2379. doi: 10.1182/blood-2013-01-477505. [DOI] [PMC free article] [PubMed] [Google Scholar]
- 45.Keating R, Hertz T, Wehenkel M, Harris TL, Edwards BA, McClaren JL, Brown SA, Surman S, Wilson ZS, Bradley P, Hurwitz J, Chi H, Doherty PC, Thomas PG, McGargill MA. 2013. The kinase mTOR modulates the antibody response to provide cross-protective immunity to lethal infection with influenza virus. Nat Immunol 14:1266–1276. doi: 10.1038/ni.2741. [DOI] [PMC free article] [PubMed] [Google Scholar]
- 46.National Institutes of Health. 1985. Principles of laboratory animal care. NIH publication 85-23. National Institutes of Health, Bethesda, MD. [Google Scholar]


