

Efforts to reduce unexpected hospitalizations and employment disruptions by providing more comprehensive supportive care for pediatric patients with cancer could help ease families' financial burden.
Abstract
Purpose:
Cancer treatment may cause financial stress for pediatric oncology patients and their families. We evaluated pediatric cancer caregivers' perceived financial burden related to socioeconomic factors (eg, parental employment) and health care use factors (eg, unexpected hospitalizations).
Methods:
A single-site, cross-sectional survey of primary caretakers of patients with childhood cancer was performed from July 2010 to July 2012. Eligible patients were treated at a pediatric cancer hospital, diagnosed at age ≤ 21 years and were ≤ 5 years from diagnosis (N = 254). Financial burden was rated on a visual analog scale of 0 to 100. Multivariable linear regression models were used to calculate coefficients and 95% CIs of financial burden by time since diagnosis.
Results:
Mean age at diagnosis was 6.8 years (SD = 5.5 years), and average time since diagnosis was 1.6 years (SD = 1.4 years). The most common diagnosis was leukemia (41.9%). When adjusted for sex, age at diagnosis, insurance status, and rural residence, caregivers whose child was 1 to 5 years from diagnosis with ≥ 5 unexpected hospitalizations experienced 24.9 (95% CI, 9.1 to 40.7; P < .01) points higher financial burden than those with no unexpected hospitalizations. In addition, when compared with families without employment disruptions, families of children 1 to 5 years from diagnosis in which a caregiver had quit or changed jobs reported 13.4 (95% CI, 3.2 to 23.6; P = .01) points higher financial burden.
Conclusions:
Efforts to reduce unexpected hospitalizations and employment disruptions by providing more comprehensive supportive care for pediatric patients with cancer could help ease families' financial burden.
Introduction
In 2014, the American Cancer Society estimates that almost 16,000 children (age birth to 19 years) will be diagnosed with cancer in the United States.1 Fortunately, as a result of improved therapies, survival among pediatric cancer patients is high, with more than 80% living beyond 5 years from diagnosis.2 However, life-saving cancer therapy is costly and may result in financial burden for these patients' families. In 2009, pediatric cancer hospitalization cost in the United States averaged $40,400, nearly five times higher than hospitalization for any other pediatric condition ($8,100). The greatest costs were for leukemia ($55,700) and non-Hodgkin lymphoma ($46,900).3 These high costs may be driven by unexpected procedures during cancer treatment, including treatment of infections,4 pain, septicemia,5 and dehydration, which often require additional hospitalizations.
Primary Children's Hospital (PCH) in Salt Lake City, Utah serves a broad catchment area in the continental United States, spanning Utah, Nevada, Montana, Idaho, New Mexico and Wyoming. Because it is the only pediatric hospital in the Intermountain West, PCH patients may face substantial out-of-pocket costs related to travel for their care, including expenses for hotels or transportation. While some studies demonstrate high out-of-pocket costs for pediatric cancer in other countries,6,7 few data exist regarding the financial burden for families of US pediatric patients with cancer.
To further understand the economic impact of pediatric cancer on families during the first 5 years after diagnosis, we surveyed patient caregivers from PCH to assess their perceptions of the financial burden of cancer. We hypothesized that caregivers who reported unexpected hospitalizations and other burdensome health care experiences (eg, emergency travel by ambulance) would report greater perceived financial burden. We also evaluated the role of socioeconomic factors on financial burden.
Methods
This analysis was part of a larger study on pediatric cancer care from the perspective of the primary caregiver at PCH. Approval for this research was obtained from the institutional review boards at the University of Utah and PCH.
Participants and Recruitment
Eligible patients were diagnosed with cancer between ages 0 to 21 years, were ≥ 2 months past diagnosis, and were seen in the Pediatric Hematology-Oncology outpatient clinic of PCH from July 2010 to July 2012. Caregivers of eligible patients completed an informed consent form and survey. Partially completed surveys were sent home with the caregiver and returned at the next clinic visit. Of 403 English-speaking caregivers approached to participate, 310 completed a survey (response rate = 77%).
For the current article, our sample was limited to patients who were ≤ 5 years from diagnosis, as 5 years is typically when treatment/active surveillance ends and patients transition to long-term follow-up and monitoring for sequelae. We excluded n = 23 participants who were missing time since diagnosis and n = 28 participants who were > 5 years past diagnosis. In addition, n = 2 uninsured participants were excluded. Financial burden, our primary outcome of interest, was missing for n = 3 participants. Our final sample size was N = 254.
Measures and Data Analysis
We used a 48-item survey to evaluate the burden of cancer care, demographics, and the patients' clinical course. Our primary outcome of interest (perceived financial burden) and our independent variables are described below.
Financial burden outcome.
Participants were asked the following question to assess financial burden: “Using the scale below, how much of a financial burden has your child's cancer treatment been on your household?” Financial burden was measured on a visual analog scale ranging from no burden (0) to very large burden (100).
Patient and caregiver demographic and cancer-related variables.
Patient race/ethnicity was defined as Hispanic versus non-Hispanic. Annual household income was divided into six mutually exclusive groups (≤ $19,999; $20,000 to 39,999; $40,000 to 59,999; $60,000 to 79,999; $80,000 to 99,999; ≥ $100,000). Caregiver education was categorized as those having a high school degree or general education degree versus those having some college or vocational schooling.
Cancer diagnoses were grouped as acute lymphoblastic leukemia (ALL), acute myeloid leukemia (AML), brain tumors, and solid tumors (eg, lymphoma, neuroblastoma) to create groups of patients with similar treatment schedules. Current age (0 to 4, 5 to 9, 10 to 14, 15 to 26 years) and age at diagnosis (0 to 4, 5 to 9, 10 to 14, 15 to 21 years) were categorized into four mutually exclusive groups.
Socioeconomic factors.
Insurance was categorized as private (ie, parent or caregiver group policy, military dependent or Veterans Affairs benefit) versus public (ie, Medicaid, Medicare, or Children's Health Insurance Program). Place of residence was defined as rural or urban by Zip code at diagnosis based on Rural-Urban Commuting Area Codes.8 Parental employment was measured by the following question, “Have you, or anyone involved in the care of your child, had to quit work or change jobs as a direct result of your child having cancer?” and categorized as a dichotomous variable (quit or changed job versus no change in employment).
Health care use factors.
Caregivers reported the number of unexpected hospital admissions since their child's initial diagnosis for conditions such as fever, infection, pain, transfusions, nausea, or other illnesses. The number of unexpected admissions ranged from 0 to 80, with 80% of the sample having fewer than five unexpected hospitalizations. We explored this variable as a continuous measure but ultimately categorized it into three groups on the basis of its relationship with financial burden: no unexpected admissions, 1 to 4 admissions, and 5 or more admissions. In addition, we performed sensitivity analyses that excluded the n = 13 patients with > 10 unexpected hospitalizations. Because there were no differences in our analyses with these patients removed, we left them in the final analysis.
We created binary variables including any occurrence of admission to the Pediatric Intensive Care Unit, emergency ambulance transportation, emergency helicopter or airplane transportation, and receipt of care at a hospital other than PCH. Caregivers reported their out-of-pocket costs for traveling to receive cancer treatment. Gas (range $0 to $850) and travel (range $0 to $930) expense were categorized into $25 increments for multivariable models.
Statistical Analysis
All analyses were performed using Stata 12 (College Station, TX). χ2 tests compared patient demographics by time since diagnosis (< 1 year v 1 to 5 years). We generated bivariable associations between our independent variables of interest by time since diagnosis, performing χ2 tests for categorical variables and t tests for continuous variables. Multivariable linear regressions determined the relationship between the outcome variable (financial burden from 0 to 100) and covariables. As we developed our final analyses, we also ran multivariable logistic regression and multinomial regression models with financial burden dichotomized (< 50, ≥ 50) and categorized (0 to 25, 26 to 50, 51 to 75, 76 to 100), respectively. The results were similar, thus we opted to report on the multivariable linear regression models for ease of interpretation.
Separate adjusted regression models were run for two independent variable groups: socioeconomic factors and health care use factors. All adjusted models included patient sex, age at diagnosis, insurance, and place of residence, as relevant. We examined time since diagnosis both as a continuous and categorical variable, and found that for many of our analyses, there was a threshold at 1 year after diagnosis. Therefore, we ran three sets of models: for the full sample, for patients < 1 year from diagnosis, and lastly for patients 1 to 5 years from diagnosis. All reported P values were considered significant at α = .05.
Results
Mean patient age at survey was 8.9 years (standard deviation [SD] = 5.5 years); the majority were male (54.3%) and white (90.9%). The most common types of cancer were ALL and solid tumors, and average age at diagnosis was 6.8 years (SD = 5.5 years). Average time since diagnosis was 1.6 years (SD = 1.4 years). In Table 1, patients < 1 year from diagnosis were younger (P < .01) than those who were 1 to 5 years from diagnosis, and caregivers of those < 1 year from diagnosis had higher education than those with a child 1 to 5 years from diagnosis (P = .04). There were no differences by time since diagnosis for other demographics. Respondents did not differ significantly from those who refused to participate regarding age, sex, ethnicity, cancer diagnosis, or time since diagnosis.
Table 1.
Patient Demographic Characteristics by Time Since Diagnosis
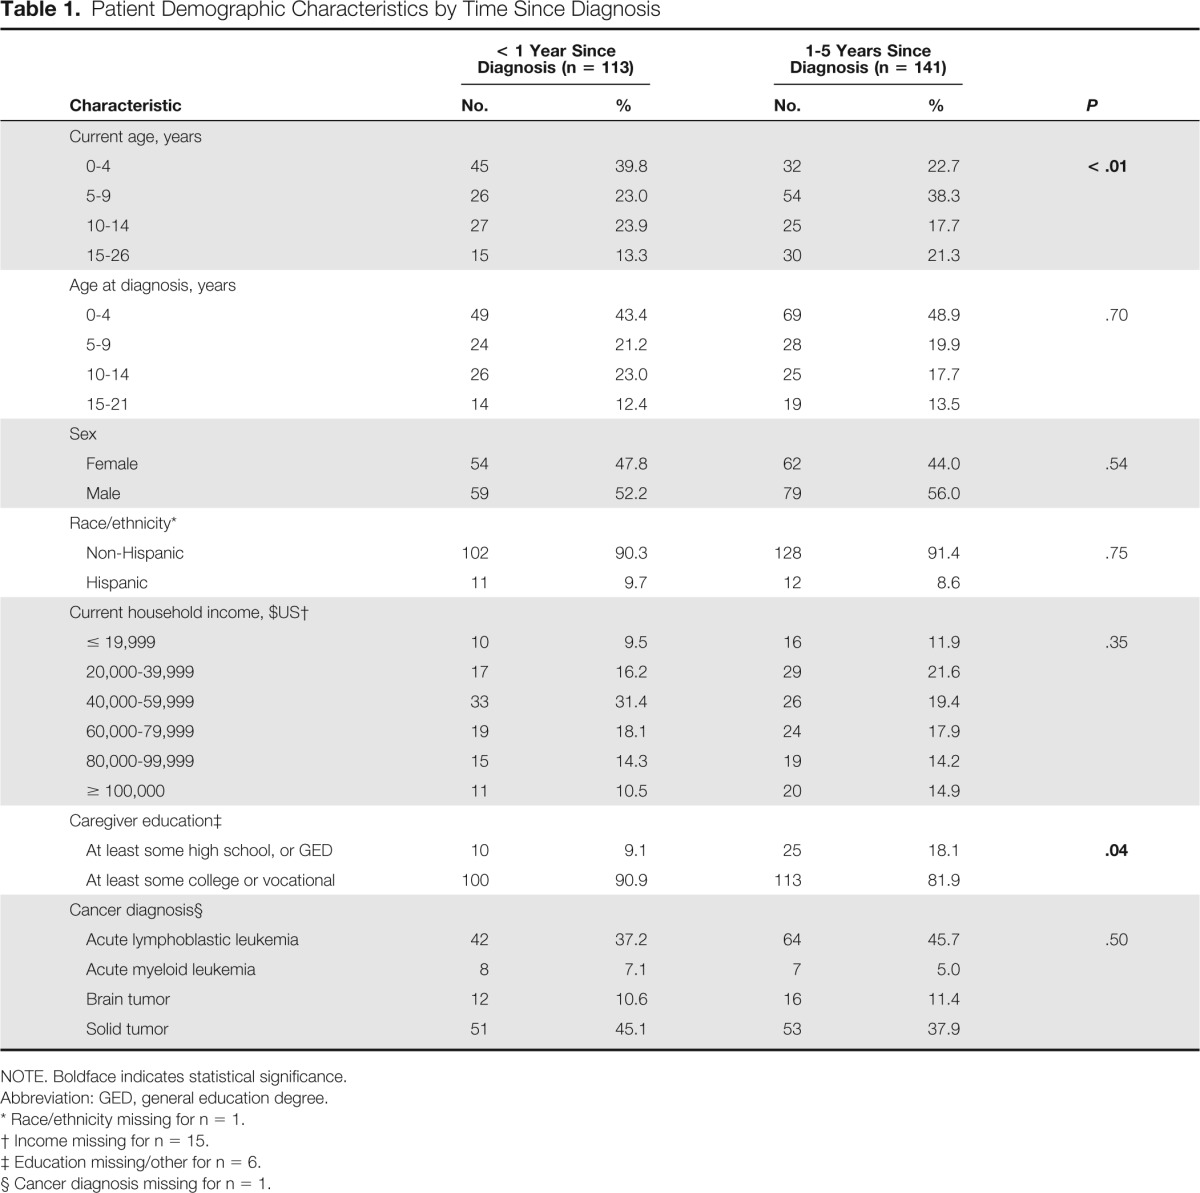
| Characteristic | < 1 Year Since Diagnosis (n = 113) |
1-5 Years Since Diagnosis (n = 141) |
P | ||
|---|---|---|---|---|---|
| No. | % | No. | % | ||
| Current age, years | |||||
| 0-4 | 45 | 39.8 | 32 | 22.7 | < .01 |
| 5-9 | 26 | 23.0 | 54 | 38.3 | |
| 10-14 | 27 | 23.9 | 25 | 17.7 | |
| 15-26 | 15 | 13.3 | 30 | 21.3 | |
| Age at diagnosis, years | |||||
| 0-4 | 49 | 43.4 | 69 | 48.9 | .70 |
| 5-9 | 24 | 21.2 | 28 | 19.9 | |
| 10-14 | 26 | 23.0 | 25 | 17.7 | |
| 15-21 | 14 | 12.4 | 19 | 13.5 | |
| Sex | |||||
| Female | 54 | 47.8 | 62 | 44.0 | .54 |
| Male | 59 | 52.2 | 79 | 56.0 | |
| Race/ethnicity* | |||||
| Non-Hispanic | 102 | 90.3 | 128 | 91.4 | .75 |
| Hispanic | 11 | 9.7 | 12 | 8.6 | |
| Current household income, $US† | |||||
| ≤ 19,999 | 10 | 9.5 | 16 | 11.9 | .35 |
| 20,000-39,999 | 17 | 16.2 | 29 | 21.6 | |
| 40,000-59,999 | 33 | 31.4 | 26 | 19.4 | |
| 60,000-79,999 | 19 | 18.1 | 24 | 17.9 | |
| 80,000-99,999 | 15 | 14.3 | 19 | 14.2 | |
| ≥ 100,000 | 11 | 10.5 | 20 | 14.9 | |
| Caregiver education‡ | |||||
| At least some high school, or GED | 10 | 9.1 | 25 | 18.1 | .04 |
| At least some college or vocational | 100 | 90.9 | 113 | 81.9 | |
| Cancer diagnosis§ | |||||
| Acute lymphoblastic leukemia | 42 | 37.2 | 64 | 45.7 | .50 |
| Acute myeloid leukemia | 8 | 7.1 | 7 | 5.0 | |
| Brain tumor | 12 | 10.6 | 16 | 11.4 | |
| Solid tumor | 51 | 45.1 | 53 | 37.9 | |
NOTE. Boldface indicates statistical significance.
Abbreviation: GED, general education degree.
Race/ethnicity missing for n = 1.
Income missing for n = 15.
Education missing/other for n = 6.
Cancer diagnosis missing for n = 1.
The distribution of perceived financial burden among those < 1 year was similar to those 1 to 5 years from diagnosis. The mean perceived financial burden for those < 1 year from diagnosis was 64.4 (SD = 33.0; interquartile range [IQR], 49 to 87) and for those 1 to 5 years from diagnosis it was 69.0 (SD = 28.7; IQR, 50 to 87).
Socioeconomic Factors
In Table 2, none of the socioeconomic factors (insurance, place of residence, and parental work status) differed by time since diagnosis in bivariable analyses. Approximately one third of caregivers in both groups reported a parent quitting or changing work as a result of their child's cancer diagnosis. When this outcome was examined in multivariable models (Table 3), parents quitting or changing work with a child 1 to 5 years from diagnosis reported 13.4 (95% CI, 3.2 to 23.6; P = .01) points higher financial burden than those without interrupted employment. This outcome was not significant for patients < 1 year from diagnosis. As a secondary analysis, we adjusted for parental education in the employment model and found no appreciable differences. Although living in a rural area did not affect financial burden in the models fit by time since diagnosis, in the full sample, caregivers living in a rural residence reported a higher financial burden (β = 12.3; 95% CI, 2.8 to 21.9; P = .01; data not shown) than caregivers in urban areas.
Table 2.
Socioeconomic and Health Care Use Factors by Time Since Diagnosis
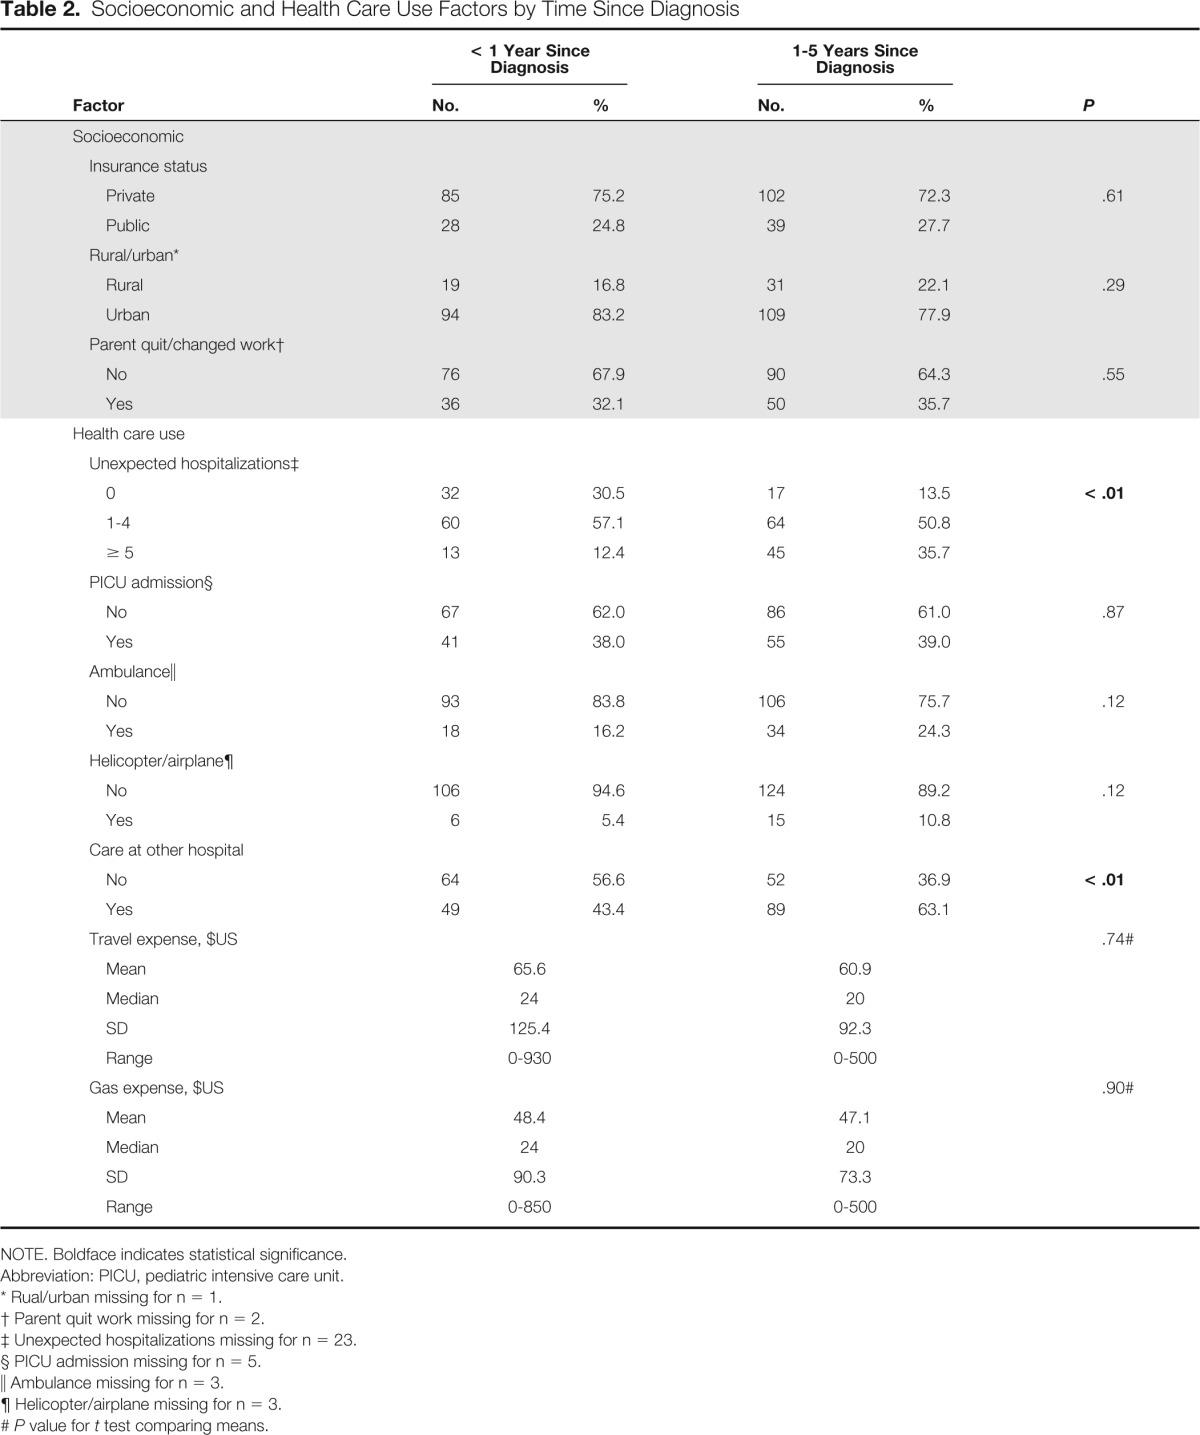
| Factor | < 1 Year Since Diagnosis |
1-5 Years Since Diagnosis |
P | ||
|---|---|---|---|---|---|
| No. | % | No. | % | ||
| Socioeconomic | |||||
| Insurance status | |||||
| Private | 85 | 75.2 | 102 | 72.3 | .61 |
| Public | 28 | 24.8 | 39 | 27.7 | |
| Rural/urban* | |||||
| Rural | 19 | 16.8 | 31 | 22.1 | .29 |
| Urban | 94 | 83.2 | 109 | 77.9 | |
| Parent quit/changed work† | |||||
| No | 76 | 67.9 | 90 | 64.3 | .55 |
| Yes | 36 | 32.1 | 50 | 35.7 | |
| Health care use | |||||
| Unexpected hospitalizations‡ | |||||
| 0 | 32 | 30.5 | 17 | 13.5 | < .01 |
| 1-4 | 60 | 57.1 | 64 | 50.8 | |
| ≥ 5 | 13 | 12.4 | 45 | 35.7 | |
| PICU admission§ | |||||
| No | 67 | 62.0 | 86 | 61.0 | .87 |
| Yes | 41 | 38.0 | 55 | 39.0 | |
| Ambulance∥ | |||||
| No | 93 | 83.8 | 106 | 75.7 | .12 |
| Yes | 18 | 16.2 | 34 | 24.3 | |
| Helicopter/airplane¶ | |||||
| No | 106 | 94.6 | 124 | 89.2 | .12 |
| Yes | 6 | 5.4 | 15 | 10.8 | |
| Care at other hospital | |||||
| No | 64 | 56.6 | 52 | 36.9 | < .01 |
| Yes | 49 | 43.4 | 89 | 63.1 | |
| Travel expense, $US | .74# | ||||
| Mean | 65.6 | 60.9 | |||
| Median | 24 | 20 | |||
| SD | 125.4 | 92.3 | |||
| Range | 0-930 | 0-500 | |||
| Gas expense, $US | .90# | ||||
| Mean | 48.4 | 47.1 | |||
| Median | 24 | 20 | |||
| SD | 90.3 | 73.3 | |||
| Range | 0-850 | 0-500 | |||
NOTE. Boldface indicates statistical significance.
Abbreviation: PICU, pediatric intensive care unit.
Rual/urban missing for n = 1.
Parent quit work missing for n = 2.
Unexpected hospitalizations missing for n = 23.
PICU admission missing for n = 5.
Ambulance missing for n = 3.
Helicopter/airplane missing for n = 3.
P value for t test comparing means.
Table 3.
Impact of Socioeconomic and Health Care Use Factors on Financial Burden
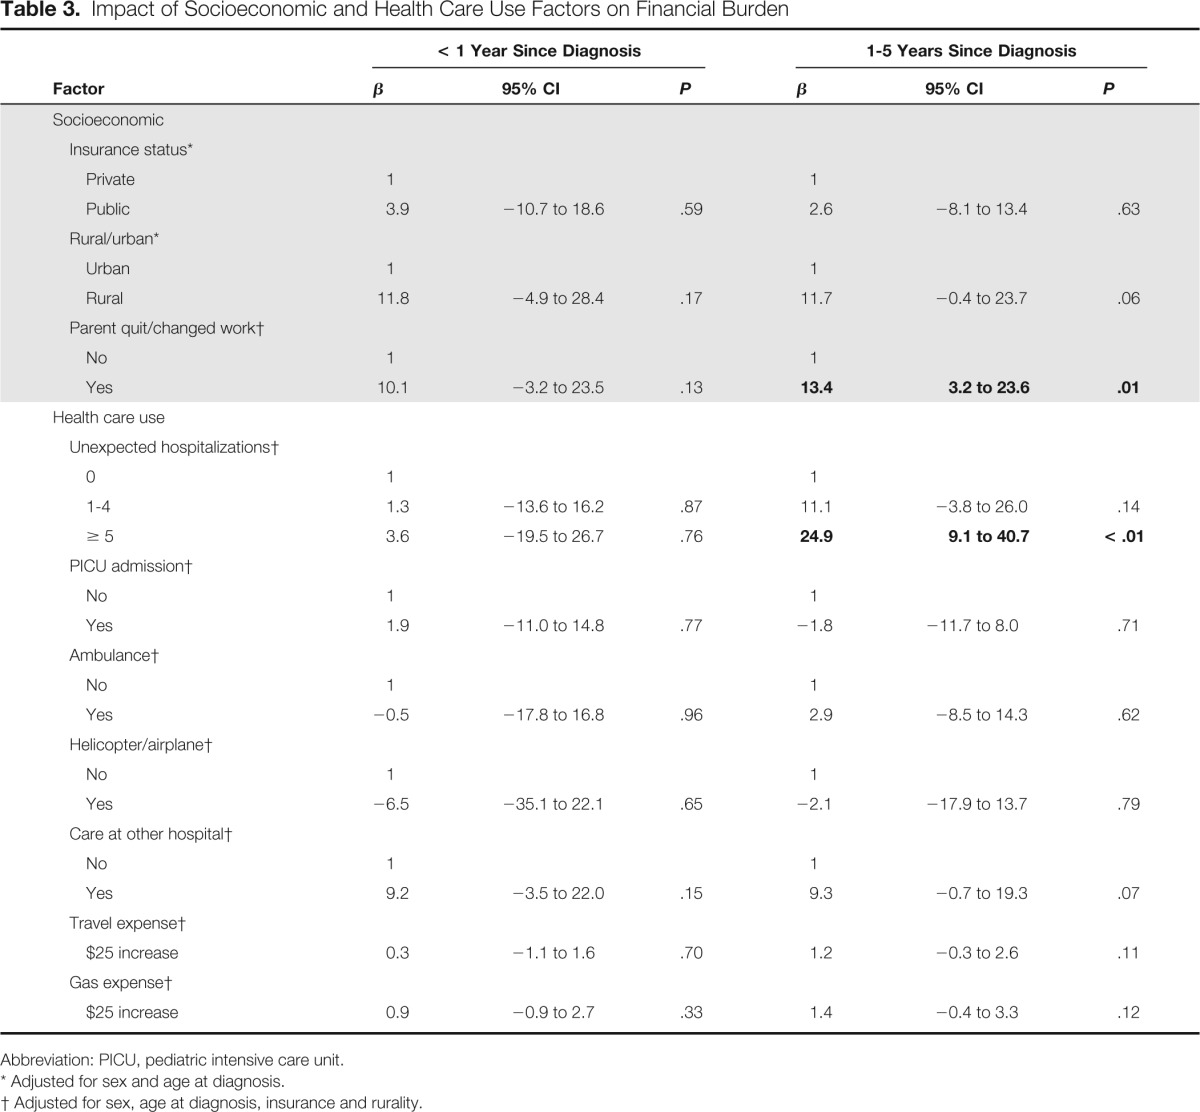
| Factor | < 1 Year Since Diagnosis |
1-5 Years Since Diagnosis |
||||
|---|---|---|---|---|---|---|
| β | 95% CI | P | β | 95% CI | P | |
| Socioeconomic | ||||||
| Insurance status* | ||||||
| Private | 1 | 1 | ||||
| Public | 3.9 | −10.7 to 18.6 | .59 | 2.6 | −8.1 to 13.4 | .63 |
| Rural/urban* | ||||||
| Urban | 1 | 1 | ||||
| Rural | 11.8 | −4.9 to 28.4 | .17 | 11.7 | −0.4 to 23.7 | .06 |
| Parent quit/changed work† | ||||||
| No | 1 | 1 | ||||
| Yes | 10.1 | −3.2 to 23.5 | .13 | 13.4 | 3.2 to 23.6 | .01 |
| Health care use | ||||||
| Unexpected hospitalizations† | ||||||
| 0 | 1 | 1 | ||||
| 1-4 | 1.3 | −13.6 to 16.2 | .87 | 11.1 | −3.8 to 26.0 | .14 |
| ≥ 5 | 3.6 | −19.5 to 26.7 | .76 | 24.9 | 9.1 to 40.7 | < .01 |
| PICU admission† | ||||||
| No | 1 | 1 | ||||
| Yes | 1.9 | −11.0 to 14.8 | .77 | −1.8 | −11.7 to 8.0 | .71 |
| Ambulance† | ||||||
| No | 1 | 1 | ||||
| Yes | −0.5 | −17.8 to 16.8 | .96 | 2.9 | −8.5 to 14.3 | .62 |
| Helicopter/airplane† | ||||||
| No | 1 | 1 | ||||
| Yes | −6.5 | −35.1 to 22.1 | .65 | −2.1 | −17.9 to 13.7 | .79 |
| Care at other hospital† | ||||||
| No | 1 | 1 | ||||
| Yes | 9.2 | −3.5 to 22.0 | .15 | 9.3 | −0.7 to 19.3 | .07 |
| Travel expense† | ||||||
| $25 increase | 0.3 | −1.1 to 1.6 | .70 | 1.2 | −0.3 to 2.6 | .11 |
| Gas expense† | ||||||
| $25 increase | 0.9 | −0.9 to 2.7 | .33 | 1.4 | −0.4 to 3.3 | .12 |
Abbreviation: PICU, pediatric intensive care unit.
Adjusted for sex and age at diagnosis.
Adjusted for sex, age at diagnosis, insurance and rurality.
Health Care Use
The median number of unexpected hospitalizations was one for patients < 1 year from diagnosis (mean = 2.3; SD = 2.9; range, 0 to 20), and 3.5 for patients 1 to 5 years from diagnosis (mean = 5.6; SD = 9.2; range, 0 to 80). Whereas 12.4% of patients < 1 year from diagnosis had five or more unexpected hospitalizations, this increased to 35.7% of those 1 to 5 years from diagnosis (Table 2). When we examined the impact of this categorical measure of hospitalizations on financial burden in our multivariable models (Table 3), there were no differences for patients < 1 year from diagnosis. However, caregivers with a child 1 to 5 years from diagnosis with five or more unexpected hospitalizations reported 24.9 (95% CI, 9.1 to 40.7; P < .01) points higher financial burden than those with no unexpected hospitalizations.
Other health care use measures did not differ in bivariable associations by time since diagnosis, except that patients 1 to 5 years from diagnosis were more likely to report receiving care at a hospital besides PCH (63.1% v 43.4%; P < .01) than those < 1 year from diagnosis (Table 2). When we examined these measures in multivariable models by time since diagnosis, there were no significant differences (Table 3). Only receipt of care at a hospital outside of PCH (β = 9.4; 95% CI, 1.7 to 17.0, P = .02) significantly increased financial burden for the full sample (data not shown).
Discussion
A cancer diagnosis in childhood can substantially affect the physical, psychosocial, and socioeconomic well-being of patients and their families.9–11 Yet, research on the impact of cancer treatment and health outcomes on the economic and financial stability of families of children with cancer has been sparse. Only two other US studies have reported on the financial burden for childhood cancer patients' families12,13; to our knowledge, ours is the first to investigate whether caregivers' perceived financial burden from cancer differs over time since diagnosis. Results from this study indicate that after 1 year from diagnosis, pediatric patients with cancer and their families may be increasingly vulnerable to financial stress related to unplanned hospitalizations and changes in parental employment.
After the first year of diagnosis, a history of five or more unexpected hospitalizations—that is, admissions excluding planned chemotherapy visits—resulted in greater perceived financial stress. Approximately 20% of families in our study reported more than five unexpected hospitalizations. This increased to 35.7% of families 1 to 5 years from diagnosis, suggesting an important area for intervention. Although we did not ascertain the specific reason for these unexpected hospitalizations, complications of cancer therapy, such as infections, fever, or septicemia, often require hospitalization.3 Managing acute, unexpected issues such as these in outpatient visits or through home health nurses could reduce unexpected hospitalizations, and these are important areas for further study.
Treatment for cancer requires ongoing and regular inpatient and outpatient visits, often interrupting parents' work schedules. Not surprisingly, our results indicate that families in which a caregiver had quit or changed work as a result of their child's cancer diagnosis experienced high financial burden. Similar to our findings, one Canadian study found that mothers whose jobs were disrupted after their child's cancer diagnosis reported higher financial difficulty as a result of the cost of care.13a,14 In our study, changes in parents' employment appeared to create financial distress for families after the first year of therapy. One reason this impact might be delayed during the first year of diagnosis could be the pressure to be positive about the future,14,15 resulting in limited discussion about money within families, diminishing resources, and a lack of action in relation to finances.16,17 Although some parents may be eligible for leave under the Family Medical Leave Act (FMLA) to attend to their child's health, we did not ask about FMLA utilization. Future research should investigate how FMLA and other federal and state medical leave legislation affect employment and financial burden for families of pediatric patients with cancer.18
Support from friends, family, and employers, along with financial assets available at the time the child is diagnosed, may allow families to make accommodations that offset financial difficulties in the short-term. However, in the long term, such support mechanisms may be strained. One earlier study that investigated unmeasured costs among families who had lost a child to cancer found that 84% of families in the United States experienced work disruptions, and nearly 20% of families reported losing more than 40% of their annual income as a result of these work disruptions.13 We found that for patients and families who are past the first year of cancer treatment, the challenges of managing the financial costs of cancer in the face of job changes and unplanned hospitalizations may be untenable. This could lead to severe financial repercussions such as bankruptcy,19 refinancing of homes, loss of independence, and relationship breakdown, which may stress family roles and relationships15 and have long-term impact on household finances. As the financial costs of cancer accrue for families, efforts must be made to provide support throughout treatment and follow-up.
Rural families reported higher financial burden as a result of their child's cancer than those in urban areas, although this did not differ by time since diagnosis. Although few studies have focused on childhood patients with cancer in rural areas, rural patients may experience higher financial burden as they are, generally, less likely to be insured, have access appropriate health care, and live above the poverty level.20–24 Facilities that offer cancer follow-up care are typically located in urban areas.25 Thus rural patients may require longer travel distance to care21 and lodging outside the home, potentially contributing to greater financial burden. Although we were unable to determine this from our study, patients living in rural areas may be more likely to see providers outside of PCH than those in urban areas. Future studies should examine how using other hospitals affects financial burden over the course of treatment for rural families.
There are two major cost-related high points in the life course of a patient with cancer: first at diagnosis, and then at a later time when patients start experiencing late effects of treatment.26 Patients with cancer and their families may need ongoing financial management with a designated financial advisor well beyond the initial treatment phase to help them manage debt and access resources to cope with direct and indirect costs of cancer treatment. Furthermore, as a recent analysis demonstrated that cancer patients face a higher risk of personal bankruptcy than individuals without cancer,19 unmanaged costs at the time of diagnosis could reduce patients' and families' financial capability later in life.
There are limitations to note in this study. All measures were based on parents' self-report, and there may be recall bias for certain measures (eg, the number of unexpected hospitalizations for patients further from diagnosis). In addition, initial therapy concludes for many pediatric cancers within 1 year, whereas other cancers such as ALL require 2 to 3 years. In our analyses, we examined several cutoff points for time since diagnosis (eg, limiting to patients within 2 to 3 years of diagnosis), but found no appreciable differences in using these varying timeframes. Thus we included patients up to 5 years from diagnosis as this is the point at which many patients shift from treatment and active surveillance to long-term follow-up with the primary goal of monitoring for sequelae.
The visual scale we used to assess financial burden has not been formally validated, though visual analog scales have been widely used as they are a simple tool for self-administered surveys.27 Future studies should be developed that include more robust measures of perceived financial burden or that capture actual costs for families.28 Also, while the generalizability of this study may be somewhat limited as we focused on one hospital in Utah, PCH in Salt Lake City is the primary pediatric tertiary care center for the Intermountain West, which is a very large patient catchment area. Our results are likely applicable to other geographic areas with few health care facilities. Lastly, we had few patients from a minority race/ethnicity in our sample and restricted our analyses to English-speaking caregivers, which limited our ability to assess the financial impact among the most disadvantaged patients.
From 2000 to 2005, pediatric cancer hospitalizations accounted for $1.7 billion dollars in health care spending in the United States,29 rising 36% in less than a decade to nearly $1 billion in 2009 alone.3 With growing health care costs in the United States, resources to help ease the financial burden on pediatric patients with cancer and their families are limited. The recent focus on improving health insurance coverage, limiting out-of-pocket costs, and eliminating lifetime dollar limitations through the Patient Protection and Affordable Care Act may help reduce out-of-pocket costs for some families experiencing cancer. However, we found that for many pediatric cancer families, indirect cancer costs from treatment such as unexpected hospitalizations and interrupted parental employment cause significant financial difficulties that emerge after the first year of therapy.
Our study demonstrates that medical and social support teams are needed for families on an ongoing basis, even after the end of primary therapy. Interventions to reduce and manage financial burden would be most beneficial if initiated early in diagnosis and treatment, before families become more vulnerable to the stress of indirect cancer costs. Strategies to ease the financial burden on families of pediatric cancer patients should include more structured and consistent coordination with a financial advisor, potentially a social worker, during and after initial treatment to create a plan for managing direct healthcare costs and other related expenses. Furthermore, interventions to improve flexibility in appointment scheduling and medical leave time to support parents' employment may merit further attention.
Acknowledgment
Supported by the Mentored Scholars Program for Translational Comparative Effectiveness Research Grant No. 1KM1CA156723-01, Hyundai Hope on Wheels Foundation, Huntsman Cancer Institute, and the Center for Clinical and Translational Science for providing several research support services and guidance, with funding in part from the National Center for Research Resources and the National Center for Advancing Translational Sciences, National Institutes of Health, through Grant 8UL1TR000105 (formerly UL1RR025764).
Previously presented in part as an abstract poster at the American Society of Preventive Oncology, Washington, DC, March 10, 2014; the Utah Public Health Association Annual Conference, Salt Lake City, UT, April 15-16, 2014; and as an oral presentation at the Annual Health Services Research Conference in Salt Lake City, UT, April 30, 2014.
Authors' Disclosures of Potential Conflicts of Interest
The authors indicated no potential conflicts of interest.
Author Contributions
Conception and design: Echo L. Warner, Anne C. Kirchhoff, Mark Fluchel
Financial support: Anne C. Kirchhoff, Mark Fluchel
Administrative support: Anne C. Kirchhoff, Mark Fluchel
Collection and assembly of data: Gina E. Nam, Mark Fluchel
Data analysis and interpretation: Echo L. Warner, Anne C. Kirchhoff, Mark Fluchel
Manuscript writing: All authors
Final approval of manuscript: All authors
References
- 1.American Cancer Society. Cancer Facts & Figures 2014. http://www.cancer.org/acs/groups/content/@research/documents/webcontent/acspc-042151.pdf.
- 2.National Cancer Institute. SEER Cancer Statistics Review, 1975-2009. http://seer.cancer.gov/archive/csr/1975_2009_pops09/
- 3.Price RA, Stranges E, Elixhauser A. Pediatric Cancer Hospitalizations, 2009: Agency for Healthcare Research and Quality Healthcare Cost and Utilization Project 2012. [PubMed] [Google Scholar]
- 4.Steele RW. Managing infection in cancer patients and other immunocompromised children. Ochsner J. 2012;12:202–210. [PMC free article] [PubMed] [Google Scholar]
- 5.Allareddy V, Rampa S, Allareddy V. Hospital charges and length of stay associated with septicemia among children hospitalized for leukemia treatment in the United States. World J Pediatr. 2012;8:222–228. doi: 10.1007/s12519-012-0361-5. [DOI] [PubMed] [Google Scholar]
- 6.Cohn RJ, Goodenough B, Foreman T, et al. Hidden financial costs in treatment for childhood cancer: An Australian study of lifestyle implications for families absorbing out-of-pocket expenses. J Pediatr Hematol Oncol. 2003;25:854–863. doi: 10.1097/00043426-200311000-00007. [DOI] [PubMed] [Google Scholar]
- 7.Eiser C, Upton P. Costs of caring for a child with cancer: A questionnaire survey. Child Care Health Dev. 2007;33:455–459. doi: 10.1111/j.1365-2214.2006.00710.x. [DOI] [PubMed] [Google Scholar]
- 8.Rural-Urban Commuting Area Codes (RUCAs) Using RUCA Data. 2012. http://depts.washington.edu/uwruca/ruca-uses.php.
- 9.Oeffinger KC, Mertens AC, Sklar CA, et al. Chronic health conditions in adult survivors of childhood cancer. N Engl J Med. 2006;355:1572–1582. doi: 10.1056/NEJMsa060185. [DOI] [PubMed] [Google Scholar]
- 10.Zeltzer LK, Lu Q, Leisenring W, et al. Psychosocial outcomes and health-related quality of life in adult childhood cancer survivors: A report from the childhood cancer survivor study. Cancer Epidemiol Biomarkers Prev. 2008;17:435–446. doi: 10.1158/1055-9965.EPI-07-2541. [DOI] [PubMed] [Google Scholar]
- 11.Kirchhoff AC, Krull KR, Ness KK, et al. Occupational outcomes of adult childhood cancer survivors: A report from the childhood cancer survivor study. Cancer. 2011;117:3033–3044. doi: 10.1002/cncr.25867. [DOI] [PMC free article] [PubMed] [Google Scholar]
- 12.Lansky SB, Cairns NU, Clark GM, et al. Childhood cancer: Nonmedical costs of the illness. Cancer. 1979;43:403–408. doi: 10.1002/1097-0142(197901)43:1<403::aid-cncr2820430157>3.0.co;2-l. [DOI] [PubMed] [Google Scholar]
- 13.Dussel V, Bona K, Heath JA, et al. Unmeasured costs of a child's death: Perceived financial burden, work disruptions, and economic coping strategies used by American and Australian families who lost children to cancer. J Clin Oncol. 2011;29:1007–1013. doi: 10.1200/JCO.2009.27.8960. [DOI] [PMC free article] [PubMed] [Google Scholar]
- 13a.Miedema B, Easley J, Fortin P, et al. The economic impact on families when a child is diagnosed with cancer. Curr Oncol. 2008;15:173–178. doi: 10.3747/co.v15i4.260. [DOI] [PMC free article] [PubMed] [Google Scholar]
- 14.Lauzier S, Maunsell E, De Koninck M, et al. Conceptualization and sources of costs from breast cancer: Findings from patient and caregiver focus groups. Psychooncology. 2005;14:351–60. doi: 10.1002/pon.851. [DOI] [PubMed] [Google Scholar]
- 15.Amir Z, Wilson K, Hennings J, et al. The meaning of cancer: Implications for family finances and consequent impact on lifestyle, activities, roles and relationships. Psychooncology. 2012;21:1167–1174. doi: 10.1002/pon.2021. [DOI] [PubMed] [Google Scholar]
- 16.Mellon S. Comparisons between cancer survivors and family members on meaning of the illness and family quality of life. Oncol Nurs Forum. 2002;29:1117–1125. doi: 10.1188/02.ONF.1117-1125. [DOI] [PubMed] [Google Scholar]
- 17.Downe-Wamboldt B, Butler L, Coulter L. The relationship between meaning of illness, social support, coping strategies, and quality of life for lung cancer patients and their family members. Cancer Nurs. 2006;29:111–1119. doi: 10.1097/00002820-200603000-00006. [DOI] [PubMed] [Google Scholar]
- 18.Short PF, Vargo MM. Responding to employment concerns of cancer survivors. J Clin Oncol. 2006;24:5138–5141. doi: 10.1200/JCO.2006.06.6316. [DOI] [PubMed] [Google Scholar]
- 19.Ramsey S, Blough D, Kirchhoff A, et al. Washington State cancer patients found to be at greater risk for bankruptcy than people without a cancer diagnosis. Health Aff (Millwood) 2013;32:1143–1152. doi: 10.1377/hlthaff.2012.1263. [DOI] [PMC free article] [PubMed] [Google Scholar]
- 20.Lenardson JD, Ziller EC, Coburn AF, et al. Profile of Rural Health Insurance Coverage. Muskie School of Public Service. 2009. http://muskie.usm.maine.edu/Publications/rural/Rural-Health-Insurance-Chartbook-2009.pdf.
- 21.Baldwin LM, Cai Y, Larson EH, et al. Access to cancer services for rural colorectal cancer patients. J Rural Health. 2008;24:390–399. doi: 10.1111/j.1748-0361.2008.00186.x. [DOI] [PMC free article] [PubMed] [Google Scholar]
- 22.US Department of Agriculture, Economic Research Service. Rural Poverty & Well-being. 2013. www.ers.usda.gov/topics/rural-economy-population/rural-poverty-well-being/geography-of-poverty.aspx.
- 23.Onega T, Duell EJ, Shi X, et al. Geographic access to cancer care in the U.S. Cancer. 2008;112:909–918. doi: 10.1002/cncr.23229. [DOI] [PubMed] [Google Scholar]
- 24.Baldwin LM, Patel S, Andrilla CH, et al. Receipt of recommended radiation therapy among rural and urban cancer patients. Cancer. 2012;118:5100–5109. doi: 10.1002/cncr.27488. [DOI] [PubMed] [Google Scholar]
- 25.Weaver KE, Geiger AM, Lu L, et al. Rural-urban disparities in health status among US cancer survivors. Cancer. 2012;119:1050–1057. doi: 10.1002/cncr.27840. [DOI] [PMC free article] [PubMed] [Google Scholar]
- 26.Yabroff KR, Lund J, Kepka D, et al. Economic burden of cancer in the United States: Estimates, projections, and future research. Cancer Epidemiol Biomarkers Prev. 2011;20:2006–2014. doi: 10.1158/1055-9965.EPI-11-0650. [DOI] [PMC free article] [PubMed] [Google Scholar]
- 27.Torrance GW, Feeny D, Furlong W. Visual analog scales: Do they have a role in the measurement of preferences for health states? Med Decis Making. 2001;21:329–334. doi: 10.1177/0272989X0102100408. [DOI] [PubMed] [Google Scholar]
- 28.Tsimicalis A, Stevens B, Ungar WJ, et al. The cost of childhood cancer from the family's perspective: A critical review. Pediatr Blood Cancer. 2011;56:707–717. doi: 10.1002/pbc.22685. [DOI] [PubMed] [Google Scholar]
- 29.Merrill CT, Nagamine M, Hambrick M. Rockville, MD: Agency for Healthcare Research and Quality; 2007. Pediatric Hospital Stays for Cancer, 2005 (Statistical Brief #37) [PubMed] [Google Scholar]