Abstract
Magnetic resonance imaging (MRI) is the gold standard method for non-invasive assessment of joint cartilage, providing information on the structure, morphology and molecular composition of this tissue. There are certain minimum requirements for a MRI study of cartilage tissue: machines with a high magnetic field (> 1.5 Tesla); the use of surface coils; and the use of T2-weighted, proton density-weighted fast-spin echo (T2 FSE-DP) and 3D fat-suppressed T1-weighted gradient echo (3D-FS T1W GRE) sequences. For better contrast between the different joint structures, MR arthography is a method that can highlight minimal fibrillation or fractures of the articular surface and allow evaluation of the integrity of the native cartilage-repair tissue interface. To assess the biochemical composition of cartilage and cartilage repair tissue, various techniques have been proposed for studying proteoglycans [dGEMRIC, T1rho mapping, sodium (23Na) imaging MRI, etc.], collagen, and water distribution [T2 mapping, “magnetisation transfer contrast”, diffusion-weighted imaging (DWI), and so on]. Several MRI classifications have been proposed for evaluating the processes of joint degeneration (WORMS, BLOKS, ICRS) and post-surgical maturation of repair tissue (MOCART, 3D MOCART). In the future, isotropic 3D sequences set to improve image quality and facilitate the diagnosis of disorders of articular structures adjacent to cartilage.
Keywords: articular cartilage, magnetic resonance imaging, cartilage repair, contrast
Introduction
Joint cartilage is a complex, non-homogeneous and mechanically anisotropic type of tissue consisting primarily of a three-dimensional network of collagen, proteoglycans (PGs) and water; it has a poor cell content. Magnetic resonance imaging (MRI) is the gold standard method for studying this tissue non-invasively, providing information on its structure, morphology and molecular composition.
MRI assessment of joint cartilage
Minimum requirements for a MRI study of cartilage
Cartilage is a thin tissue that covers curved bony surfaces within joints and its assessment demands high-resolution images of good quality. To obtain these, the relationship between signal-to-noise ratio (SNR, i.e. the ratio of the amplitude of the signal to the mean amplitude of the noise), spatial resolution and acquisition time is critical (1).
Since it is difficult to obtain high-resolution images simply by increasing the acquisition time, the role of the magnet is fundamental: the strength of the magnetic field influences the SNR in a directly proportional manner and is a factor allowing the acquisition of high-quality images. Therefore, high-field machines (≥1.5T) are recommended for studying cartilage.
Specific sequences for cartilage
Proton density-weighted fast spin-echo (FSE-PD) and three-dimensional (3D) fat-suppressed (FS) T1-weighted gradient-echo (3D-FS T1W GRE) sequences are the ones most commonly used (2).
Gradient-echo (GRE) sequences show cartilage defects by highlighting different T1 relaxation times in cartilage and intra-articular fluid; fast spin-echo (FSE) sequences reveal different T2 relaxation times.
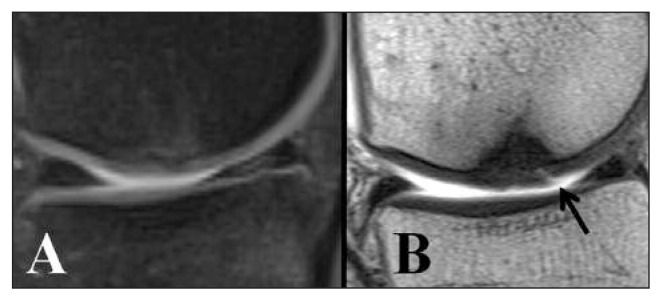
Compared with intra-articular fluid, cartilage has a higher signal intensity on FS T1-weighted images and a lower one on intermediate and T2-weighted images. Whereas 3D-FS T1W GRE sequences clearly show the cartilage surface and thickness, allowing 3D volume measurements, FSE sequences are more sensitive for the assessment of tissue structure. All these sequences (FS, 3D GRE and FSE) have given excellent results in highlighting cartilage lesions, showing high sensitivity, specificity and accuracy (1, 2). To improve the contrast between the different joint structures, MR-arthography (MRA) is an extremely helpful method. Injection of around 40 ml of gadolinium (Gd)-based paramagnetic contrast agent directly into the joint makes it possible to highlight minimal fibrillation or fractures of the articular surface (Fig. 1) and evaluate the integrity of the native cartilage-repair tissue interface (3). New isotropic 3D sequences are currently under study and potentially offer higher resolution than the ones mentioned above. These sequences are GRE-based, such as: Spoiled Gradient Recalled Acquisition in Steady State (SPGR), Fast Low Angle SHot (FLASH), Volumetric Interpolated Breath-hold sequence (VIBE), and Dual Echo Steady State (DESS), or FSE-based, such as: “Sampling Perfection with Application optimized Contrast using different flip angle Evolutions” (SPACE), FSE-extended echo-train acquisition (FSE-XETA), VISTA, etc. Using these sequences it will be possible, in the future, to accurately identify the interface between repair tissue and native cartilage, subchondral bone, and intra-articular fluid (1, 4).
Fig. 1.

Five-year follow-up of matrix-induced autologous chondrocyte implantation “MACI” used to treat a medial femoral condyle lesion. A. FSE-DP with fat suppression. No surface abnormalities are visible. B. T1-weighted spin-echo sequence with intra-articular contrast medium. Fissure (arrow) at the level of the regenerated tissue shown by infiltration of the contrast medium.
Quantitative/functional (biochemical) MRI
Different MRI techniques have been proposed for evaluating the biochemical composition of cartilage and repair tissue. These include sequences already commonly used in clinical practice and ones that are in the study phase. Techniques for studying PGs include: delayed gadolinium enhanced magnetic resonance imaging of cartilage (dGEMRIC), T1rho mapping, sodium (23Na) MRI, etc.; while techniques for studying collagen and water distribution include: T2 mapping, magnetization transfer contrast imaging, etc. (1,4). Diffusion-weighted imaging (DWI) is a special technique used to examine free water movement in tissues. Measurement of this movement provides information on the biochemical composition and architecture of the analyzed tissue (5). The main limitation of these methods lies in the differences between the scanning models, sequences and processing algorithms used, which may affect the quality and quantity of the data. dGEMRIC and T2 mapping are the most widely used techniques (1,4).
dGEMRIC
Delayed gadolinium-enhanced MRI of cartilage (dGEMRIC) is the most commonly used method for evaluating depletion of PGs. It is based on intravenous administration of the negatively charged contrast agent gadopentetate dimeglumine (Gd-DTPA2-), which enters the cartilage by diffusion both from the synovial fluid and, in part, from the subchondral bone. The Gd-DTPA2- distributes in the tissue in inverse relation to the cartilage glycosaminoglycan (GAG) component. (Infacts GAGs are also negatively charged molecules).
Increased accumulation of contrast medium will result in low T1-weighted sequence values, pointing to a degenerative process.
The most widely used protocol is the one described by Burstein et al. (6) which involves 20 minutes exercise (e.g. walking, climbing stairs) immediately after administration of the contrast medium, to ensure effective penetration of the contrast medium into the cartilage, and scanning around 90 minutes after the start of the procedure.
However, the technique is limited by several factors, namely the inter-individual variability of cartilage thickness, the variability of cartilage thickness between different joints, the different response of subchondral bone to different surgical procedures, and different individual responses to physical exercise. These variables, together with differences in acquisition techniques, mentioned in the previous paragraph, can affect the final result (1,4).
T2 mapping
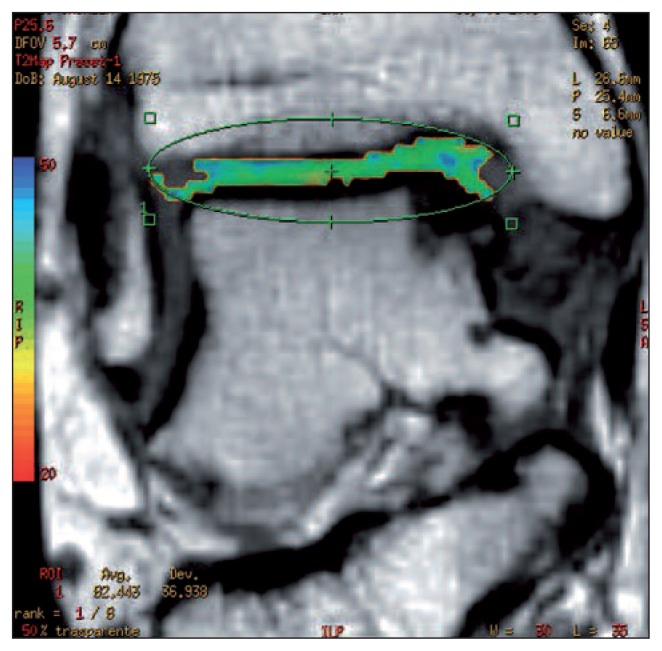
The T2 mapping method provides information about the degree of organization of the collagen network and is therefore complementary to the techniques that evaluate PGs (Fig. 2). T2 relaxation times correlate with the degree of organization of collagen fibers: shorter values are recorded in the deep cartilage zones, where collagen is highly organized, and long ones in the transitional zone where it is less organized.
Fig. 2.
Four-year follow up of coronal T2 mapping of membrane autologous chondrocyte transplantation, performed to treat a medial talus lesion. The T2 map values (44 ms) are similar to those of healthy cartilage tissue (Image courtesy of Prof. Sandro Giannini, Dr. Milva Battaglia and Dr. Francesca Vannini).
Finally, the superficial zone and lamina splendens, being very thin, may not be visualized (7). In clinical practice, T2 mapping has been used for evaluating the early stages of joint degeneration and for staging the evolution of repair tissue from an immature, disorganized state into hyaline-like tissue. The main limitation of this technique is that the data obtained do not correlate with collagen content and therefore cannot be used to consider this variable in comparisons of different surgical techniques (1,4).
Morphology-based MRI classifications of cartilage injury and repair
There exist various MRI classifications that can be used for assessing joint degeneration and repair tissue maturation after surgery. The most commonly used for assessing the process of joint degeneration are:
Whole Organ Magnetic Resonance Imaging Score (WORMS): this assesses not only the cartilage but also other structures, such as the menisci, ligaments, subchondral bone and bone marrow (8).
Boston-Leeds OA Knee Score (BLOKS): this focuses mainly on bone edema (9).
-
ICRS (International Cartilage Repair Society): this proposes the sequences to use and focuses on the degree of cartilage injury (10).
The classifications most commonly used for monitoring the evolution of bone tissue are:
MOCART (magnetic resonance observation of cartilage repair tissue) (11), which is the most complete and
3D MOCART, an evolution of MOCART which is based on the latest multiplanar reconstructions of the isotropic sequences.
MOCART includes 11 variables that consider not only the repair tissue, but also the bone interface, the formation of intralesional osteophytes, and joint effusion, etc. (12).
Conclusions
Morphological and biochemical assessment of joint cartilage using MRI is today possible thanks to the availability of high-field machines (≥1.5 T), advanced coils and dedicated sequences able to accurately define native cartilage, repair tissue and adjacent structures. T1-weighted Gadolinium-enhanced sequences combined with T2 mapping can provide information about the molecular composition and structural organization of the cartilage in the early degenerative stages and be used to monitor the maturation of the newly formed tissue after surgery. In the future, isotropic 3D sequences set to improve image quality and facilitate the diagnosis of disorders of articular structures adjacent to cartilage.
References
- 1.Li X, Majumdar S. Quantitative MRI of articular cartilage and its clinical applications. J Magn Reson Imaging. 2013;38:991–1008. doi: 10.1002/jmri.24313. [DOI] [PMC free article] [PubMed] [Google Scholar]
- 2.Recht M, Bobic V, Burstein D, et al. Magnetic resonance imaging of articular cartilage. Clin Orthop Relat Res. 2001;391(Suppl):S379–S396. doi: 10.1097/00003086-200110001-00035. [DOI] [PubMed] [Google Scholar]
- 3.Genovese E, Ronga M, Angeretti MG, et al. Matrix-induced autologous chondrocyte implantation of the knee: mid-term and long-term follow-up by MR arthrography. Skeletal Radiol. 2011;40:47–56. doi: 10.1007/s00256-010-0939-8. [DOI] [PubMed] [Google Scholar]
- 4.Mosher TJ, Walker EA, Petscavage-Thomas J, et al. Osteoarthritis year 2013 in review: imaging. Osteoarthritis Cartilage. 2013;21:1425–1435. doi: 10.1016/j.joca.2013.07.010. [DOI] [PubMed] [Google Scholar]
- 5.Glaser C. New techniques for cartilage imaging:T2 relaxation time and diffusion-weighted MR imaging. Radiol Clin North Am. 2005;43:641–653. doi: 10.1016/j.rcl.2005.02.007. [DOI] [PubMed] [Google Scholar]
- 6.Burstein D, Velyvis J, Scott KT, et al. Protocol issues for delayed Gd (DTPA) (2-)-enhanced MRI: (dGEMRIC) for clinical evaluation of articular cartilage. Magn Reson Med. 2001;45:36–41. doi: 10.1002/1522-2594(200101)45:1<36::aid-mrm1006>3.0.co;2-w. [DOI] [PubMed] [Google Scholar]
- 7.Domayer SE, Welsch GH, Nehrer S, et al. T2 mapping and dGEMRIC after autologous chondrocyte implantation with a fibrin-based scaffold in the knee: preliminary results. Eur J Radiol. 2010;73:636–642. doi: 10.1016/j.ejrad.2008.12.006. [DOI] [PubMed] [Google Scholar]
- 8.Peterfy CG, Guermazi A, Zaim S, et al. Whole-Organ Magnetic Resonance Imaging Score (WORMS) of the knee in osteoarthritis. Osteoarthritis Cartilage. 2004;12:177–190. doi: 10.1016/j.joca.2003.11.003. [DOI] [PubMed] [Google Scholar]
- 9.Hunter DJ, Lo GH, Gale D, et al. The reliability of a new scoring system for knee osteoarthritis MRI and the validity of bone marrow lesion assessment: BLOKS (Boston Leeds Osteoarthritis Knee Score) Ann Rheum Dis. 2008;67:206–211. doi: 10.1136/ard.2006.066183. [DOI] [PubMed] [Google Scholar]
- 10.Clinical Munchenwiler Evaluation Group ICRS Cartilage Injury Evaluation Package January27–30302000http://www.cartilage.org/_files/contentmanagement/ICRS_evaluation.pdf
- 11.Marlovits S, Striessnig G, Resinger CT, et al. Definition of pertinent parameters for the evaluation of articular cartilage repair tissue with high-resolution magnetic resonance imaging. Eur J Radiol. 2004;52:310–319. doi: 10.1016/j.ejrad.2004.03.014. [DOI] [PubMed] [Google Scholar]
- 12.Welsch GH, Zak L, Mamisch TC, et al. Three-dimensional magnetic resonance observation of cartilage repair tissue (MOCART) score assessed with an isotropic three-dimensional true fast imaging with steady-state procession sequence at 3.0 Tesla. Invest Radiol. 2009;44:603–612. doi: 10.1097/RLI.0b013e3181b5333c. [DOI] [PubMed] [Google Scholar]


