Abstract
Bacterial conjugation, a DNA transfer mechanism involving transport of one plasmid strand from donor to recipient, is driven by plasmid-encoded proteins. The F TraI protein nicks one F plasmid strand, separates cut and uncut strands, and pilots the cut strand through a secretion pore into the recipient. TraI is a modular protein with identifiable nickase, ssDNA-binding, helicase and protein-protein interaction domains. While domain structures corresponding to roughly 1/3 of TraI have been determined, there has been no comprehensive structural study of the entire TraI molecule, nor an examination of structural changes to TraI upon binding DNA. Here, we combine solution studies using small-angle scattering and circular dichroism spectroscopy with molecular Monte Carlo and molecular dynamics simulations to assess solution behavior of individual and groups of domains. Despite having several long (>100 residues) apparently disordered or highly dynamic regions, TraI folds into a compact molecule. Based on the biophysical characterization, we have generated models of intact TraI. These data and the resulting models have provided clues to the regulation of TraI function.
Keywords: DNA conjugation, TraI, homology modeling, Monte Carlo, Small-angle scattering, SANS, SAXS
1 Introduction
Bacterial conjugation, transfer of a copy of a conjugative plasmid from donor to recipient bacterial cell, is an efficient means of disseminating genes [38]. Conjugation mediates unidirectional, horizontal plasmid transfer between even unrelated species, contributing to rapid genome diversification and the spread of antibiotic resistance [47, 48,1,7]. While the general mechanism of bacterial conjugation has been known for decades, many of the molecular details are unknown despite a clear therapeutic impetus for a detailed understanding of this process. F plasmid conjugation is the prototypical conjugative plasmid transfer mechanism [7]. F and F-like plasmids encode the Tra (transfer) proteins essential for their transfer. Conjugation begins with the assembly of a complex of proteins at the plasmid oriT (origin of transfer) to form the relaxosome. Here, the plasmid-encoded proteins TraY and TraM and the host IHF (Integration Host Factor) bind and distort the dsDNA to open a region of ssDNA [19,17,36,22,35]. TraI binds to a specific portion of this newly exposed ssDNA, cleaves the DNA in a metal-dependent manner, and creates a stable nucleoprotein intermediate through a covalent phosphodi-ester bond between the hydroxyl of a TraI active site Tyr and a DNA backbone phosphate [33,10,43]. TraD, the membrane coupling protein through which the TraI-DNA conjugate likely passes to enter the periplasm, and TraM may also interact to facilitate the mutual recognition of the relaxosome and conjugative machinery [31, 30,29]. During conjugative transfer, TraI acts as a pilot protein, first interacting with the conjugative pore through embedded “translocation signals” that mark the protein and its attached ssDNA for transport, then, in the recipient, joining the plasmid ends together by reversing the nickase reaction to generate a closed circular plasmid [26,9]. Structurally, TraI is composed of at least four distinct regions. Each of these regions is proteolytically stable, and each region corresponds to a particular function. The N-terminal 300 amino acids contain the nickase activity, which sequence-specifically binds and cleaves one strand of the F oriT sequence [44,34]. The region from 309–858 binds to ssDNA with high affinity but relatively low sequence specificity [8,50]. This ssDNA binding activity is associated with and essential for function of the third region, a RecD-like helicase fold located from residue 990–1450 [8]. The C terminus (1450–1756) may interact with other Tra proteins, including TraD, even though the translocation signals are located N-terminal to this region [13]. Recent in vitro and in vivo studies provide evidence for an apparent negative co-operativity of ssDNA binding to the TraI relaxase and helicase-associated (309–858) domains, with ssDNA binding at one site preventing binding at the other [8]. The biological reasons for the negative cooperativity are not known, although it may play a role in regulating the two TraI activities. The TraI nickase cleaves and bonds to the oriT DNA prior to transfer, while the TraI helicase activity is required subsequently. The underlying mechanism of this strong negative cooperativity is also unknown. We anticipated that high resolution structural information of the TraI would give insight into the mechanism of F plasmid conjugation. Indeed, high resolution structures of the TraI nickase domain with [27] and without [6] bound ssDNA showed that F TraI employs some unusual mechanisms to attain its high level of sequence specificity. In a recent paper, we have shown that region 381–569 adopts a structure resembling an analogous portion of helicase RecD, even though this region, and the 309–858 RecD-like domain to which it belongs, lacks helicase motifs and function. We have thus far been unable to determine a structure of TraI 1–858 or the intact TraI protein, and therefore have no structural insights into the apparent negative cooperativity of ssDNA binding or other TraI activities. We have been unable to crystallize these larger fragments and preliminary NMR studies have shown a number of them are unsuited for NMR structure determination. For this reason, we turned to analysis of behavior of TraI in solution using small angle scattering (SAS). Data from these techniques, along with circular dichroism data, high-resolution structural data, and domain homology modeling are here being used in concert to create models of the full-length TraI molecule. These models were used as starting structures for extensive Monte Carlo (MC) simulations to determine structures of TraI fragments and full-length TraI by comparison of theoretical scattering profiles to experimental data.
2 Materials and Methods
2.1 Protein Expression and Purification
Expression constructs for TraI fragments were generated as described [8]. All constructs were verified by DNA sequencing. Expression and purification of TraI and TraI protein fragments was performed as described [8].
2.2 Small Angle Scattering
Small-angle X-ray scattering (SAXS) data were collected on the F2 beamline at the Cornell High Energy Synchrotron Source, Ithaca, NY1, using an X-ray source with a beam edge of 9.881 keV (1.2563 Å) and an area of 250 mm2. 30 μL of protein sample was loaded into a horizontal capillary tube in the beam line and the sample was oscillated during data collection to avoid sample radiation damage. Before loading, samples were centrifuged at 13,000 × g for 10 minutes to remove possible aggregates, and data were collected for each protein at multiple concentrations (1, 2, and 3 mg/ml) to check for possible concentration dependent scattering due to molecular association. Data were collected for either three 3-minute cycles or three 1-minute cycles. Dark field and buffer samples were collected, and these were then subtracted from the protein scattering data using the program RAW [37].
Small-angle neutron scattering (SANS) data for TraI 1–569 and TraI 1–1756 were collected using the 30 m SANS instruments at the NIST Center for Neutron Research in Gaithersburg, MD. Neutrons (λ= 6 Å with a wavelength spread of Δλ/λ = 0.11) were used and scattered neutrons were detected (128 × 128 pixels) at a resolution of 0.5 cm/pixel using a 64 × 64 cm two-dimensional detector. After brief centrifugation, samples were loaded into quartz cuvettes (Hellma USA, Plainville, NY) of 1- or 2-mm path length (for H2O or D2O buffer, respectively) at concentrations that varied from 1–3 mg/mL. Neutron exposure time was 1 h to 1.5 h. Data were reduced using Igor Pro software (Wave-Metrics, Lake Oswego, OR) with SANS macros developed at the NCNR [24]. Total two-dimensional scattering was corrected for scattering from the quartz cell, ambient room background counts and non-uniform detector response. Scattering was placed on an absolute scale by normalization to the incident beam flux and radially averaged to obtain the scattering intensity, I(Q) versus Q, where Q = 4π sin(θ)/λ and 2θ is the scattering angle. This scattering intensity was further corrected for background scattering from the buffers and incoherent scattering from hydrogen in the sample to obtain the final scattering intensity for the proteins in solution. SAXS data was collected on an arbitrary scale and the SANS data for the TraI 1–1756 and TraI 1–569 were used to adjust the complimentary X-ray data to an absolute scale. The TraI 309–1756 and the TraI 381–858 constructs were put on absolute scale using the known differences in molecular weight and/or concentration relative to TraI 1–1756. Pair distribution analysis was performed using GNOM [45]. Guinier analysis [12] was used to determine experimental radius of gyration (Rg) using I(Q)/I(0) ~ exp[−Q2Rg2/3].
2.3 Circular Dichroism Spectroscopy
Circular dichroism (CD) was used to obtain estimates of secondary structure for TraI domains. Protein samples were prepared in 100 mM NaCl in either 20 mM HEPES pH 7.5 or 20 mM Tris pH 7.5. All measurements were performed at 20 °C using a 2 mm quartz cell. All spectra were scanned 3 times from 190 nm to 250 nm on an AVIV Circular Dichroism Spectrometer model 215 (AVIV Biomedical, Lakewood, NJ) and averaged. Spectra were background subtracted and analyzed using the reference data base obtained by Dicroweb (Whitmore and Wallace 2004). Secondary structure content was calculated using CONTIN [40].
2.4 Modeling and Simulation Protocols
2.4.1 Model Building
The three starting models of full-length TraI were built using known crystallographic and NMR structures, homology models, and structure prediction resources. During the process, structures with missing residues were modified by insertion of correct amino-acids via internal coordinates provided by the CHARMM-22 force-field [32] using the CHARMM macromolecular mechanics program [2]. Homology models were generated by manually threading backbone sequence through model structures using CHARMM. Additionally, structure prediction tools were used for secondary structure prediction [39,11,41,20], order-disorder content [28,42,15], and three-dimensional model creation [23]. Where appropriate, energy minimization, short molecular dynamics trajectories, and more extensive simulated annealing procedures were carried out using CHARMM (see Section 2.4.2 for simulation details).
2.4.2 Molecular Simulation and Analysis Protocol
Energy minimizations were carried out for 104 steps. Simulated annealing runs were typically done for 100 cycles of heating and cooling (300 K to 1110 K to 300 K) using 50 K steps 50 ps in length. After each cycle the structure was energy minimized. After creating the final three structures they were subjected to 1 ns of dynamics in periodic boxes of TIP3P [21] water to test the integrity of the starting models. Subsequently, protein coordinates were extracted and used as starting structures for MC simulations that are carried out using the program SASSIE [5]. For each MC simulation, between 30000 to 100000 non-overlapping configurations were generated by sampling backbone dihedral angles, ϕ or ψ, of residues for each model as shown in Table 1. Energetics of the specific dihedral angle to sample configurations was derived from the energy of a given ϕ or ψ angle that was calculated from the specific atomic (and thereby amino acid residue specific) composition about the given angle. The energy term was calculated from Vdihedral = V (θ) = kθ (1.0 + cos(nθ − δ)) where the angular force constant (kθ), multiplicity (n), and δ are values from the CHARMM 22 all-atom protein force field and are specific for the atom types for the given dihedral angle of interest (θ= ϕ or ψ). In addition, non-bonded terms were included in the potential U = Vdihedral + VvdW + Velec and calculated using CHARMM 22 parameters. For well-depths, εij and radii σij for pairs of atoms i and j, the van der Waals potential energies were calculated using
Table 1.
Flexible Residues for Monte Carlo Simulation of Full-Length TraI Models
| Model | Residues |
|---|---|
| I | 307–378, 612–626, 866–988, 1488–1526, 1625–1756 |
| II | 307–324, 350–380, 612–626, 866–991, 1095–1114, 1478–1526, 1628–1756 |
| III | 307–319, 367–380, 612–626, 860–866, 944–955, 1095–1108, 1465–1526, 1625–1708, 1731–1756 |
| (1) |
VvdW energies were smoothed to zero using a polynomial function for distances between 10 Å and 12 Å. Using atomic charges qi, qj, relative permittivity, εr = 80.1, and a Debye screening length, L, the electrostatic potential energies were calculated using
| (2) |
with a screening length of 25 Å. The full potential, U, was used to carry out the Metropolis sampling methodology at 300 K.
Following MC sampling, each configuration was energy minimized. SANS and SAXS profiles were calculated from the atomic coordinates using Xtal2sas [14,25] and Crysol [46] respectively. Comparisons of experimental to theoretical SAS profiles were done using reduced χ2 calculated using
| (3) |
where Iexp(Q) is the experimentally determined scattering profile, Icalculated(Q) is the theoretical SAS profile, σexp(Q) is the experimentally determined Q-dependent variance, and the sum was taken over N = 30 evenly spaced grid points of momentum transfer, Q (δQ = 0.005 Å−1). Density plot visualization was done using VMD [18].
3 Results
3.1 Model Building
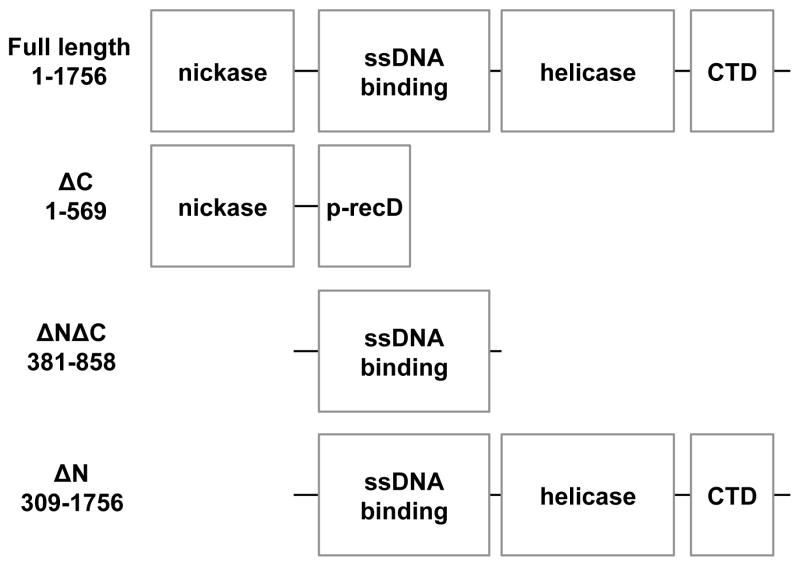
Full-length TraI can be divided into four discrete domains based upon the functions and known domain structures of this molecule (Figure 1). As defined, each of these domains contain large regions with structures that have been neither determined nor adequately modeled. Even those regions with known or modeled structures have subregions of unknown structure, such as loops between structurally defined parts of each domain. Our strategy in developing models of full-length TraI was to combine regions of each domain that are known or predicted to have defined globular structures with disordered or structurally undefined linkers joining the domains and an unstructured C-terminal tail. A bioinformatic analysis of the primary sequence was combined with experimental CD results to generate models of the linker and tail regions. To explore various structural options when modeling undefined regions, the linkers and tail were designed in three distinct manners to produce full-length TraI models I, II, and III.
Fig. 1.
Diagram of structured regions of the full-length TraI and the associated truncation fragments
One of the motivations to develop three independent starting models was to aide the MC simulation protocols in order to expedite the convergence to structures of the correct size and shape dictated by the small-angle scattering data. The efficient generation of both compact and extended structures to compare to experimental data also helped remove sampling bias from the results and ensured adequate configurational space coverage. Convergence was judged by the distribution of χ2 of the ensemble and the agreement with experimental SAXS data.
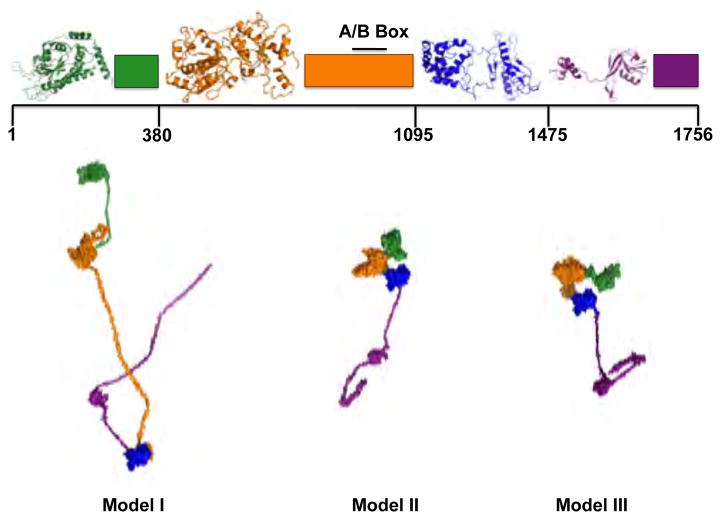
The linkers and tail for model I were generated using linear random coil chains. The linkers and tail for model II were designed to represent partially structured regions. In model II, initial models of these regions were produced using bioinformatic analyses and homology modeling informed by experimentally determined percentages of secondary structures. These structures were then subjected to a series of heating and cooling steps via simulated annealing molecular dynamics simulations. The linkers and tail for model II can therefore be viewed as mostly random with some globular nature where appropriate. Our strategy for model III was to incorporate as much globular structure as possible in the linker and tail regions based on the predictions of homology modeling. The linkers and tail for model III were those initially generated for model II prior to the application of the simulated annealing protocol. Detailed description of the model building process is described below and summarized in Table 2. Fragments of TraI (TraI 1–569, TraI 381–858, and TraI 309–1756) were created by merely removing the appropriate coordinates from the full-length models shown in Figure 2. Note that the domains used to build the full-length TraI models do not correspond directly to the TraI fragments that were studied experimentally and computationally. The domains, composed of regions and linkers as discussed in Section 3.1.1–3.1.7, were defined merely to aid the model building process.
Table 2.
Summary of model building of full-length TraI. Descriptions of acronyms are described in the text (Section 3.1.1–3.1.7).
| Domain Description | Residue Range | Sub-Range | Model I | Model II | Model III |
|---|---|---|---|---|---|
| Region I | 1–306 | 1P4D | 1P4D | 1P4D | |
| Linker I | 307–380 | random coil | globular + SA | globular | |
| Region II | 381–861 | nmr + p-recD + SA | nmr + compact p-recD + SA | nmr + compact p-recD | |
| Linker II | 862–1095 | 862–991 992–1095 |
random coil A/B box |
globular + SA A/B box + SA |
globular A/B box + SA |
| Region III | 1096–1475 | recD | recD | recD | |
| Region IV | 1476–1627 | 1476–1522 1523–1627 |
random coil 3FLD |
random coil 3FLD |
random coil 3FLD |
| Tail | 1628–1756 | 1628–1678 1679–1756 |
random coil random coil |
random coil helical + SA |
random coil helical |
Fig. 2.
Starting atomistic models used in the molecular Monte Carlo (MC) simulations of the full-length and truncated TraI constructs
3.1.1 Region I: 1–306
The coordinates of Region I were derived from the crystal structure of the TraI nickase domain(1–330) [27] (PDB ID 1P4D) as previously described [50]. For the current report the previous model was truncated after residue 306. All three models used these coordinates.
3.1.2 Linker I: 307–380
For model I this region was created as a linear random coil. Analysis of circular dichroism data collected on various constructs (see Table 3) as well as secondary structure and disorder predictions suggest that this region has some helical content. Therefore, models II and III incorporated tertiary structure prediction using Phyre [23]. The homology model with a predicted 24 % helical content was used for model III. This structure was relaxed via simulated annealing resulting in a slightly globular structure and thus was used for model II (globular + SA). The helical content was largely disrupted due to the SA protocol. NMR data [50] suggest that this linker region may be mostly random coil which is accounted for in both models I and II.
Table 3.
Comparison of experimentally observed (Obs.) and theoretical (Sim.) radius of gyration (Rg), Dm, and fractional secondary structure content of fragments of TraI (RC = random coil). I(0) values are on absolute scale. Theoretical values are shown for the best-fit structures of model III. Errors are reported as ± 1 standard deviation.
| Residue Range | I(0) Obs. | Dm (Å) Obs. | Rg (Å) Obs. | Rg (Å) Sim. | α-helix Obs. | α-helix Sim. | β-sheet Obs. | β-sheet Sim. | RC Obs. | RC Sim. |
|---|---|---|---|---|---|---|---|---|---|---|
| 1–569 | 0.11 | 136 | 37.1 ± 0.3 | 34.2 | 0.45 ± 0.02 | 0.34 | 0.14 ± 0.02 | 0.10 | 0.41 ± 0.02 | 0.56 |
| 381–858 | 0.088 | 111 | 36.9 ± 0.6 | 35.8 | 0.26 ± 0.04 | 0.22 | 0.16 ± 0.04 | 0.15 | 0.58 ± 0.04 | 0.63 |
| 309–1756 | 0.24 | 171 | 56.3 ± 0.2 | 55.4 | 0.29 ± 0.04 | 0.30 | 0.15 ± 0.09 | 0.11 | 0.56 ± 0.03 | 0.59 |
| 1–1756 | 0.34 | 173 | 54.8 ± 0.4 | 54.0 | 0.31 ± 0.08 | 0.39 | 0.12 ± 0.07 | 0.10 | 0.57 ± 0.05 | 0.51 |
3.1.3 Region II: 381–861
Structural prediction algorithms suggest that two regions within TraI adopt a fold similar to RecD [8]. The NMR solution structure of the N-terminal half of the first RecD-like region, 381–569, was recently solved [50] and confirmed the similarities in the TraI 381–569 and the corresponding region in RecD, according to DALI analysis [16]. Coordinates for 570–861 for TraI were modeled based upon a portion of the recD protein from (PDB ID 1W36), referred to herein as p-recD. Specifically, our goal was to thread residues 570–861 of TraI through coordinates of residues 314–605 of recD. First, missing residues of recD (467–523) were added using CHARMM and energy minimized. Then, the TraI sequence was threaded onto the backbone atoms of RecD over the region of interest. Repairing the recD structure resulted in a loop (TraI 719–779, recD 467–523) that was relaxed by simulated annealing and thus was used for model I (nmr + p-recD + SA). Structure prediction tools indicated that this region is mainly disordered with a small propensity for beta-sheet and helical content. Phyre was used to generate compact coordinates for 719–773 and the remaining C-terminal coordinates of that loop were set to be random coil. This was used for model III (nmr + compact p-recD). This structure was relaxed via simulated annealing and was used for model II (nmr + compact p-recD + SA).
3.1.4 Linker II: 862–1095
A partial chymotrypsin digest of full-length TraI revealed stable fragments from 1–330, 381–869, and 1096–1475 [50,49]. Thus, it is likely that the 862–1099 region, or some portion within, was likely to be dynamic. This region, however, includes the Walker A/B box for TraI. Walker boxes tend to form regular tertiary structures, thus, this region of TraI was modeled as a static globular structure. Residues 992–1094 were modeled by threading the sequence of TraI through the known coordinates of the A/B box (residues 153–298 of PDB ID 3GB8). The amino-terminal portion of this region (TraI 862–991) was either modeled as a random coil (Model I), as a globular structure predicted by Phyre (Model III), or as the Phyre model subsequently relaxed via simulated annealing (Model II). Model I was assigned coordinates directly (A/B box), while this region was relaxed via simulated annealing for model II and model III (A/B box + SA). The distinction between models II and III in this region was based on which residues that were varied (see Table 1). This allowed model II to be more flexible than model III.
3.1.5 Region III: 1096–1475
Phyre predictions show that residues 1096–1475 have the highest homology to RecD from E. coli. Limited chymotrypsin digestion has indicated that this section extremely stable. Thus, this region of TraI was modeled after RecD. Specifically, coordinates for this region were generated by homology modeling based on residues 153–600 of RecD. The C-terminal helix immediately preceding residue 466 was allowed to relax, thereby retaining the RecD fold. The resulting threaded structure was energy minimized and relaxed via a 1 ns molecular dynamics simulation. The root mean square deviation between the initial RecD coordinates and the threaded TraI region III model was less than 3 Å. These coordinates were used in all three TraI models.
3.1.6 Region IV: 1476–1627
This region was created by combining random coil structure (1476–1522) with coordinates from the X-ray crystal structure of PDB ID 3FLD [13] after adding missing residues using CHARMM (1523–1627).
3.1.7 Tail: 1628–1756
For model I this region was treated as a random coil. For models II and III residues 1628–1678 were created as random coil structures as well. Structure prediction tools predicted a slight propensity for helical content in the carboxy terminus, thus coordinates were generated for residues 1679–1756 using Phyre. The initial generated structure for the terminal residues was used for this region of model III (helical). The helical structure was relaxed via simulated annealing and was used for model II (helical + SA).
3.2 Experimental and Simulation Results
Four purified protein preparations corresponding to fragments and full-length TraI as shown in Figure 1 were studied by small-angle scattering, CD, and models described in Section 3.1 were used to compare MC simulation results to the experimental data. Several other protein preparations corresponding to Tra 1–973, 309–858, 858–973, 1141–1179 were analyzed but found not to be satisfactory for modeling due to various biochemical issues (aggregation, solubility, intermolecular interactions at low concentration, etc.).
3.2.1 Small-Angle Scattering
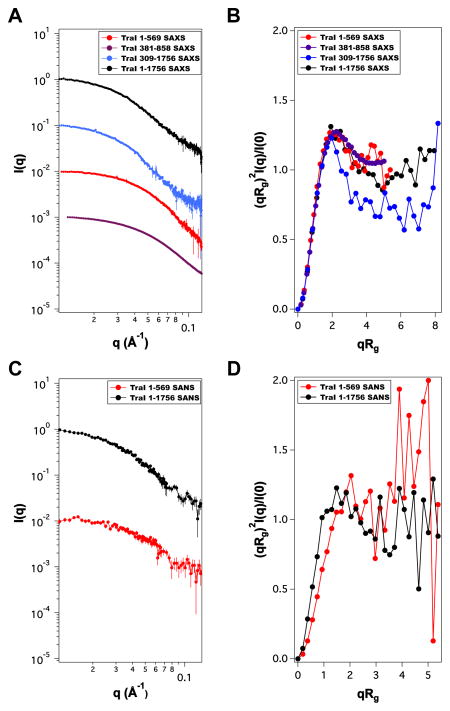
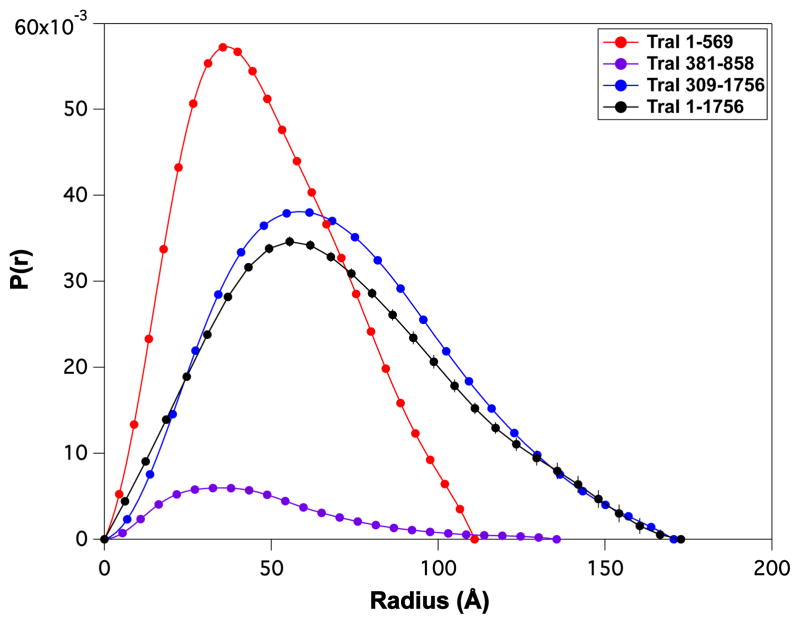
The average solution conformation of TraI constructs was measured by SAXS and SANS as shown in Figure 3. SANS data were in good agreement with SAXS measurements. There was no observable difference in the scattering profiles over the concentration ranges studied for the individual fragments indicating that the samples were monodisperse. The low-Q region of SAS scattering profiles were fit according to the Guinier approximation [12] to determine radius of gyration (Rg) values as shown in Table 3. The shorter TraI fragments (1–569 and 381–858) had lower Rg values, Rg ~ 34–37 Å, than longer TraI fragments (309–1756 and 1–1756), Rg ~ 55 – 56 Å. Kratky-plots, shown in Figure 3B and D indicate that all the TraI fragments have significant amounts of disorder. A plot of pairwise distribution, P(r), profiles is shown in Figure 4 and maximum dimensions, Dm, derived from P(r) are shown in Table 3. All TraI fragments have clear evidence of tailing in the respective P(r) profiles that is consistent with both the Rg correlations mentioned above and disorder predictions from Kratky analysis.
Fig. 3.
Small-angle x-ray and neutron scattering (SAXS & SANS) profiles for full-length and truncation constructs of TraI. (A) SAXS profiles (C) SANS profiles. (B and D) Normalized Kratky plots derived from the scattering profiles for the constructs discussed in A and C. Scattering profiles are offset for clarity. Refer to Table 3 for I(0) values. Error bars represent ± 1 standard deviation.
Fig. 4.
Pair-wise distribution, P(r), profiles for full-length and truncation constructs of TraI calculated from SAXS data shown in Figure 3.
3.3 Monte Carlo Simulations and Comparison to SAXS Experimental Data
MC simulations were performed using the starting models described in Section 3.1. Configurations were energy minimized prior to the calculation of scattering profiles. The root-mean square deviation of backbone coordinates upon energy minimization was less than 2 A as has been reported for simulation of other flexible ° proteins [5,4]. The secondary structure of the models is in reasonable agreement with experimental data shown in 3. Simulation results and comparison to experimental SAXS data are described for each of the TraI fragments and full-length TraI below. For each ensemble, theoretical scattering profiles were calculated and compared to experimental SAXS data. The quality of fit of each individual theoretical scattering profile represented by χ2, and was plotted versus the theoretical Rg for each structure. Representative SAXS profiles and model structures are shown for each case.
3.3.1 TraI 1–569
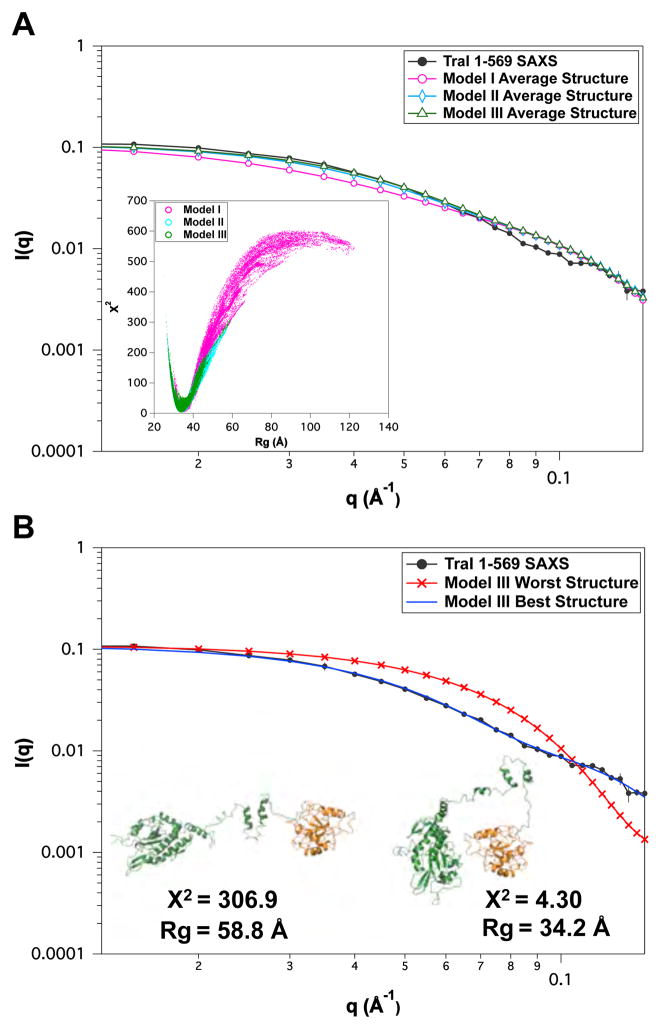
The TraI 1–569 fragment is composed of the nickase domain and a RecD-like domain connected by a region of unknown structure. The model was built using crystallographic and NMR coordinates joined by either random coil (model I), partially globular (model II), or mostly globular (model III) linker covering residues 307–378. Starting from either extended structures (model I) or more compact structures (models II and III) resulted in identical minima in the χ2 versus Rg plot (inset Figure 5). Best single structure χ2 and Rg values for the three models are shown in Table 4. Comparison of average scattering profiles for the ensemble for each model is shown in Figure 5A and the single worst and best scattering profiles and structures are shown in Figure 5B. The results indicate that the scattering profile is dominated by the compact nature of the nickase and RecD-like domains and the secondary structure of the linker region does not significantly contribute to the scattering. Kratky and CD analysis indicate that there is significant disorder in this fragment (Section 3.2.1). The three MC simulations were biased towards compact structures and the χ2 versus Rg is rather asymmetric, thus it is reasonable to conclude that this fragment is predominantly compact with a Rg ~ 34 Å. Thus the linker residues (307–378) are not in a well-defined static structure and the nickase and RecD-like domain are in close proximity although differentiation of specific preferred orientation is beyond the resolution and constraints from the scattering data.
Fig. 5.
Comparison of MC simulation results to SAXS for TraI 1–569. (A) Experimental SAXS data and the average theoretical scattering profiles for the MC ensembles derived for Models I–III. The inset of (A) shows the χ2 versus Rg plots for each of the three MC simulations. (B) Overlay of experimental SAXS data and theoretical scattering profiles of the best and worst structures, as determined by χ2, for Model III. Representative cartoon representations of the best and worst Model III structures are shown in (B). Error bars represent ± 1 standard deviation.
Table 4.
Theroetical best χ2 and Rg values for each starting model type for fragments of TraI. For TraI 381–858, (A)–(C) correspond to simulation results shown in Figures 6–8. na = not applicable, nd = not done; see text for details.
| Residue Range | Model I χ2 / Rg (Å) |
Model II χ2 / Rg (Å) |
Model III χ2 / Rg (Å) |
|---|---|---|---|
| 1–569 | 3.92 / 33.9 | 3.99 / 34.2 | 4.30 / 34.2 |
| 381–858 (A) | 2260 / 28.3 | 5100 / 25.3 | 4580 / 25.8 |
| 381–858 (B) | 1400 / 35.1 | 4400 / 25.6 | na |
| 381–858 (C) | 5.31 / 35.8 | 196 / 32.6 | nd |
| 309–1756 | 13.5 / 58.4 | 6.40 / 55.2 | 5.80 / 55.4 |
| 1–1756 | 1.60 / 54.4 | 1.30 / 53.7 | 1.40 / 54.0 |
3.3.2 TraI 381–858
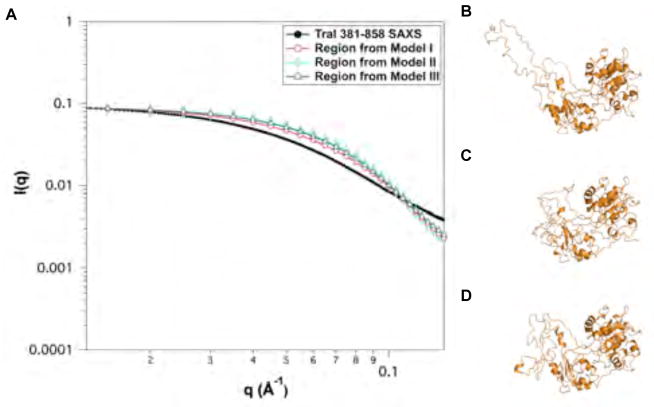
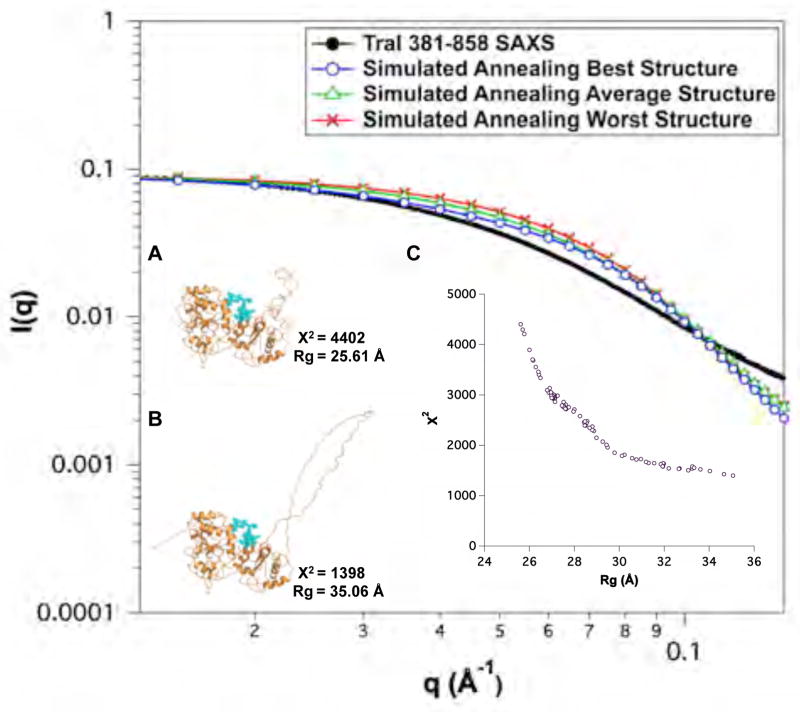
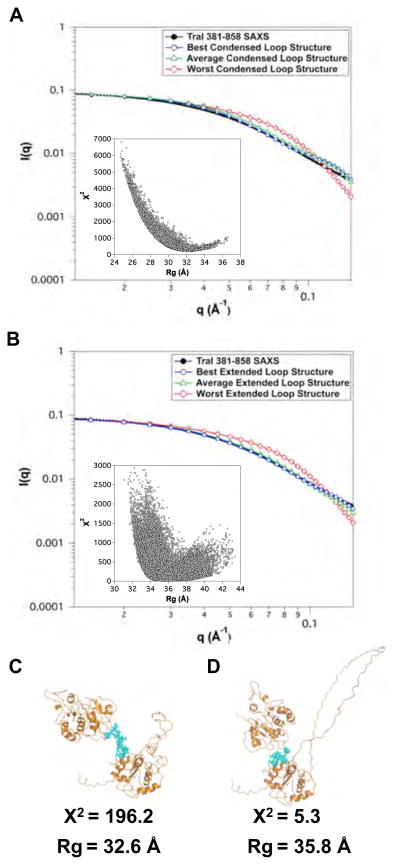
The TraI 381–858 fragment is essentially identical to the region II domain used to construct full-length TraI and contains the ssDNA binding motif. It was generated by combining the coordinates determined by NMR (381–569) with the remaining residues modeled based on partial homology to recD. This latter region contained a loop of unknown structure (719–779). Thus, compared to other regions of TraI the initial model for this fragment was of lower initial quality. One of the goals of building up a model of full-length TraI was to evaluate structural results by comparison of intermediate models to experimental data and thus adapt the models based on knowledge gained in the process. Of course, one could argue that the structure in a fragment is not necessarily maintained in other shorter or longer fragments, including full-length TraI. Since the structure of the 719–779 loop was unknown, three different structures were generated as shown in Figure 6B–D. The loop in model I was extended, while it was more compact in models II and III. The quality of fit to the experimental SAXS data as shown in Figure 6A and Table 4 was poor for all three models. The more compact models (II and III) had larger error than the extended model (I). Analysis of the original SA trajectory, as shown in Figure 7, indicated that intermediate structures between the compact model II and extended model I were not present in the trajectory. Thus the structure of TraI 381–858 is more extended than can be accounted for in the original models for this fragment. Examination of the model structure indicated that several residues lacked secondary structure (612–626) and were then chosen as angles to vary in a MC simulations. Simulations were performed using the original starting models I and II, where model I contained the extended loop and model II contained a compact loop. The results of the simulations are shown in Figure 8. Reasonable agreement with the experimental SAXS data was obtained from the MC simulation of the extended loop structure. This indicates that the initial homology model was too compact and that the domains 381–611 and 627–858 are further apart that originally predicted. While the extended loop is perhaps speculative this structure was incorporated into the initial starting models for the longer fragments (TraI 309–1756 and 1–1756) discussed below. The fact that we were unable to model this region as compact and our analysis required the incorporation of a disordered loop to fit the experimental data is consistent with both the Kratky and CD analysis presented in Section 3.2.1 and Table 3.
Fig. 6.
Comparison of homology models from simulated annealing (SA) for models I–III of TraI 381–858. (A) Theoretical scattering profiles of models I–III and experimental SAXS data. (B)–(D) Cartoon representation of Models I–III of TraI 381–858. Error bars represent ± 1 standard deviation.
Fig. 7.
Analysis of selected structures from a SA trajectory of TraI 381–858. Theoretical scattering profiles of the best, worst and average fit to the experimental SAXS data. Inset: (A) Cartoon representation of the worst-fit structure from the SA simulation. (B) Cartoon representation of the best-fit structure, the starting structure for the SA simulation. (C) χ2 versus Rg plot of 80 selected structures from a SA simulation carried out to relax the extended loop region in the TraI 381–858 displayed in Figure 6. The blue linker region shown in stick representation highlights a linker region (612–626) within the model that was not varied in this simulation. Error bars in A & B represent ± 1 standard deviation.
Fig. 8.
Monte Carlo simulations of two SA-derived structures of TraI 381–858. (A) χ2 versus Rg plot of the worst-fit SA structure from Figure 7A). (B) Overly of the fit of the ensemble in (A) to experimental data with the best, worst and average theoretical scattering profiles shown in circles, triangles and squares, respectively. (C) χ2 versus Rg plot of the best-fit SA structure from Figure 7B). (D) Overly of the fit of the ensemble in (C) to experimental data with the best, worst and average theoretical scattering profiles shown in circles, triangles and squares, respectively. (E) and (F) are cartoon representations of the best-fit structures for the ensembles in (A) and (C), respectively. For both (A) and (C), amino acid residues (blue), residues 612–626, were varied in the MC simulations. Error bars in B & D represent ± 1 standard deviation.
3.3.3 TraI 309–1756
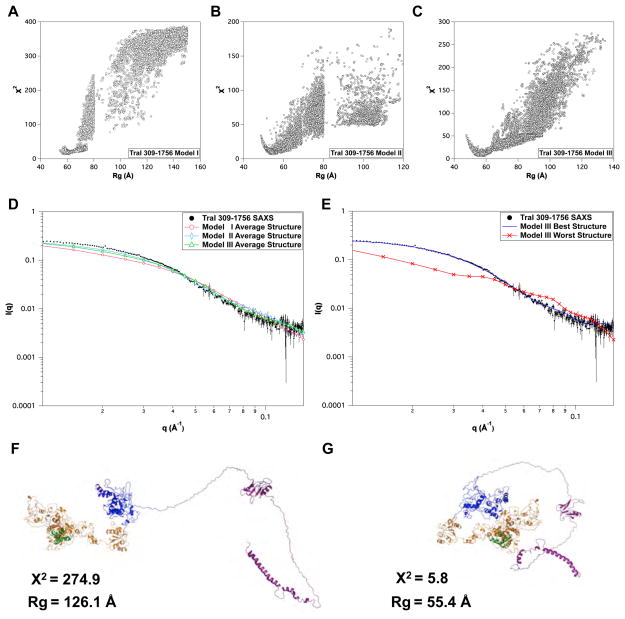
This TraI fragment is only missing the N-terminal nickase domain compared to full-length TraI and each model type contains the extended, partially globular, and mostly globular domains as described above. There were several long regions of disordered residues that were sampled as shown in Table 2. Starting from either extended structures (model I) or more compact structures (models II and III) resulted in similar minima in the χ2 versus Rg plot shown in Figure 9A–C. The more extended structures required directed Monte Carlo steps to increase sampling of smaller structures as seen in the discontinuities in Figure 9A–B. Best single structure χ2 and Rg values for the three models are shown in Table 4. Comparison of average scattering profiles for the ensemble for each model is shown in Figure 9D and the single worst and best scattering profiles and structures are shown in Figure 9E. The agreement between the scattering profile for the best structures for model III and the experimental SAXS data is good over the entire Q-range. In all three cases the average structures were a poor fit to the experimental SAXS data and the best fitting structures had compact shapes with Rg values near 55 Å. The fact that there is a single minimum and an asymmetric χ2 versus Rg plot indicates that the structure is predominately compact yet contains a large degree of disorder as determined by Kratky and CD analysis presented in Section 3.2.1 and Table 3.
Fig. 9.
Comparison of MC simulations of TraI 309–1756. χ2 versus Rg plots for (A) Model I, (B) Model II and (C) Model III. (D) The overlay of experimental SAXS data and the average theoretical scattering profiles for the MMC ensembles derived for Models I–III. (E) Overlay of experimental data and theoretical scattering profiles of the best and worst structures, as judged by χ2, for Model III. (F) and (G) are the cartoon representations of the best and worst Model III structures, respectively. Error bars in D & E represent ± 1 standard deviation.
3.3.4 TraI 1–1756
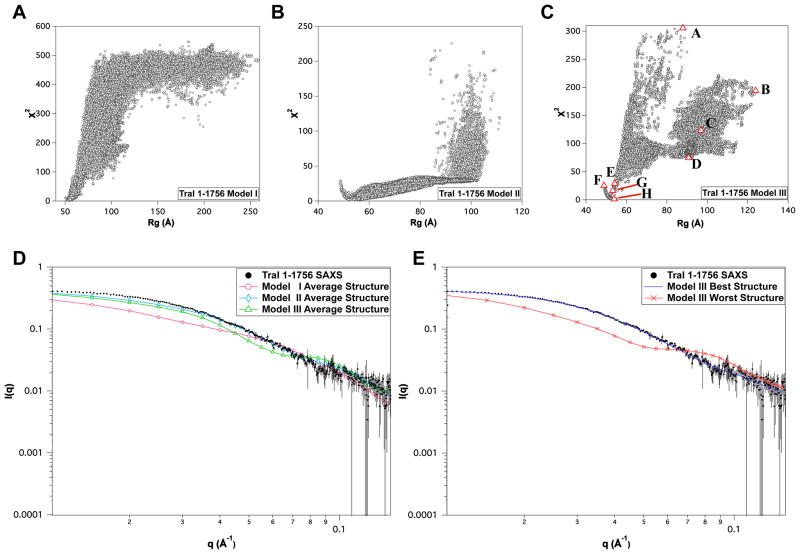
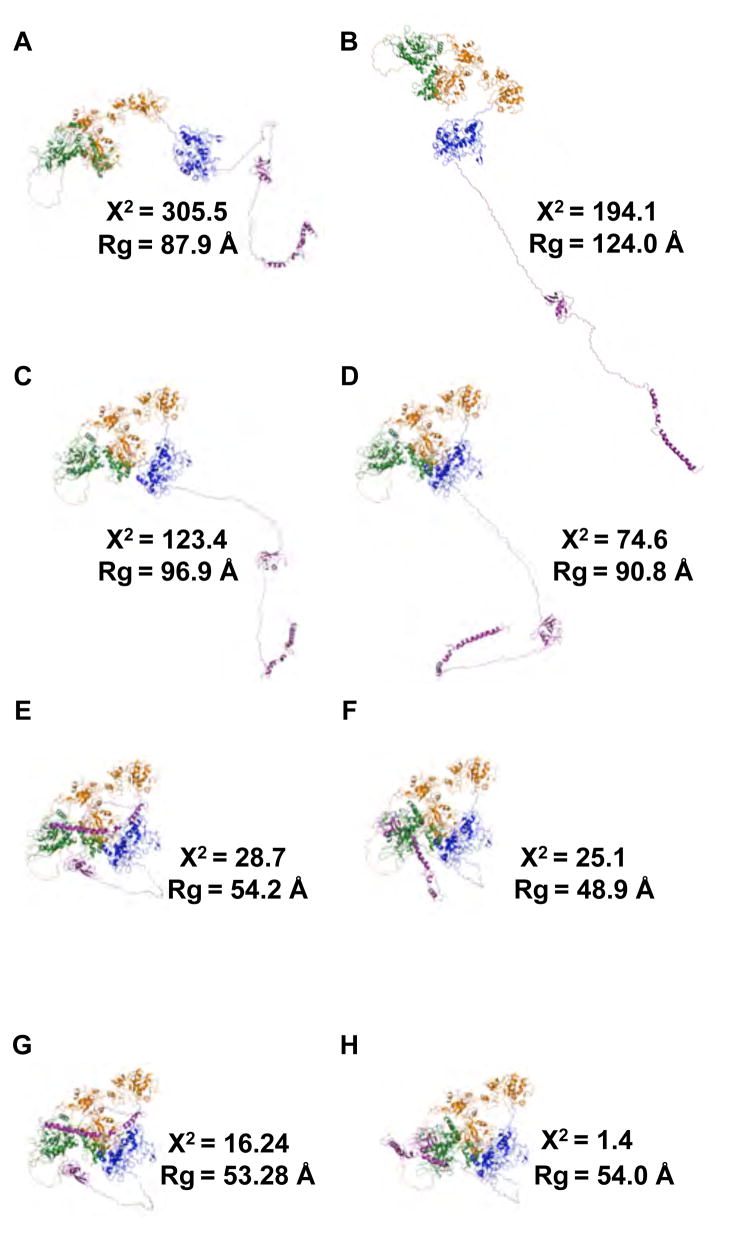
Full-length TraI (1–1756) contains the structured N-terminal nickase domain missing from TraI 309–1756. Starting from either extended structures (model I) or more compact structures (models II and III) resulted in similar minima in the χ2 versus Rg plot shown in Figure 10A–C. Although, one can see that for all three models the quality of fit of structures with large Rg values is quite poor and the profiles indicate a single minima in each case. Comparison of average scattering profiles for the ensemble for each model is shown in Figure 10D and the single worst and best scattering profiles and structures are shown in Figure 10E. The agreement between the scattering profile for the best structures for model III and the experimental SAXS data is good over the entire Q-range. In all three cases the average structures were a poor fit to the experimental SAXS data and that the best fitting structures had compact shapes with Rg values near 55 Å. As was found for TraI 309–1756, full-length TraI 1–1756 is compact and yet contains large regions of disordered residues as determined by Kratky and CD analysis presented in Section 3.2.1 and Table 3. In Figure 12 a iso-density plots are shown that illustrates physical space covered in the MC simulation of full-length TraI model III. Thus the ensemble of best-fit structures occupy a fraction of the entire space that could be occupied by the full-length structure. Representative structures from the model III ensemble as depicted in Figure 10C are shown in Figure 11. Inspection of individual structures with Rg values near the experimentally determined value (~ 54 Å) yield both poor and good individual fits to the SAXS data. For example, Figure 12E,G and H have nearly identical Rg values yet the structure in H fits the data with >10-fold lower χ2. This indicates that precise arrangements between the domains may exist but it is perhaps beyond the resolution of scattering data to be entirely conclusive as further restraints are required to rule out linear combinations of structures that may exist in solution.
Fig. 10.
Comparison of MC simulations of full-length TraI 1–1756. χ2 versus Rg plots for (A) Model I, (B) Model II and (C) Model III. Eight selected structures, structures A–H, with various Rg and χ2 values are represented by red-bordered triangles and shown in Figure 12. (D) Overlay of experimental SAXS data and the average theoretical scattering profiles for the MC ensembles derived for Models I–III. (E) Overlay of the experimental SAXS data and the theoretical scattering profiles of the best and worst structures, as judged by χ2 -value, for Model III. Error bars in D & E represent ± 1 standard deviation.
Fig. 12.
Gallery of possible solution structures from Model III of TraI 1–1756. (A)–(H) are cartoon representations of selected structures from the TraI 1–1756 Model III ensemble, highlighted in Figure 10. For each structure, the associated Rg and χ2-values are shown. Letters correspond to those denoted in Figure 10.
Fig. 11.
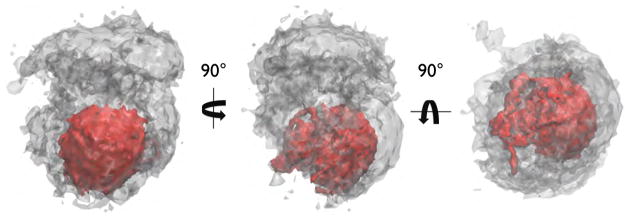
Iso-density plots of TraI 1–1756. Grey iso-density represents the physical space occupied by the entire ensemble of 95196 structures. The red iso-density represents the best-fit structures, i.e. those structures with a χ2-value of ≤ 5 (28044 structures).
3.4 Discussion
The analysis reveals that models with compact TraI structures are in much better agreement with the scattering data than models with more extended conformations. The compact TraI structure in solution occurs despite evidence that regions in the protein are flexible or unfolded. This observation is in keeping with results for the TraI (1–569) fragment [50]. In TraI (1–569), the nickase domain (1–309) and part of the ssDNA binding domain (389–569) are positioned close together in space despite being linked by an apparently highly flexible or unfolded linker region. The proximity of the domains occurs even though we were unable to detect significant direct interactions between the two domains, suggesting that the flexible linker region may have sufficient secondary structure to keep the domains proximal.
Our results for TraI generally agree with the TraI molecular envelope calculated from SAXS data by Cheng and colleagues [3]. This envelope is compact and has a volume sufficient to contain most of the TraI molecule. These authors went on to fit known or modeled structures of TraI domains into the envelope to generate a molecular model of the intact protein. Thus SAXS data and two different analytical approaches have yielded models of TraI that could conceivably be used to explain observed TraI behavior. While the results from our analysis have converged on a series of similar solutions featuring compact structures, the models may not be sufficiently detailed or accurate to serve as the basis for a molecular explanation of, for example, the apparent negative cooperativity that causes binding of ssDNA to the nickase domain to prevent binding of ss-DNA to the helicase site and vice versa [9].
The results from our analysis thus may represent too great a diversity in reasonable but distinct solutions to allow for the detailed analysis that would provide the greatest insight into the function of the TraI protein. We have, however, reduced the number of solutions from thousands that span a large volume structure space into a relative handful of possible structures the occupy a smaller volume than that available to the protein. This collection of solutions therefore is the starting point for additional studies to further screen and ultimately refine our models. We will use these results as the basis of biochemical studies to, for example, better determine the relative orientation of domains or the ss-DNA binding sites within the relaxase and the helicase.
3.5 Summary
Models of TraI (1–569, 381–858, 309–1756, and 1–1756) were built and MC simulations were performed on the fragments. SAXS scattering profiles were generated from the ensembles and compared to experimental data. While the TraI fragments all contained a significant amount of disorder as determined by CD and SAS, our MC simulation protocol was able to determine reasonable models for all of the fragments. This thorough and systematic approach led to the conclusion that full-length TraI (1–1756) exists as a compact set of structures in solution. Further structural and chemical constraints are required to refine the models to further elucidate structure function relationships.
Acknowledgments
This material is based upon work supported by the National Science Foundation under CHE-1265817.
Footnotes
Certain commercial equipment, instruments, materials, suppliers, or software are identified in this paper to foster understanding. Such identification does not imply recommendation or endorsement by the National Institute of Standards and Technology, nor does it imply that the materials or equipment identified are necessarily the best available for the purpose.
Contributor Information
Nicholas J. Clark, NIST Center for Neutron Research, National Institute of Standards and Technology, 100 Bureau Drive, Mail Stop 6102, Gaithersburg, Maryland 20899, USA, Tel: 301-975-3959, Fax: 301-921-9847
Madushi Raththagala, Department of Molecular and Cellular Biochemistry, Biomedical and Biological Sciences Research Building, University of Kentucky, 741 S Limestone Avenue, Lexington, KY 40536.
Nathan T. Wright, James Madison University, Physics and Chemistry Building, Rm 1174, Harrisonburg VA 22807
Elizabeth A. Buenger, Department of Biology, Johns Hopkins University, 3400 N. Charles St., Baltimore, Maryland 21218
Joel F. Schildbach, Department of Biology, Johns Hopkins University, 3400 N. Charles St., Baltimore, Maryland 21218
Susan Krueger, NIST Center for Neutron Research, National Institute of Standards and Technology, 100 Bureau Drive, Mail Stop 6102, Gaithersburg, Maryland 20899, USA, Tel: 301-975-3959, Fax: 301-921-9847.
Joseph E. Curtis, Email: joseph.curtis@nist.gov, NIST Center for Neutron Research, National Institute of Standards and Technology, 100 Bureau Drive, Mail Stop 6102, Gaithersburg, Maryland 20899, USA, Tel: 301-975-3959, Fax: 301-921-9847
References
- 1.Barlow M. What antimicrobial resistance has taught us about horizontal gene transfer. Methods Mol Biol. 2009;532:397–411. doi: 10.1007/978-1-60327-853-9_23. [DOI] [PubMed] [Google Scholar]
- 2.Brooks BR, Bruccoleri RE, Olafson BD, States DJ, Swaminathan S, Karplus M. Charmm: A program for macromolecular energy, minimization, and dynamics calculations. Journal of Computational Chemistry. 1983;4(2):187–217. http://dx.doi.org/10.1002/jcc.540040211. [Google Scholar]
- 3.Cheng Y, McNamara DE, Miley MJ, Nash RP, Redinbo MR. Functional characterization of the multidomain f plasmid trai relaxase-helicase. J Biol Chem. 2011;286(14):12,670–12,682. doi: 10.1074/jbc.M110.207563. [DOI] [PMC free article] [PubMed] [Google Scholar]
- 4.Clark NJ, Zhang H, Krueger S, Lee HJ, Ketchem RR, Kerwin B, Kanapuram SR, Treuheit MJ, McAuley A, Curtis JE. Small-Angle Neutron Scattering Study of a Monoclonal Antibody Using Free-Energy Constraints. J Phys Chem B. 2013 doi: 10.1021/jp408710r. [DOI] [PubMed] [Google Scholar]
- 5.Curtis JE, Raghunandan S, Nanda H, Krueger S. Sassie: a program to study intrinsically disordered biological molecules and macromolecular ensembles using experimental scattering restraints. Comp Phys Comm. 2012;183(2):382–389. [Google Scholar]
- 6.Datta S, Larkin C, Schildbach JF. Structural insights into single-stranded dna binding and cleavage by f factor trai. Structure. 2003;11(11):1369–1379. doi: 10.1016/j.str.2003.10.001. [DOI] [PubMed] [Google Scholar]
- 7.De La Cruz F, Frost LS, Meyer RJ, Zechner EL. Conjugative dna metabolism in gram-negative bacteria. FEMS Microbiol Rev. 2010;34(1):18–40. doi: 10.1111/j.1574-6976.2009.00195.x. [DOI] [PubMed] [Google Scholar]
- 8.Dostal L, Schildbach JF. Single-stranded dna binding by f trai relaxase and helicase domains is coordinately regulated. J Bacteriol. 2010;192(14):3620–3628. doi: 10.1128/JB.00154-10. [DOI] [PMC free article] [PubMed] [Google Scholar]
- 9.Dostal L, Shao S, Schildbach JF. Tracking f plasmid trai relaxase processing reactions provides insight into f plasmid transfer. Nucleic Acids Res. 2011;39(7):2658–2670. doi: 10.1093/nar/gkq1137. [DOI] [PMC free article] [PubMed] [Google Scholar]
- 10.Fukada H, Ohtsubo E. Roles of trai protein with activities of cleaving and rejoining the single-stranded dna in both initiation and termination of conjugal dna transfer. Genes Cells. 1997;2(12):735–751. doi: 10.1046/j.1365-2443.1997.1580356.x. [DOI] [PubMed] [Google Scholar]
- 11.Garnier J, Osguthrope DJ, Robson B. Analysis of the accuracy and implications of simple methods for predicting the secondary structure of globular proteins. J Mol Biol. 1978;120:97–120. doi: 10.1016/0022-2836(78)90297-8. [DOI] [PubMed] [Google Scholar]
- 12.Guinier A, Fournet G. Small angle scattering of X-rays. Wiley; 1955. [Google Scholar]
- 13.Guogas LM, Kennedy SA, Lee JH, Redinbo MR. A novel fold in the trai relaxase-helicase c-terminal domain is essential for conjugative dna transfer. J Mol Biol. 2009;386(2):554–568. doi: 10.1016/j.jmb.2008.12.057. [DOI] [PMC free article] [PubMed] [Google Scholar]
- 14.Heidorn DB, Trewhella J. Comparison of the crystal and solution structures of calmodulin and troponin c. Biochemistry. 1988;27:909–915. doi: 10.1021/bi00403a011. [DOI] [PubMed] [Google Scholar]
- 15.Hirose S, Shimizu K, Kanai S, Kuroda Y, Noguchi T. Poodle-l: a two-level svm prediction system for reliably predicting long disordered regions. Bioinformatics. 2007;23 (16):2046–2053. doi: 10.1093/bioinformatics/btm302. [DOI] [PubMed] [Google Scholar]
- 16.Holm L, CS Protein structure comparison by alignment of distance matrices. J Mol Biol. 1993;233(1):123–138. doi: 10.1006/jmbi.1993.1489. [DOI] [PubMed] [Google Scholar]
- 17.Howard MT, Nelson WC, Matson SW. Stepwise assembly of a relaxosome at the f plasmid origin of transfer. J Biol Chem. 1995;270(47):28,381–28,386. [PubMed] [Google Scholar]
- 18.Humphrey W, Dalke A, Schulten K. VMD – Visual Molecular Dynamics. Journal of Molecular Graphics. 1996;14:33–38. doi: 10.1016/0263-7855(96)00018-5. [DOI] [PubMed] [Google Scholar]
- 19.Inamoto S, Fukada H, Abo T, Ohtsubo E. Site- and strand-specific nicking at orit of plasmid r100 in a purified system: enhancement of the nicking activity of trai (helicase i) with tray and ihf. J Biochem (Tokyo) 1994;116(4):838–844. doi: 10.1093/oxfordjournals.jbchem.a124604. [DOI] [PubMed] [Google Scholar]
- 20.Jones DT. Protein secondary structure prediction based on position-specific scoring matrices. J Mol Biol. 1999;292:195–202. doi: 10.1006/jmbi.1999.3091. [DOI] [PubMed] [Google Scholar]
- 21.Jorgensen WL, Chandrasekhar J, Madura JD, Impey RW, Klein ML. Comparison of simple potential functions for simulating liquid water. J Chem Phys. 1983;79:926–935. [Google Scholar]
- 22.Karl W, Bamberger M, Zechner EL. Transfer protein tray of plasmid r1 stimulates trai-catalyzed orit cleavage in vivo. J Bacteriol. 2001;183(3):909–914. doi: 10.1128/JB.183.3.909-914.2001. [DOI] [PMC free article] [PubMed] [Google Scholar]
- 23.Kelly LA, Sternberg MJE. Protein structure prediction on the web: a case study using the phyre server. Nat Protoc. 2009;4:363–371. doi: 10.1038/nprot.2009.2. [DOI] [PubMed] [Google Scholar]
- 24.Kline SR. Reduction and analysis of sans and usans data using igor pro. J Appl Crystallog. 2006;39:895–900. [Google Scholar]
- 25.Krueger S, Gorshkova I, Brown J, Hoskins J, McKenney KH, Schwarz FP. Determination of the conformations of camp receptor protein and its t127l,s128a mutant with and without camp from small angle neutron scattering measurements. J Biol Chem. 1998;273:20,001–20,006. doi: 10.1074/jbc.273.32.20001. [DOI] [PubMed] [Google Scholar]
- 26.Lang S, Gruber K, Mihajlovic S, Arnold R, Gruber CJ, Steinlechner S, Jehl MA, Rattei T, Frohlich KU, Zechner EL. Molecular recognition determinants for type iv secretion of diverse families of conjugative relaxases. Mol Microbiol. 2010;78(6):1539–1555. doi: 10.1111/j.1365-2958.2010.07423.x. [DOI] [PubMed] [Google Scholar]
- 27.Larkin C, Datta S, Harley MJ, Anderson BJ, Ebie A, Hargreaves V, Schildbach JF. Inter- and intramolecular determinants of the specificity of single-stranded dna binding and cleavage by the f factor relaxase. Structure. 2005;13(10):1533–1544. doi: 10.1016/j.str.2005.06.013. [DOI] [PubMed] [Google Scholar]
- 28.Linding R, Jensen LJ, Diella F, Bork P, Gibson TJ, Russell RB. Protein disorder prediction: implications for structural proteomics. Structure. 2003;11(11):1453–1459. doi: 10.1016/j.str.2003.10.002. [DOI] [PubMed] [Google Scholar]
- 29.Lu J, Edwards RA, Manchak J, Frost LS, Glover JN. Structural basis of specific trad-tram recognition during f plasmid-mediated bacterial conjugation. Mol Microbiol. 2008;70(1):89–99. doi: 10.1111/j.1365-2958.2008.06391.x. [DOI] [PubMed] [Google Scholar]
- 30.Lu J, Edwards RA, Wong JJ, Manchak J, Scott PG, Frost LS, Glover JN. Protonation-mediated structural flexibility in the f conjugation regulatory protein, tram. EMBO J. 2006;25(12):2930–2939. doi: 10.1038/sj.emboj.7601151. [DOI] [PMC free article] [PubMed] [Google Scholar]
- 31.Lu J, Frost LS. Mutations in the c-terminal region of tram provide evidence for in vivo tram-trad interactions during f-plasmid conjugation. J Bacteriol. 2005;187(14):4767–4773. doi: 10.1128/JB.187.14.4767-4773.2005. [DOI] [PMC free article] [PubMed] [Google Scholar]
- 32.MacKerell AD, Jr, Bashford D, Bellott M, Jr, RLD, Evanseck JD, Field MJ, Fischer S, Gao J, Guo H, Ha S, Joseph-McCarthy D, Kuchnir L, Kuczera K, Lau FTK, Mattos C, Michnick S, Ngo T, Nguyen DT, Prodhom B, Reiher WEI, Roux B, Schlenkrich M, Smith JC, Stote R, Straub J, Watanabe M, Wiorkiewicz-Kuczera J, Yin D, Karplus M. All-atom empirical potential for molecular modeling and dynamics studies of proteins. Journal of Physical Chemistry B. 1998;102:3586–3616. doi: 10.1021/jp973084f. [DOI] [PubMed] [Google Scholar]
- 33.Matson SW, Nelson WC, Morton BS. Characterization of the reaction product of the orit nicking reaction catalyzed by escherichia coli dna helicase i. J Bacteriol. 1993;175(9):2599–2606. doi: 10.1128/jb.175.9.2599-2606.1993. [DOI] [PMC free article] [PubMed] [Google Scholar]
- 34.Matson SW, Ragonese H. The f-plasmid trai protein contains three functional domains required for conjugative dna strand transfer. J Bacteriol. 2005;187(2):697–706. doi: 10.1128/JB.187.2.697-706.2005. [DOI] [PMC free article] [PubMed] [Google Scholar]
- 35.Mihajlovic S, Lang S, Sut MV, Strohmaier H, Gruber CJ, Koraimann G, Cabezon E, Moncalian G, De La Cruz F, Zechner EL. Plasmid r1 conjugative dna processing is regulated at the coupling protein interface. J Bacteriol. 2009;191(22):6877–6887. doi: 10.1128/JB.00918-09. [DOI] [PMC free article] [PubMed] [Google Scholar]
- 36.Nelson WC, Howard MT, Sherman JA, Matson SW. The tray gene product and integration host factor stimulate escherichia coli dna helicase i-catalyzed nicking at the f plasmid orit. J Biol Chem. 1995;270(47):28,374–28,380. [PubMed] [Google Scholar]
- 37.Nielsen JE, Noergaard Toft K, Snakenborg D, Jeppesen MG, Jacobsen JK, Vestergaard B, Kutter JP, Arleth L. Bioxtas raw, a software program for high-throughput automated small-angle x-ray scattering data reduction and preliminary analysis. J Appl Crystallog. 2009;42:959–964. [Google Scholar]
- 38.Ochman H, Lawrence JG, Groisman EA. Lateral gene transfer and the nature of bacterial innovation. Nature. 2000;405(6784):299–304. doi: 10.1038/35012500. [DOI] [PubMed] [Google Scholar]
- 39.Prevelige P, Fasman GD. Chou-Fasman Prediction of the Secondary Structure of Proteins: The Chou-Fasman-Prevelige Algorithm. Vol. 9. Plenum Press; New York: 1989. pp. 391–416. [Google Scholar]
- 40.Provencher SW, Glöckner J. Estimation of globular protein secondary structure from circular dichroism. Biochemistry. 1981;20:33–37. doi: 10.1021/bi00504a006. [DOI] [PubMed] [Google Scholar]
- 41.Qian N, Sejnowski TJ. Predicting the secondary structure of globular proteins using neural network models. J Mol Biol. 1988;202:865–884. doi: 10.1016/0022-2836(88)90564-5. [DOI] [PubMed] [Google Scholar]
- 42.Shimizu K, Hirose S, Noguchi T. Poodle-s: web application for predicting protein disorder by using physicochemical features and reduced amino acid set of a positioin-specific matrix. Bioinformatics. 2007;23(17):2337–2338. doi: 10.1093/bioinformatics/btm330. [DOI] [PubMed] [Google Scholar]
- 43.Stern JC, Schildbach JF. Dna recognition by f factor trai36: Highly sequence-specific binding of single-stranded dna. Biochemistry. 2001;40(38):11,586–11,595. doi: 10.1021/bi010877q. [DOI] [PubMed] [Google Scholar]
- 44.Street LM, Harley MJ, Stern JC, Larkin C, Williams SL, Dohm JA, Schildbach JF. Subdomain organization and catalytic residues of the f factor trai relaxase domain. Biochim Biophys Acta. 2003;1646(1–2):86–99. doi: 10.1016/s1570-9639(02)00553-8. [DOI] [PubMed] [Google Scholar]
- 45.Svergun DI. Determination of the regularization parameter in indirect-transform methods using perceptual criteria. J Appl Crystallog. 1992;25:495–503. [Google Scholar]
- 46.Svergun DI, Barberato C, Koch MHJ. Crysol - a program to evaluate x-ray solution scattering of biological macromolecules from atomic coordinates. J Appl Cryst. 1995;28:768–773. [Google Scholar]
- 47.Tenover FC. Mechanisms of antimicrobial resistance in bacteria. Am J Infect Control. 2006;34:S3–10. doi: 10.1016/j.ajic.2006.05.219. [DOI] [PubMed] [Google Scholar]
- 48.Wirth T, Falush D, Lan R, Colles F, Mensa P, Wieler LH, Karch H, Reeves PR, Maiden MC, Ochman H, Achtman M. Sex and virulence in escherichia coli: an evolutionary perspective. Mol Microbiol. 2006;60(5):1136–1151. doi: 10.1111/j.1365-2958.2006.05172.x. [DOI] [PMC free article] [PubMed] [Google Scholar]
- 49.Wright NT, Majumdar A, Schildbach JF. Chemical Shift Assignments for F-Plasmid (381–569) Biomol NMR Assign. 2011;5(1):67–70. doi: 10.1007/s12104-010-9269-y. [DOI] [PMC free article] [PubMed] [Google Scholar]
- 50.Wright NT, Raththagala M, Hemmis CW, Edwards S, Curtis JE, Krueger S, Schildbach JF. Solution structure and small angle scattering analysis of trai (381–569) Proteins. 2012;80(9):2250–2261. doi: 10.1002/prot.24114. [DOI] [PMC free article] [PubMed] [Google Scholar]


