Abstract
Dendrimer chemistries have virtually exploded in recent years with increasing interest in this class of Polymers as gene delivery vehicles. An effective nucleic acid delivery vehicle must efficiently bind its cargo and form physically stable complexes. Most importantly, the nucleic acid must be protected in biological fluids and tissues, as RNA is extremely susceptible to nuclease degradation. Here, we characterized the association of nucleic acids with generation 4 PEGylated Poly(amidoamine)dendrimer (mPEG-PAMAM-G4). We investigated the formation, size, and stability over time of the nanoplexes at various N/P ratios by gel shift and dynamic light scatter spectroscopy (DLS). Further characterization of the mPEG-PAMAM-G4:nucleic acid association was provided by atomic force microscopy (AFM) and by circular dichroism (CD). Importantly, mPEG-PAMAM-G4 complexation protected RNA from treatment with RNase A, degradation in serum and various tissue homogenates. mPEG-PAMAM-G4 complexation also significantly enhanced the functional delivery of RNA in a novel engineered human melanoma cell line with splice-switching oligonucleotides (SSOs) targeting a recombinant luciferase transcript. mPEG-PAMAM-G4 triconjugates formed between gold nanoparticle (GNP) and particularly manganese oxide (MnO) nanorods, Poly IC, an anti-cancer RNA, showed enhanced cancer-killing activity by an MTT (3-(4,5-dimethylthiazol-2-yl)-2,5-diphenyltetrazolium bromide) cell viability assay.
Keywords: Dendrimer, PAMAM, mPEG-PAMAM-G4, RNA, nanoparticles, nanoconjugates, Poly IC, Splice Switching Oligomer (SSO)
INTRODUCTION
Dendrimers are well-defined, highly branched, synthetic three-dimensional molecules with a large number of reactive end groups.1 It is because of such characteristics that these monodisperse macromolecules are studied for their possible role as nucleic acid delivery vehicles.2–5 Poly(amidoamine) (PAMAM) dendrimers were the first complete dendrimer family to be synthesized, characterized and commercialized.6 Although their cytotoxicity is well known, PAMAM dendrimers are among the most studied for their high transfection efficiency.7–12 Due to their ability to bind DNA and RNA, these unique compounds have been studied as gene delivery agents.10,11 The structure of dendrimers is critical to their intended function. PEGylation has been reported to decrease the cytotoxicity of the PAMAM polymer while increasing its biocompatibility, cell penetration ability, and physical stability.13–19
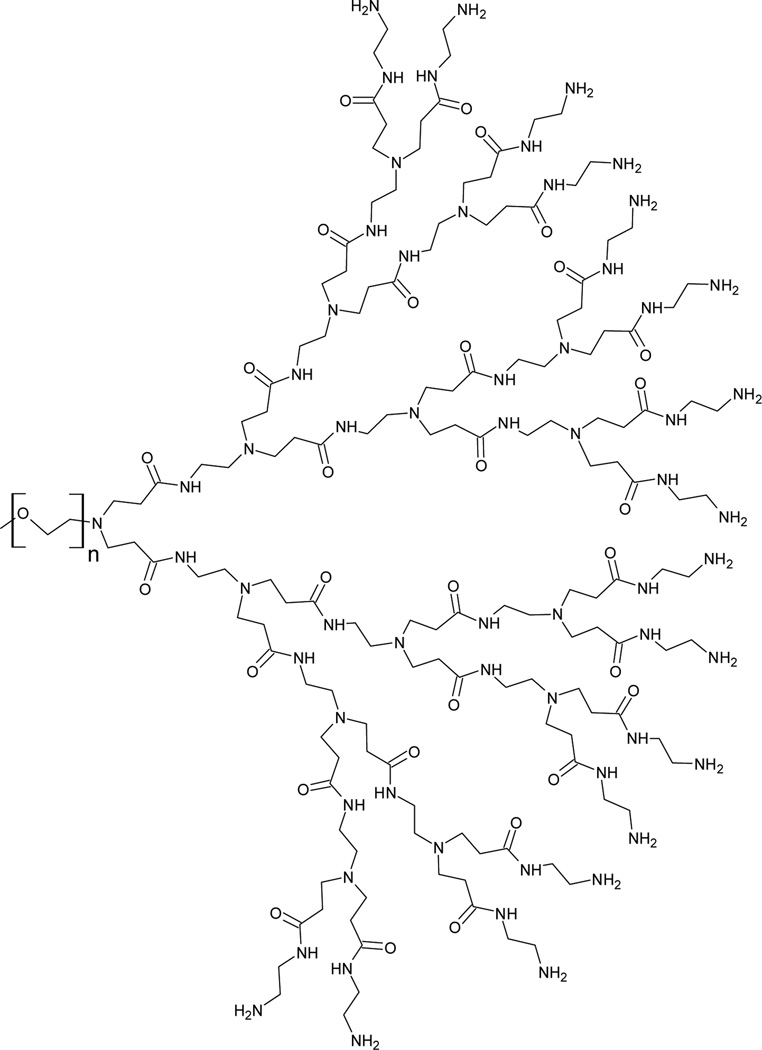
Here we characterize the interaction, stabilization and delivery of nucleic acids with mPEG-PAMAM-G4 (Generation 4) dendrimer shown below (Figure 1): Binding of DNA and RNA by polymeric delivery agents is typically investigated via a gel shift, where a change in the migration pattern of the nucleic acid as a function of complexation is generally observed. Also, the size of these nanoplexes is standardly characterized by dynamic light scattering (DLS).20 Here, the effects of 10:1, 5:1, 1:1, 1:2.5 (0.4) and 1:5 (0.2) N/P ratios (N referring to the number of 3° and 1° amino groups on the dendrimer, and P referring to number of phosphate groups on RNA) were carefully investigated by these parameters. DNA condensation and RNA particle formation by dendrimer complexation has been reported, 21 and can be directly visualized by atomic force microscopy (AFM) imaging utilized here as well.
Figure 1.
Molecular structure of mPEG-PAMAM-G4.
Aggregation and instability are two common complications for polymer-based nucleic acid delivery. For example, previously we surface functionalized PAMAM with TAT peptide from HIV for enhanced delivery, but found when this dendrimer was complexed to siRNA, the complexes aggregated.22 Structure of mPEG-PAMAM-G4 contains both hydrophilic and hydrophobic sites thus potentially abrogating this physical stability concern.
Furthermore, in addition to physical stability, it is well known that biological fluids and tissues contain multiple nucleases. Therefore, another major requirement for any prospective delivery agent is to protect the bound nucleic acid from such destruction. Susceptibility of RNA to being degraded by nucleases and RNases is therefore a major technological hurdle to RNA nanotechnology and therapeutics. TAT-PAMAM dendrimer protects siRNA from RNase A degradation,22 and here we extend this to mPEG-PAMAM G4 and to RNA protection against nucleolytic degradation in serum and tissue homogenates, in addition to RNase A.
There has been a great deal of interest recently in the functionalization of dendrimer such as by surface PEGylation or derivitization with amphiphilic alkyl tail, for improved gene and siRNA delivery.23–24 To the best of our knowledge however, there are no reports for the delivery of splice switching oligonucleotides (SSOs)25–29 by mPEG-PAMAM-G4, here investigated for the first time in a novel engineered human cancer cell line (A375-pLuc) which up-regulates Luciferase expression after successful functional delivery of SSO. Furthermore, recently we described a nanoconjugate formed between PAMAM, manganese oxide nano-rods and the anti-cancer RNA molecule, poly I:C, where here we explore the more novel triconjugate derived of mPEG-PAMAM G4 and demonstrate its improved cancer cell killing bio-activity.
EXPERIMENTAL SECTION
Materials
Bulk ribonucleic acid from Torula yeast (8000 g/mol) and Lambda phage deoxyribonucleic acid (31.5 × 10³ kDA, at 6 mg/mL) were purchased from Sigma Aldrich and used as supplied. Poly IC, the anti-cancer, double-stranded RNA, was also obtained from Sigma Aldrich. The 623 SSOs were obtained from Integrated DNA Technologies with phosphothioate and 2’-O-methyl modifications consisting of the following sequence: 5’-GTTATTCTTTAGAATGGTGC-3’. mPEG-PAMAM-G4 (MW 8423 g/mol) was synthesized following published methods.14,30 Heparin Lithium salt was purchased from MP Biomedicals, LLC. RNase A was purchased from Sigma Aldrich and was utilized at a 0.6 mg/mL concentration. The fetal bovine serum (FBS) utilized was purchased from Atlanta Biologicals (Lot #M1010). cOmplete Protease Inhibitor Cocktail was purchased from Roche Applied Science (1 tab (76.53 mg) in 50 mL of 1X RIPA). A375 Human Melanoma and A375 pLuc cells were obtained from Dr. Rudy Juliano, University of North Carolina.
Preparation of Stock Solutions
The appropriate amount of RNA (6.0 mg/mL), DNA (6.0 mg/mL), and mPEG-PAMAM-G4 (8.2 mg/mL) were dissolved in 50 mM Tris-HCl (pH 7.4) or RNase-free water and mixed to acquire N/P ratios of 10-0.2.
Gel Retardation Assay
mPEG-PAMAM-G4 was complexed with RNA at N/P ratios of 10, 5, 1, 0.4 and 0.2 were prepared in 50 mM Tris-HCl (pH 7.4). After 5 minutes of incubation at room temperature, the complexes were gently mixed by inversion and centrifuged briefly. Bromophenol blue loading dye and ethidium bromide (0.3 µg/µL in gel) were added, mixed gently by inversion and centrifuged briefly. Samples were loaded into a 1.5% w/v agarose gel and electrophoresed for 45 minutes at 80V. The gel was analyzed using ultraviolet light transilluminator and imaged with Kodak Gel Logic 200 software.
DLS Nanocomplex Size Determination and Stability
mPEG-PAMAM-G4 and RNA complexes were prepared at various N/P ratios ranging from 10 to 0.2 in 50 mM Tris-HCl (pH 7.4) from stock solutions. The solutions were mixed by inversion and analyzed on a Malvern Zetasizer NanoSeries ZS90 instrument. The diameters of the nanoparticles were considered over a variety of dimensions and axes. Modes of data analysis were intensity, number, and volume. Size determinations were also performed at varying time intervals (0, 24 and 72 hrs). Samples were stored at 4 °C in between readings. Experiments were done in triplicate and repeated twice.
Circular Dichroism
Stock solutions mPEG-PAMAM-G4 and RNA or DNA were dissolved in RNase-free water. N/P ratios of 5:1 and 10:1 were measured, as well as nucleic acid-only controls, on a J-815 CD Spectrometer (Jasco Corporation) using 1 mm rectangular quartz cuvettes (Starna Cells). Samples were brought to a total volume of 400 µL with 50 mM Tris-HCl (pH 7.4). Tris-HCl was also used for the baseline measurement. Spectra were smoothened via the binomial method with 30 iterations using the Spectra Analysis Software version 2 from Jasco Corporation. Measurements were performed in triplicate and the averages were reported.
Morphologic Characterization by Atomic Force Microscopy (AFM)
The morphology and particle sizes of DNA and mPEG-PAMAM-G4 were analyzed using atomic force microscopy. The mPEG-PAMAM-G4 and Lambda phage DNA solutions were prepared separately at 0.2 mM in 50 mM Tris-HCl (pH 7.4). After incubation on ice, the samples were combined at a 1:1 ratio and mixed by inversion for a final concentration of each at 0.1 mM. 30 µL aliquots of the complexes were placed on freshly cleaved, untreated mica for 2–3 minutes. Excess solution was removed by washing with deionized water and dried with N2 gas. The mode for imaging was set to tapping with a scanning speed of 1~5 Hz.
RNA Protection Assays
The ability of mPEG-PAMAM-G4 to protect RNA from degradation was evaluated at N/P ratios of 10, 5, 1, 0.4, and 0.2. After incubation with treatment, 3 µL of a saturated Heparin solution was added to each sample. 3 µL of bromophenol blue was also added, and the solutions were mixed and centrifuged briefly. Samples were electrophoresed on a 1.5% (w/v) agarose gel for 15 minutes at 100V. Gels were stained in ethidium bromide (0.3 µg/mL) for 20 minutes and analyzed using an ultraviolet light transilluminator with Kodak Gel Logic 200 imaging software.
RNA Protection Against RNase A
An initial experiment using RNase A was conducted using an N/P ratio of 5. RNase A was added in increasing volumes (3, 5, 10, 15, and 20 µL) to 14 µL of N/P or RNA-only control samples. The total volumes were not normalized. The volume of mPEG-PAMAM-G4 stock was replaced with RNase-free water in the controls. Samples were incubated for 5 minutes at room temperature, and bromophenol blue and heparin were added as indicated above. Samples were electrophoresed at 80V for 45 minutes.
RNA Protection in Fetal Bovine Serum (FBS)
FBS was added to 10 µL aliquots of each N/P ratio or RNA-only control in volumes of 2, 4, 6, 8, and 10 µL. RNase-free water was used to bring each sample to a total volume of 20 µL, as well as to replace dendrimer volumes in RNA-only controls. For N/P ratios at or above 1, the positive and negative controls were 10 µL aliquots of the N/P and RNA control samples with 10 µL of RNase-free water. For N/P ratios below 1, the positive and negative controls were normalized to represent the body of RNA in solution that could be protected by mPEG-PAMAM-G4. Samples were incubated for 30 minutes at 37°C before electrophoresis.
RNA Protection in Mouse Tissue Homogenates
Heart, lung, and eye tissue were collected from 8-month old female APP transgenic mice and stored at −80°C in between use. 40 mg of each tissue (corneas were not removed from eyes) was homogenized in 1 mL of RIPA buffer with cOmplete protease inhibitor cocktail using a mortar and pestle microcentrifuge tube and a Fischer Scientific Sonic Dismembranator 60 (sonicated for approximately 15 seconds). Homogenates were centrifuged for 5 minutes at 13,400 rpm and bulk protein concentrations from sample supernatants were measured using a Thermo Scientific NanoDrop 2000 (Lung=1.1 mg/mL, Heart=1.5 mg/mL, Eye=2.8 mg/mL). Dilutions were performed so that the bulk protein concentration was the same for all samples. We hypothesized that the 10:1 N/P ratio afforded the highest level of RNA protection against degradation and is therefore the most clinically applicable ratio. Master samples with enough total volume to pipette aliquots for each gel were made with 200 µL of the N/P and RNA-only control for every tissue and matched with tissue homogenate extraction. For positive and negative controls, 200 µL of N/P or RNA were added to 200 µL of RNase-free water. All samples were incubated at 37°C, vortexed, and aliquots were taken from each at 2, 12, 18, 24, 36, 48, 60, and 72 hours for electrophoresis.
SSO Delivery Transfection Assay
A375 pLuc cells were seeded in a sterile Greiner (Cellstar) clear bottom 96-well plate at 1.0×10⁴ cells per well and allowed to adhere overnight at 37°C and 5% CO2 in DMEM with 10% FBS and 1% penicillin/streptomycin (PS). All of the following transfection solutions were made in indicator-free, serum-free DMEM. All amounts are given per well with the experiment run in quintuplet. For each solution the appropriate amount of 705 SSO (CCUCUUACCUCAGUUACA) and DMEM was added to each solution so that the final concentration in the well was 200 nM and the final volume 200 µl. A Lipofectamine positive control was prepared per manufacturer’s instructions. For each N/P ratio, the appropriate amount of SSO and mPEG-PAMAM-G4 for five wells were added to 50 µl of DMEM in a microcentrifuge tube, mixed together, and allowed to incubate at room temperature for 20 minutes. The samples were then diluted to the appropriate concentration with more DMEM, mixed, and aliquotted to each well. Lipofectamine was allowed to incubate for an additional 20 minutes with the appropriate samples before being diluted and added to the wells. After 8 hours of incubation at 37°C in 5% CO2, the treatment was removed and the cells were washed with sterile 1X PBS. Cells recovered in 200 µl DMEM with 10% FBS and 1% PS at 37°C and 5% CO2 for 48 hours. The samples were then assayed for luciferase activity using a Promega Luciferase Assay kit per manufactor’s instructions on a SpectraMax L Luminometer (Molecular Devices).
MTT Cell Viability Assay
An MTT (3-(4,5-dimethylthiazol-2-yl)-2,5-diphenyltetrazolium bromide) cell viability assay was performed in order to investigate conjugate efficiency for the delivery of a therapeutic anti-cancer RNA. Poly IC (polyinosinic-polycytidylic acid, Sigma Aldrich), a potential anti-cancer therapeutic RNA31–35 with known cancer cell killing effects31, was used for cell treatment at 100 nM concentration. mPEG-PAMAM-G4 was used to deliver the Poly IC at 1:1 and 5:1 N/P ratios with mPEG-PAMAM-G4 concentrations at 9.5 and 30 µg/mL, respectively. The effect of Mn3O4 nanoparticles (Dr. Ghosh, Missouri State University) and gold nanoparticles (GNP, Sigma Aldrich) on the delivery of dendrimer-RNA complexes at the N/P 1:1 ratio was also investigated at 0.025 µg/µL and 5% v/v 3X stock concentrations, respectively. Poly IC alone [100 nM] and mPEG-PAMAM-G4 alone [9.5 µg/mL] treatments were also performed. RNase-free water was used to bring samples up to 200 µL total volume per well.
All cell work and treatment preparation were performed under sterile conditions. Sterile Greiner (Cellstar) clear bottom 96-well plates were seeded with A375 human melanoma cell line at 8.0×10³ cells per well in (DMEM) with 10% (FBS) and 1% (PS). The cells were allowed to adhere and recover for 24 hours at 37°C and 5% CO2. Following incubation, the media was removed and the cells were washed once with 1X sterile PBS then given the aforementioned treatments +/− Lipofectamine in indicator-free DMEM 10% FBS 1% PS for 24 hours at 37°C and 5% CO2.
MTT solution (12 mM, Sigma Aldrich) was prepared by dissolving 5 mg MTT powder in 1 mL sterile 1X PBS. The media was removed from the wells and cells were washed once with sterile 1X PBS to remove any remaining treatment. Each well was then treated with 100 µL indicator-free DMEM 10% FBS 1% PS and 10 µL MTT solution. The plates were incubated at 37°C and 5% CO2 for 4 hours to allow the cells to metabolize the MTT into formazan. All but 25 µL of MTT treatment were removed, and a multi-channel micropipetter was used to add 50 µL of dimethyl sulfoxide (DMSO, Sigma Aldrich) to each well. The plates were then incubated at 37°C and 5% CO2 for 10 minutes to allow the DMSO to solubilize the formazan.
A SpectraMax Paradigm Multi-Mode Detection Platform (Molecular Devices) instrument and Molecular Devices SoftMax Pro 6.2.1 software were used to analyze the results. The plates were shaken for 3 seconds on medium setting before endpoint absorbance measurements were taken at 562 nm. Each treatment was performed in triplicate, and results were reported as an averaged percent of the control. Higher absorbance readings indicated higher cell viability. Lower absorbance readings therefore indicated more efficiency for delivering the anti-cancer RNA. Errors bars represent standard deviation of five wells per sample with the experiment repeated in triplicate.
RESULTS AND DISCUSSION
Complexation of mPEG-PAMAM-G4 to RNA
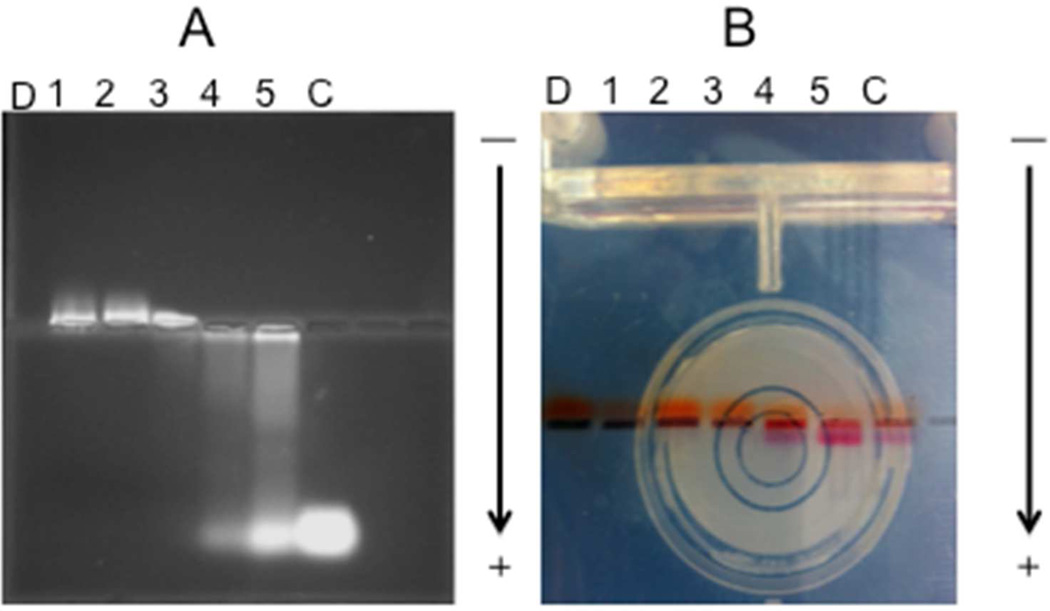
Complexation ability between the mPEG-PAMAM G4 and RNA was measured using a retardation assay (Figure 2A). Complexation to DNA was confirmed where a charge/mass ratio and similar gel shift was observed (data not shown). Five different N/P ratios ranging from 10 to 0.2 were utilized. The polymer and RNA were dissolved in 50 mM Tris-HCl (pH 7.4), with no precipitation observed. The mPEG-PAMAM G4, a positively charged polymer due to amino groups present, was able to associate with RNA molecules.20–24,36 As seen in Figure 2A, moving from left to right, the N/P ratio decreased and thus the ability of the mPEG-PAMAM-G4 to retard RNA decreased as well. It is evident that complete complexes were able to form with N/P ratios ranging from (10) through (1); moreover, as the N/P ratio decreases <1, the excess RNA was able to move freely through the agarose gel compared to when it was retained at an N/P ratio ≥1. In Figure 2B, bromophenol blue (BPB), a negatively charged dye, was observed to electrophorese in the opposite direction of its normal migration, indicating BPB association with mPEG-PAMAM-G4 consistent with our prior work on functionalized dendrimer.40
Figure 2.
(A) Gel retardation assay of mPEG-PAMAM-G4/RNA, (B) Bromophenol blue color and direction shift as a function of mPEG-PAMAM-G4 interaction. N/P ratio: (1) 10, (2) 5, (3) 1, (4) 0.4, (5) 0.2, (D) mPEG-PAMAM-G4 only, (C) Control RNA only.
Average Size Distribution
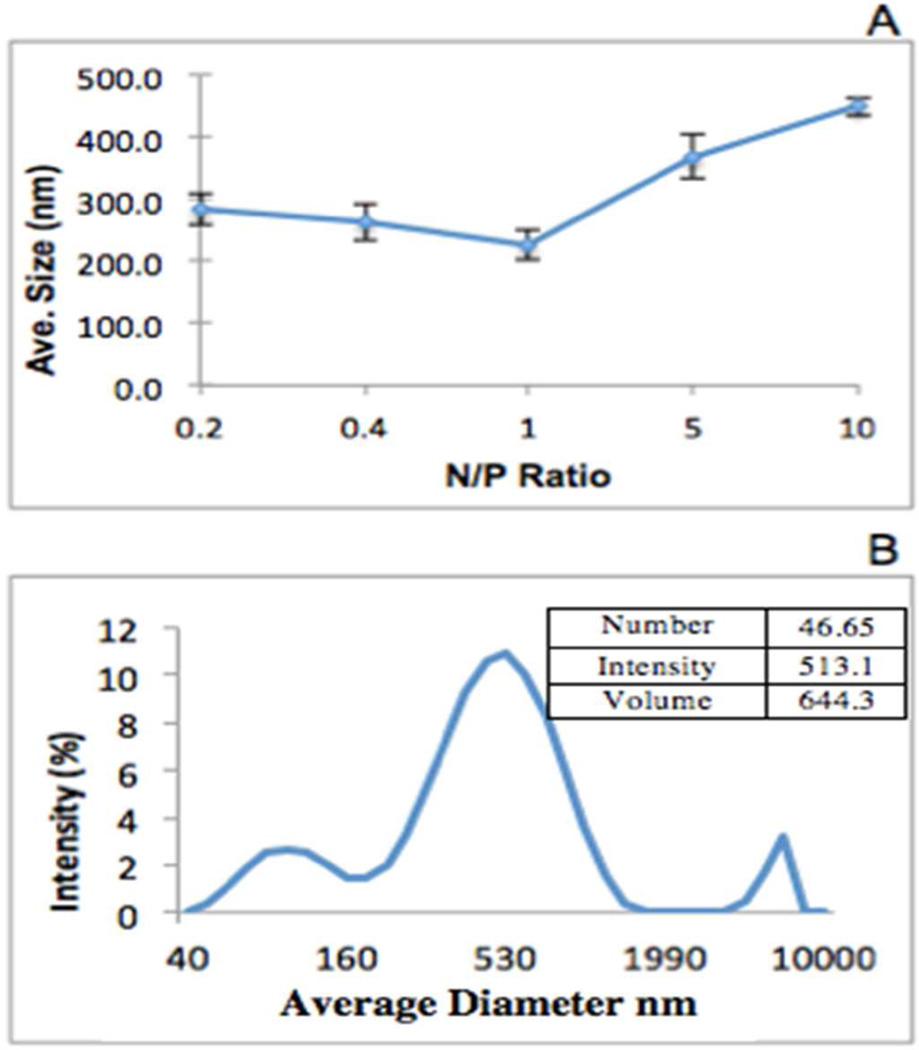
The average sizes of the complexes were measured using DLS. mPEG-PAMAM-G4 and RNA with N/P ratios (10, 5, 1, .4 and .2) were utilized, with readings taken at time zero (Figure 3A). For N/P ratios from 0.2 to 1, the size remained relatively constant (approx. 300 nm). For N/P ratio >1, the sizes began to increase, ranging from 240–430 nm in diameter. A representative peak of the size complex of the N/P ratio 10 is seen in Figure 3B. As shown in the inset, number and volume modes of analysis, in comparison to intensity, reveal the presence of discrete particle populations < 50 or >500 nm. Overall, the complexes formed particles in the nano range that could potentially have the ability to enter the cell.18
Figure 3.
Representative size measurements using DLS. (A) mPEG-PAMAM-G4 is complexed with RNA at various N/P ratios 0.2, 0.4, 1, 5, 10. (B) A representative average size peak of N/P ratio 10. Data is depicted as Intensity of size in nm. Inset table depicts average diameters using Number, Intensity, and Volume parameters. These are also shown in nm, and the prominent peak was chosen as the representative size.
Nanocomplex Morphology Characterization
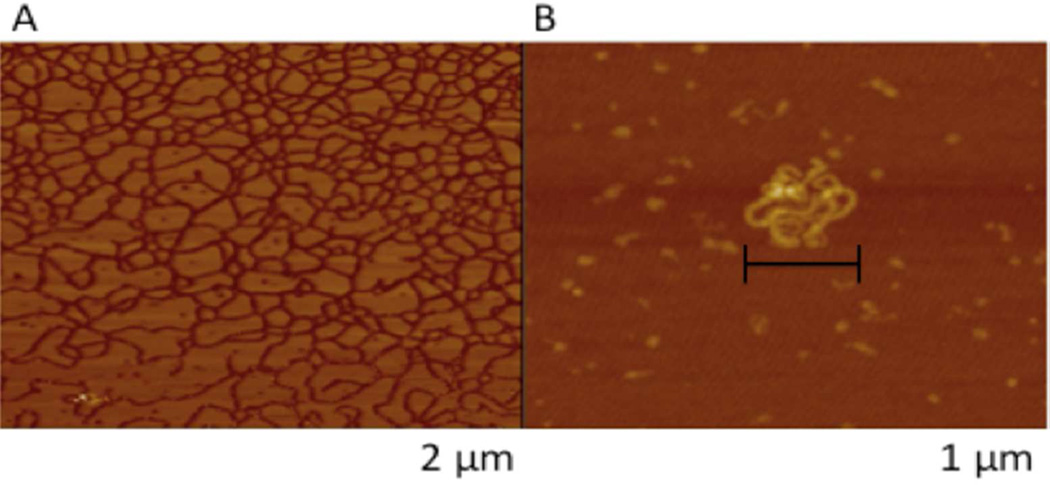
AFM was utilized to characterize the morphology of DNA and mPEG-PAMAM-G4 nanocomplexes. Figure 4A depicts DNA alone, creating a lattice network. A 0.1 mM concentration of mPEG-PAMAM-G4:DNA was observed to create condensed, compact nanocomplex spheres (Approximately 200 nm on the × plane and slightly less than that in the y) (Figure 4B).
Figure 4.
AFM images of the mPEG-PAMAM-G4:DNA nanocomplexes. (A) Plasmid DNA only (B) mPEG-PAMAM-G4complexed with plasmid DNA at a 1:1 ratio.
Circular Dichroism Characterization
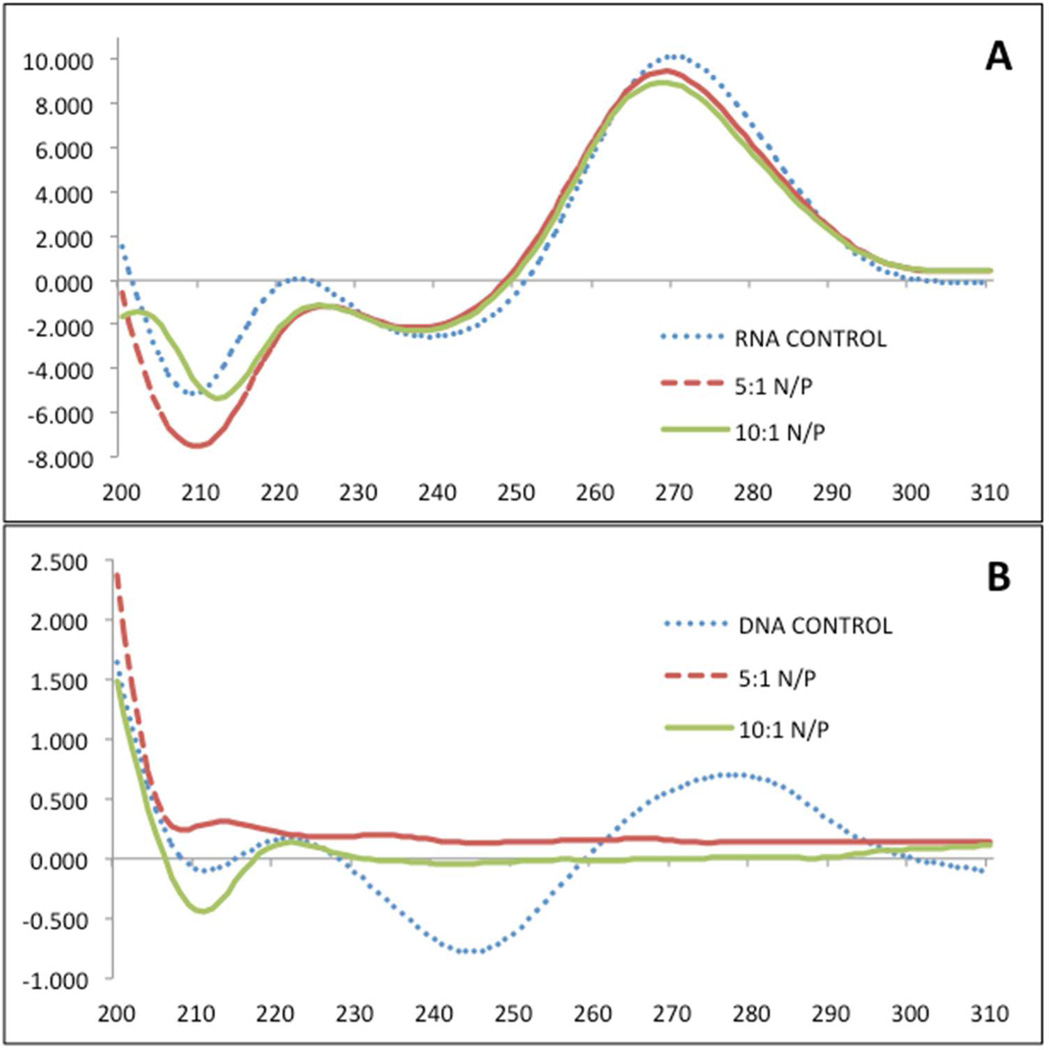
Characterization of mPEG-PAMAM-G4 association to RNA and DNA by CD analysis at N/P ratios of 10 or 5 is shown in Figure 5A and 5B respectively. For RNA a slight spectral shift but no pattern difference was observed at either N/P ratio. In contrast the data for DNA (Figure 5B), show a complete baseline shift when complexed to mPEG-PAMAM-G4, at the calculated 5:1 and 10:1 N:P ratios. This suggests a massive DNA conformational change after complexation, consistent with the AFM data above. Yet given ethidium staining of RNA shown above, the unchanged CD pattern for mPEG-PAMAM G4:RNA suggests the complex preserves structure.
Figure 5.
Circular dichroism spectrum of RNA (A) or DNA (B) +/− mPEG-PAMAM-G4 at 5:1 or 10:1 N/P ratios. Y axis is F (mdeg) and x axis wavelength in nm.
Stability Over Time
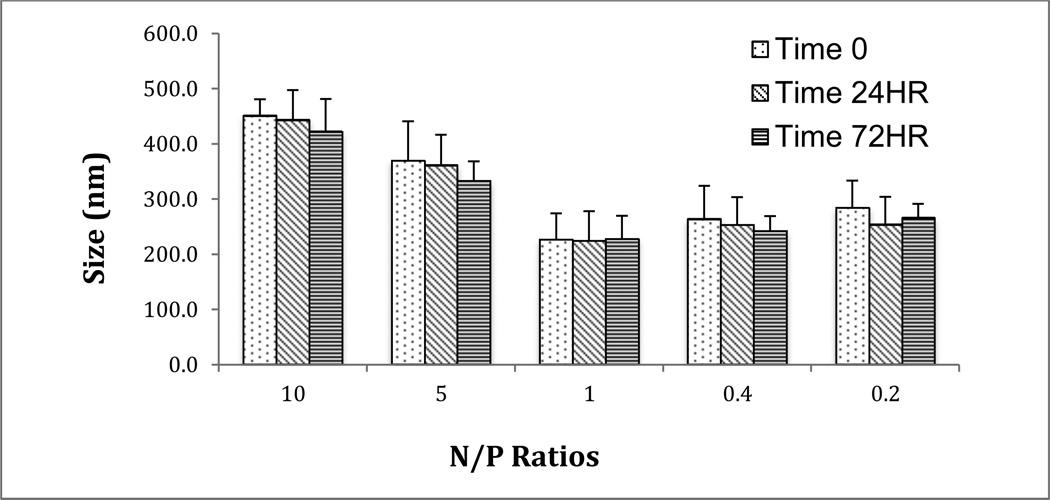
DLS was used to analyze the aggregation of the mPEG-PAMAM-G4:RNA nanocomplexes at various N/P ratios (10, 5, 1, .4 and .2) over time (Figure 6). The timeframe of the DLS experiments ranged from 0–72 hours, with sizes remaining relatively constant (range=240–430 nm). As the N/P ratio decreased, the relative size also decreased. Aggregation would have been depicted by an increase in size over time, which did not occur, indicating stable complexes for at least 72 hours.
Figure 6.
Size stability over time. DLS was utilized to analyze aggregation of nanoplexes using N/P ratios over a 72-hour time period. Experiments were done in triplicate and repeated twice and the error bars represent the standard deviation.
Protective Properties of the mPEG-PAMAM-G4 in RNase A Solution and Fetal Bovine Serum
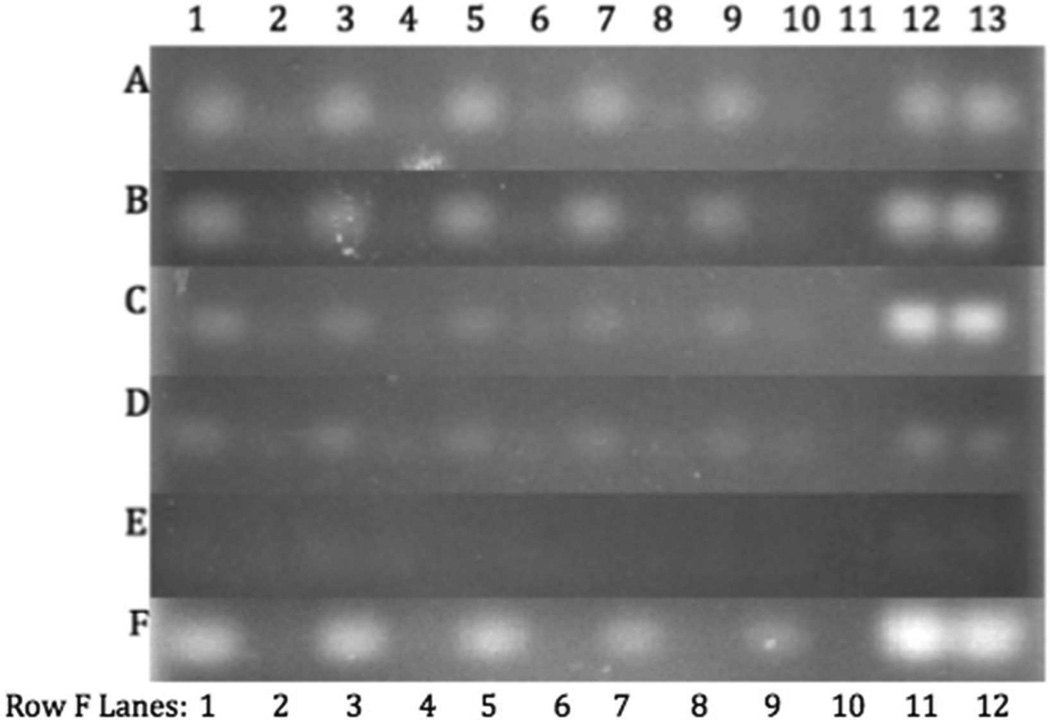
The mPEG-PAMAM-G4 has the ability to bind the RNA complex, thus inhibiting degradation via RNases.22,39 In Rows A-E of Figure 7, mPEG-PAMAM-G4 complexes of N/P ratios 10, 5, 1, 0.4 and 0.2 were subjected to varying volumes of FBS at 37°C for 30 minutes (Figure 7). Row F indicates an N/P ratio of 5:1 after incubation with RNase A. RNA was disassociated from the dendrimer by the addition of heparin and samples were run on a 1.5% agarose gel. Figure 7 Rows A-E show that the dendrimer protected the RNA from RNase in FBS (Lanes 1, 3, 5, 7, and 9), contrasting to RNA only, exposed to the same varying FBS concentrations. All of the RNA was degraded in the absence of mPEG-PAMAM-G4 (Lanes 2, 4, 6, 8, 10). Row E, with an N/P ratio of 0.2, shows little to no RNA because the relative mPEG-PAMAM-G4 concentration is very low. Therefore, there is little mPEG-PAMAM-G4 availability for protection. The faintness of the normalized controls verifies this hypothesis, as well as the trend indicated by Row D, showing an N/P ratio of 0.4. The mismatch in brightness between lanes 1, 3, 5, 7, and 9 and control lanes 12–13 in Row C most likely occurred because there is no excess of RNA (P’s) in solution. It is therefore most probable that the mPEG-PAMAM-G4 in this sample was not completely saturated, and some of the RNA in solution was free to be degraded. Row F shows RNA protection as well, even when 20 µL of RNase A was added, while diluting the RNA in solution. Overall, the data indicates mPEG-PAMAM-G4 protection of RNA from either RNase A addition or after exposure to serum in an N/P dependant manner.
Figure 7.
RNA protection in fetal bovine serum and RNase A. mPEG-PAMAM-G4 was complexed with RNA at N/P ratios of 10 (Row A), 5 (Row B), 1 (Row C), 0.4 (Row D), and 0.2 (Row E). Lanes 1, 3, 5, 7, and 9 have mPEG-PAMAM-G4, and lanes 2, 4, 6, 8, and 10 lack mPEG-PAMAM-G4. FBS was added: (lanes 1–2) 2 µL, (lanes 3–4) 4 µL, (lanes 5–6) 6 µL, (lanes 7–8) 8 µL, (lanes 9–10) 10 µL. Lane 11 is a blank. Lanes 12 and 13 show FBS-less N/P and RNA-only controls, respectively. Row F: mPEG-PAMAM-G4 was complexed with RNA at N/P of 5:1. RNase A (0.6 mg/mL) were added: (Lanes 1–2) 3 µL, (3–4) 5 µL, (5–6) 10 µL, (7–8) 15 µL, (9–10) 20 µL, (11–12) 0 µL.
Protective Properties of the mPEG-PAMAM-G4 in Mouse Tissues
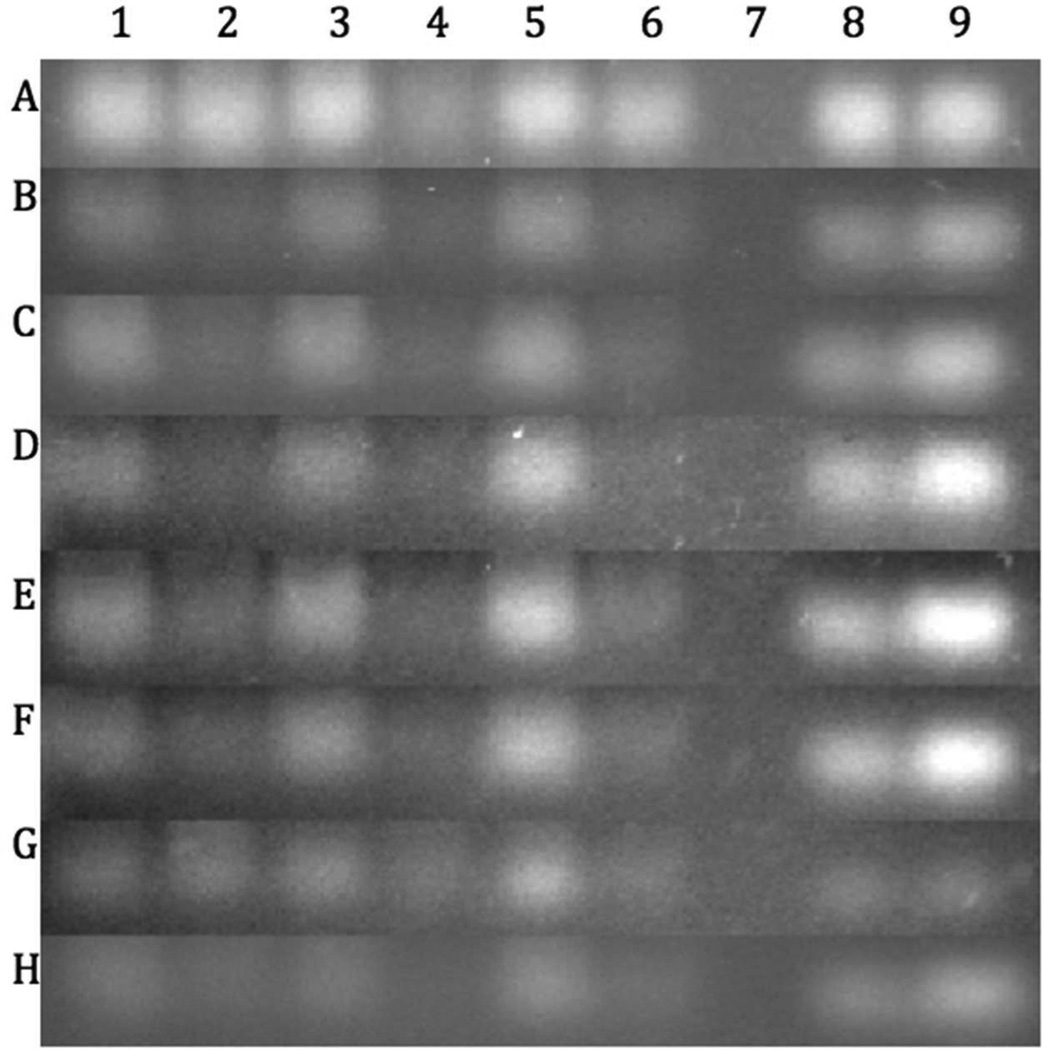
Heart, lung and eye tissues based on a preliminary set of mouse tissue screening experiments, gave a good low, medium to high relative levels of RNase activity respectively (data not shown). Figure 8 shows that mPEG-PAMAM-G4 protected RNA (lanes 1, 3, and 5) from degradation in these select tissue homogenates for up to 72 hours, as opposed to RNA only during the same time intervals (lanes 2, 4, and 6). In addition, the conservation of RNA in the dendrimer-containing wells remains approximately the same for all time periods, when comparing to their respective positive and negative controls (lanes 8–9). It was also observed that residual nucleic acid remained in wells containing tissue homogenate, and the amount of this nucleic acid increased with time. This increase directly correlated with the appearance of high molecular weight aggregates in the tissue samples. This was likely due to nucleic acid binding proteins sequestering to the exogenous RNA introduced and this tended to increase over time making time-point measurements past 72 hours difficult. Up until 60 hours (Row G) or even 72-hours (Row H) however, the trend of mPEG-PAMAM-G4 protection continued, where lanes containing mPEG-PAMAM-G4 had a more bright intense band relative to wells containing RNA alone. Given the presumed protein-RNA aggregates mentioned above and the likely chemical degradation of RNA by hydrolysis, oxidation, etc. we were unable to discern a discrete RNA band after 72 hours.
Figure 8.
RNA protection against heart (lanes 1–2), lung (lanes 3–4) and eye (lanes 5–6) mouse tissue homogenates. mPEG-PAMAM-G4 was complexed with RNA at an N/P ratio of 10 (lanes 1, 3, and 5). Lanes 2, 4, and 6 have RNA only. Lane 7 is blank. Lanes 8 and 9 show tissue-less N/P and RNA-only controls, respectively. All samples were incubated at 37°C for 72 hours. Aliquots were removed at: 2 hours (Row A), 12 hours (Row B), 18 hours (Row C), 24 hours (Row D), 36 hours (Row E), 48 hours (Row F), 60 hours (Row G), and 72 hours (Row H).
SSO Delivery Assay
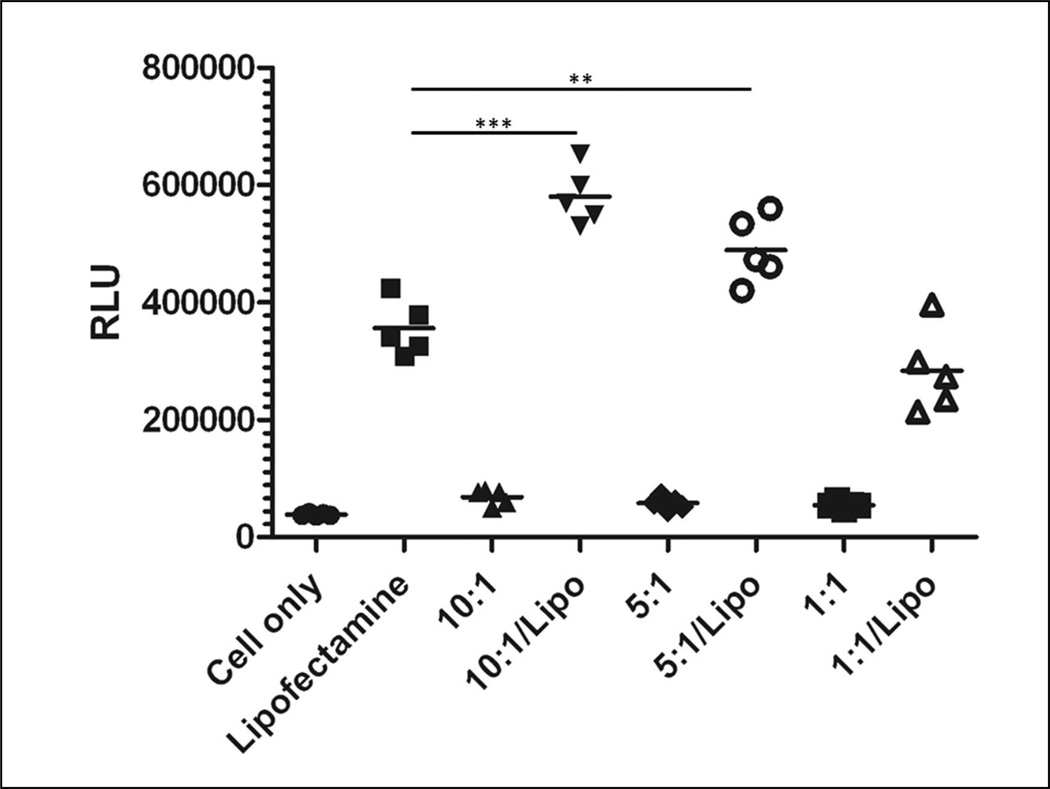
mPEG-PAMAM-G4 was tested as a delivery vehicle, using a new A375 pLuc splice-switching system, modified from our earlier HeLa pLuc system.27,40 The A375 pLuc cells constitutively express a nonfunctional, aberrantly spliced luciferase protein. Upon delivery of the 705 SSO, correct luciferase splicing is restored, and the cells produce a functional protein whose activity can be measured by assaying for luciferase activity. Therefore, higher cell luminescence is indicative of higher delivery of functional SSOs. The data in Figure 9 show that the luminescence for the mPEG-PAMAM-G4/SSO complexes was equal to that of the cell only control at all N/P ratios, indicating that denderimer alone was incapable of SSO delivery. Because of this lack of inherent transfection ability, we decided to complex the dendrimer/SSO particles with a known transfection agent, Lipofectamine. In the presence of Lipofectamine, the mPEG-PAMAM-G4 significantly increased the transfection efficiency at the 10:1 and 5:1 N/P ratios as compared to Lipofectamine alone. The mPEG-PAMAM-G4 had no effect on the transfection efficiency of Lipofectamine at the 1:1 N/P ratio.
Figure 9.
Enhanced splice-switching in an engineered human cancer cell line (A375 pLuc) enhances SSO delivery. SSO in nanocomplexes with mPEG-PAMAM-G4 and lipofectamine (10:1/Lipo or 5:1/Lipo) provided more splicing correction and hence cell luminescence27, in comparison to Lipofectamine (Lipo) or mPEG-PAMAM-G4 controls at either 10:1 or 5:1 N/P ratios. RLU: Relative light units. P-value of <.0001***. P-value of <.005**, indicates significance of SSO delivery for 10:1/Lipo or 5:1/Lipo in comparison to Lipo only control.
Delivery of Anti-Cancer RNA to Human Melanoma Cells
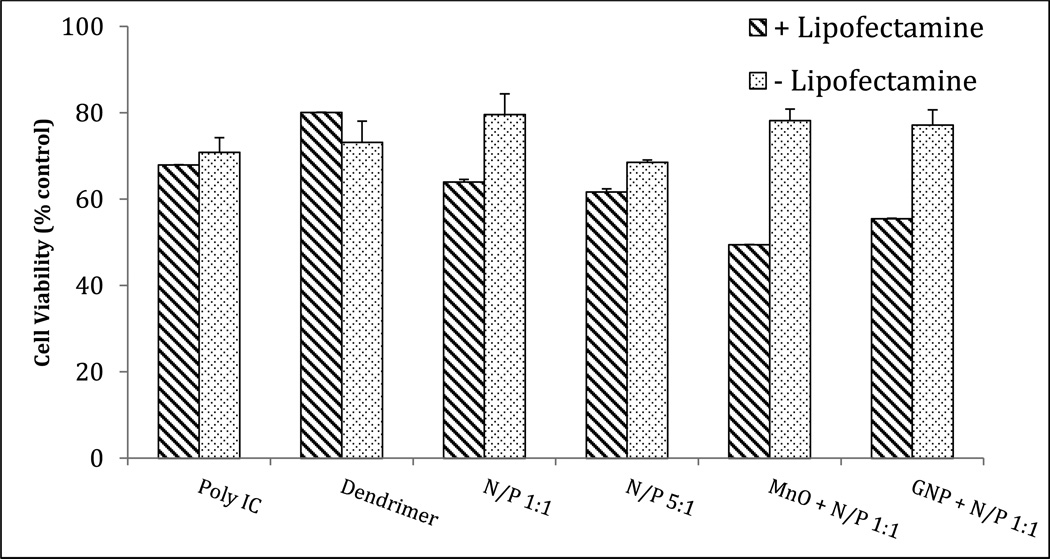
Our previous work characterized conjugates formed between gold nanoparticle (GNP) and mPEG-PAMAM-G3 for the delivery of anti-BRAF siRNA40 or the more novel nanomaterial, manganese oxide (MnO) in conjunction with unfunctionalized PAMAM dendrimer.41 Here we were interested in the bioactivity of the anti-cancer RNA, poly I:C34,35 combined with mPEG-PAMAM-G4, and either GNP or MnO. Healthy cells metabolize MTT into formazan, the absorbance of which is measured to quantify cell viability and cytotoxicity. The data in Figure 10 indicate increased killing of the human melanoma cell line A375 with Poly IC complexes in an N/P-dependent manner in the presence of lipofectamine. With Lipofectamine, the 5:1 N/P complex showed slightly higher cytotoxicity (61.7% cell viability) in the A375 human melanoma cell line than the 1:1 ratio (64.0% cell viability), however both ratios indicated that complexation with the mPEG-PAMAM-G4 enhanced the cancer-killing effect of Poly IC alone (68.0% cell viability). mPEG-PAMAM-G4 alone in the amount equal to a 1:1 ratio was less toxic (80.1% cell viability) than the Poly IC alone. Most interesting were the conjugates formed with the various nanomaterials. Both the MnO- and GNP-conjugated treatments exhibited greatly increased cytotoxicity at the 1:1 N/P ratio (49.5% and 55.5% cell viability, respectively). These effects were greater than those of even the 5:1 N/P Poly IC-dendrimer complex.
Figure 10.
Enhanced cancer-killing effects of Poly IC complexed with mPEG-PAMAM-G4 and various nanomaterials. A375 human melanoma cells were treated with an anti-cancer RNA either complexed with dendrimer at various ratios, or conjugated to various nanomaterials using the mPEG-PAMAM-G4 as a stabilizing intermediate, to enhance the cancer-killing effects observed with Poly IC alone. Cells were treated with either Poly IC (100 nM), mPEG-PAMAM-G4 alone (9.5 µg/mL), N/P 1:1 and 5:1 ratios (Poly IC at 100nM, dendrimer at 9.5 µg/mL and 30 µg/mL), or nanoconjugates formed between MnO nanoparticles (0.025 µg/µL) or GNP (5% v/v of 3X stock) and N/P 1:1, +/− Lipofectamine, With Lipofectamine, the mPEG-PAMAM-G4 increased the cancer cell killing effects of Poly IC with increasing N/P ratio. MnO- and GNP-conjugated complexes demonstrated an increased potency of the 1:1 N/P ratio that was more effective than even the N/P 5:1 complex.
CONCLUSIONS
Here, we demonstrate that mPEG-PAMAM-G4 directly associates to both RNA and DNA, a critical preliminary criteria for any potential nucleic acid delivery agent. Gel shift assays and DLS showed that complexes were able to self-assemble with complete complexation forming with N/P ratios ranging from 10-1. Interestingly, we showed that the negatively charged loading dye bromophenol blue electrophoresed in the opposite direction, toward the negative pole, indicating that the positively charged mPEG-PAMAM-G4 was able to strongly bind the dye and reverse its direction. The average sizes of the complexes ranged from 240–430 nm over 72 hours, indicating the formation of stable, discrete RNA nanocomplexes.
Circular dichroism data showed that with increasing mPEG-PAMAM-G4 concentrations the RNA absorbance pattern remained the same, and a slight shift in absorbance spectrum confirmed interaction. The unaltered overall absorbance pattern likely indicates mechanistically that RNA complexation involves little structural alteration. For DNA, the AFM data appears to reveal DNA wrapping around a dendrimer core, substantially changing the CD pattern of DNA alone which is not compact, but rather extended. Further, the AFM data also clearly show a nanoplex of approximately 200 nm supporting the size measurements by DLS.
The mPEG-PAMAM-G4 showed outstanding protection against RNase A and nuclease degradation when exposed to serum and tissue homogenates of the eye, lung and heart. This is intriguing because the physical characterization of the nanoplexes suggests that little conformational change occurs to RNA upon complexation. It may be speculated that the mechanism of this protection is not likely to cause dysfunction of the RNA accordingly, but rather prolonged stability, a potential major advancement for eventual RNA therapeutics.
Although the mPEG-PAMAM-G4 was apparently unable to deliver SSO on its own, it did significantly increase the transfection efficiency of Lipofectamine at the 10:1 and 5:1 N/P ratios. This increase was most apparent at the 10:1 N/P ratio where luminescence was increased by roughly 50% and is most likely due to the dendrimer’s ability to stabilize the RNA against degradation. The dendrimer complexes did not interfere with the functionality of the SSOs, which is an extremely important factor towards their usefulness as a delivery vehicle.
The mPEG-PAMAM-G4 in conjunction with anti-cancer Poly IC, GNP and particularly MnO demonstrated enhanced killing of A375 human melanoma cells even at low N/P ratios with Lipofectamine. Our previous work characterized the formation of conjugates between MnO, PAMAM dendrimer, and Poly IC41, as well as conjugates formed between GNP, positively-charged protamine, and RNA.42 Taken together, these results show promise for future work with mPEG-PAMAM-G4 as part of a nanoconjugate delivery vehicle, especially a mPEG-PAMAM-G4 mediated lipoplex.
Supplementary Material
ACKNOWELDGMENTS
We wish to thank Dr. Scott Zimmerman and students for initial measurements on RNase activity in various mouse tissues.
FUNDING SOURCES
The National Cancer Institute, under grant number 1R15CA139390-02, supported this work for RKD and KCG.
Footnotes
SUPPORTING INFORMATION
Treatment with Lipofectamine alone yielded 91.3% cell viability, while treatment with MnO and GNP alone resulted in 61.5% and 65.2% viability, respectively (Supplemental Figure 1). These data suggest that the triconjugates formed between MnO or GNP, mPEG-PAMAM-G4 dendrimer, and Poly IC form a more stable complex with enhanced cancer-killing capability than any of the components alone.
REFERENCES
- 1.Samad A, Alam IM, Saxena K. Curr. Pharm. Des. 2009;15:2958–2969. doi: 10.2174/138161209789058200. [DOI] [PubMed] [Google Scholar]
- 2.Patri AK, Majoros IJ, Baker JR., Jr Curr. Opin. Chem. Biol. 2002;6:466–471. doi: 10.1016/s1367-5931(02)00347-2. [DOI] [PubMed] [Google Scholar]
- 3.Lee CC, MacKay JA, Fréchet JMJ, Szoka FC. Nat. Biotechnol. 2005;23:1517–1526. doi: 10.1038/nbt1171. [DOI] [PubMed] [Google Scholar]
- 4.Liu N, Hao Y, Yin Z, Ma M, Wang L, Zhang X. Pharmazie. 2012;67:174–181. [PubMed] [Google Scholar]
- 5.Liu M, Fréchet JM. Pharm. Sci. Technol. Today. 1999;2:393–401. doi: 10.1016/s1461-5347(99)00203-5. [DOI] [PubMed] [Google Scholar]
- 6.Esfand R, Tomalia DA. Drug Discovery Today. 2001;6:427–436. doi: 10.1016/s1359-6446(01)01757-3. [DOI] [PubMed] [Google Scholar]
- 7.Malik N, Wiwattanapatapee R, Klopsch R, Lorenz K, Frey H, Weener JW, Meijer EW, Paulus W, Duncan RJ. Controlled Release. 2000;68:299–302. doi: 10.1016/s0168-3659(99)00246-1. [DOI] [PubMed] [Google Scholar]
- 8.Crampton HL, Simanek EE. Polym. Int. 2007;56:489–496. doi: 10.1002/pi.2230. [DOI] [PMC free article] [PubMed] [Google Scholar]
- 9.Eichman JD, Bielinska AU, Kukowska-Latallo JF, Baker JR., Jr Pharm. Sci. Technol. Today. 2000;3:232–245. doi: 10.1016/s1461-5347(00)00273-x. [DOI] [PubMed] [Google Scholar]
- 10.Kukowska-Latallo JF, Bielinska AU, Johnson J, Spindler R, Tomalia DA, Baker JR., Jr Proc. Natl. Acad. Sci. U.S.A. 1996;93:4897–4902. doi: 10.1073/pnas.93.10.4897. [DOI] [PMC free article] [PubMed] [Google Scholar]
- 11.Tang MX, Redemann CT, Szoka FC., Jr Bioconjug. Chem. 1996;7:703–714. doi: 10.1021/bc9600630. [DOI] [PubMed] [Google Scholar]
- 12.Patil ML, Zhang M, Betigeri S, Taratula O, He H, Minko T. Bioconjug. Chem. 2008;19:1396–1403. doi: 10.1021/bc8000722. [DOI] [PubMed] [Google Scholar]
- 13.Rackstraw BJSS, Davis SS, Bignotti F, Garnett MC. Biochim. Biophys. Acta, Gene Struct. Expression. 2002;1576:269–286. doi: 10.1016/s0167-4781(02)00347-0. [DOI] [PubMed] [Google Scholar]
- 14.Jevprasesphant R, Penny J, Jalal R, Attwood D, McKeown NB, D’Emanuele A. Int. J. Pharm. 2003;252:263–266. doi: 10.1016/s0378-5173(02)00623-3. [DOI] [PubMed] [Google Scholar]
- 15.Kim T-I, Seo HJ, Choi JS, Jang H-S, Baek J-U, Kim K, Park J-S. Biomacromolecules. 2004;5:2487–2492. doi: 10.1021/bm049563j. [DOI] [PubMed] [Google Scholar]
- 16.Froehlich E, Mandeville JS, Jennings CJ, Sedaghat-Herati R, Tajmir-Riahi HAJ. J. Phys. Chem. B. 2009;113:6986–6993. doi: 10.1021/jp9011119. [DOI] [PubMed] [Google Scholar]
- 17.Wang R, Zhou L, Zhou Y, Li G, Zhu X, Gu H, Jiang X, Li H, Wu J, He L, Guo X, Zhu B, Yan D. Biomacromolecules. 2010;11:489–495. doi: 10.1021/bm901215s. [DOI] [PubMed] [Google Scholar]
- 18.Fant K, Esbjörner EK, Jenkins A, Grossel MC, Lincoln P, Nordén B. Mol. Pharmaceutics. 2010;7:1734–1746. doi: 10.1021/mp1001312. [DOI] [PubMed] [Google Scholar]
- 19.Luo D, Haverstick K, Belcheva N, Han E, Saltzman WM. Macromolecules. 2002;35:3456–3462. [Google Scholar]
- 20.Orberg ML, Schillen K, Nylander T. Biomacromolecules. 2007;8:1557–1563. doi: 10.1021/bm061194z. [DOI] [PubMed] [Google Scholar]
- 21.Froehlich E, Mandeville J-S, Kreplak L, Tajmir-Riahi H-A. Biomacromolecules. 2011;12:2780–2787. doi: 10.1021/bm200547e. [DOI] [PubMed] [Google Scholar]
- 22.Kang H, DeLong R, Fisher MH, Juliano RL. Pharm Res. 2005;22:2099–106. doi: 10.1007/s11095-005-8330-5. [DOI] [PubMed] [Google Scholar]
- 23.Yu T, Liu X, Bolcato-Bellemin AL, Wang Y, Liu C, Erbacher P, Qu F, Rocchi P, Behr JP, Peng L. Angew Chem Int Ed Engl. 2012;51:8478–84. doi: 10.1002/anie.201203920. [DOI] [PubMed] [Google Scholar]
- 24.Tang Y, Li YB, Wang B, Lin RY, van Dongen M, Zurcher DM, Gu XY, Banaszak Holl MM, Liu G, Qi R. Mol Pharm. 2012;9:1812–1821. doi: 10.1021/mp3001364. [DOI] [PMC free article] [PubMed] [Google Scholar]
- 25.Resina S, Kole R, Travo A, Lebleu B, Thierry AR. J Gene Med. 2007;9:498–510. doi: 10.1002/jgm.1044. [DOI] [PubMed] [Google Scholar]
- 26.Ming X, Feng L. Mol Pharm. 2012;9:1502–1510. doi: 10.1021/mp300113c. [DOI] [PMC free article] [PubMed] [Google Scholar]
- 27.DeLong RK, Akhtar U, Sallee M, Parker B, Barber S, Zhang J, Craig M, Garrad R, Hickey AJ, Engstrom E. Biomaterials. 2009;30:6451–6459. doi: 10.1016/j.biomaterials.2009.07.067. [DOI] [PMC free article] [PubMed] [Google Scholar]
- 28.Ming X, Alam MR, Fisher M, Yan Y, Chen X, Juliano RL. Nucleic Acids Res. 2010;38:6567–6576. doi: 10.1093/nar/gkq534. [DOI] [PMC free article] [PubMed] [Google Scholar]
- 29.Uehara H, Cho Y, Simonis J, Cahoon J, Archer B, Luo L, Das SK, Singh N, Ambati J, Ambati BK. FASEB J. 2013;27:76–85. doi: 10.1096/fj.12-213835. [DOI] [PMC free article] [PubMed] [Google Scholar]
- 30.Lyer J, Fleming K, Hammond PT. Macromolecules. 1998;31:8757–8765. [Google Scholar]
- 31.Salaun B, Coste I, Rissoan MC, Lebecque SJ, Renno T. J Immunol. 2006;176:4894–4901. doi: 10.4049/jimmunol.176.8.4894. [DOI] [PubMed] [Google Scholar]
- 32.Weber A, Kirejczyk Z, Besch R, Potthoff S, Leverkus M, Hacker G. Cell Death Differ. 2010;17:942–951. doi: 10.1038/cdd.2009.190. [DOI] [PubMed] [Google Scholar]
- 33.Dogusan Z, Garcia M, Flamez D, Alexopoulou L, Goldman M, Gysemans C, Mathieu C, Libert C, Eizirik DL, Rasschaert J. Diabetes. 2008;57:1236–1245. doi: 10.2337/db07-0844. [DOI] [PubMed] [Google Scholar]
- 34.Paone A, Starace D, Galli R, Padula F, De Cesaris P, Filippini A, Ziparo E, Riccioli A. Carcinogenesis. 2008;29:1334–1342. doi: 10.1093/carcin/bgn149. [DOI] [PubMed] [Google Scholar]
- 35.Carmichael J, DeGraff WG, Gazdar AF, Minna JD, Mitchell JB. Cancer Res. 1987;47:936–942. [PubMed] [Google Scholar]
- 36.Wu J, Zhou J, Qu F, Bao P, Zhang Y, Peng L. ChemCom. 2004;3:313–315. doi: 10.1039/b414241a. [DOI] [PubMed] [Google Scholar]
- 37.Tumanova I, Boyer J, Ausar SF, Burzynski J, Rosencrance D, White J, Scheidel J, Parkinson R, Maguire H, Middaugh CR, Weiner D, Green AP. DNA Cell Biol. 2005;24:819–831. doi: 10.1089/dna.2005.24.819. [DOI] [PubMed] [Google Scholar]
- 38.Brahms S, Nakasu S, Kikuchi A, Brahms G. Eur J Biochem. 1989;184:297–303. doi: 10.1111/j.1432-1033.1989.tb15019.x. [DOI] [PubMed] [Google Scholar]
- 39.Nauwelaerts K, Fisher M, Froeyen M, Lescrinier E, Van Aerschot A, Xu D, DeLong R, Kang H, Juliano R, Herdewijn P. JACS. 2007;129:9340–9348. doi: 10.1021/ja067047q. [DOI] [PubMed] [Google Scholar]
- 40.DeLong R, Risor A, Kanomata M, Laymon A, Jones B, Zimmerman S, Williams J, Witkowski C, Warner M, Ruff M, Garrad R, Fallon J, Hickey A, Sedaghat-Herati R. Nanomedicine. 2012;7:1851–1862. doi: 10.2217/nnm.12.70. [DOI] [PMC free article] [PubMed] [Google Scholar]
- 41.Parker-Esquivel B, Flores K, Louiselle D, Craig M, Dong L, Garrad R, Ghosh K, Wanekaya A, Glaspell G, DeLong R. Langmuir. 2012;28:3860–3870. doi: 10.1021/la203998r. [DOI] [PMC free article] [PubMed] [Google Scholar]
- 42.DeLong RK, Cillessen L, Reynolds C, Wanekaya A, Severs T, Ghosh K, Fisher M, Barber S, Black J, Schaeffer A, Flores KJ. Journal of Nanotechnology. 2012;2012:9. [Google Scholar]
Associated Data
This section collects any data citations, data availability statements, or supplementary materials included in this article.


