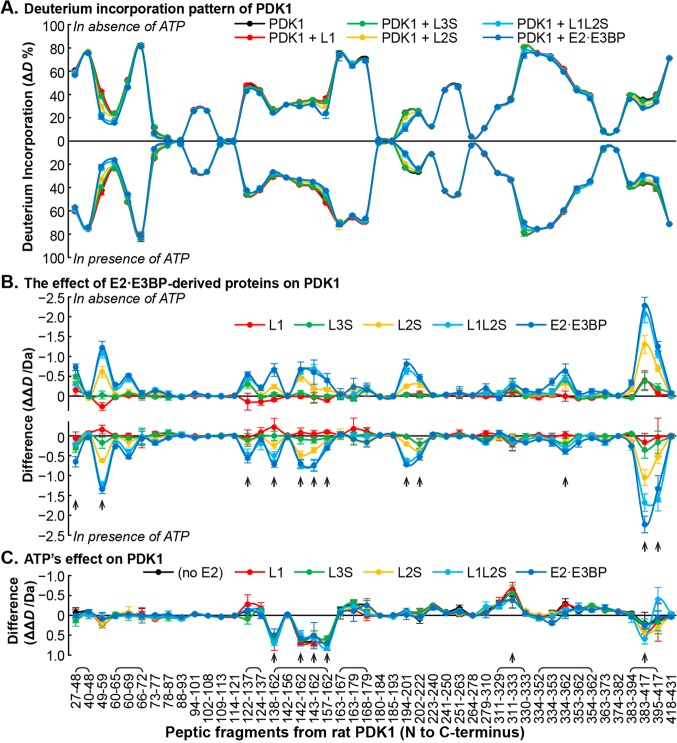
Figure 3.
Comparative HDX-MS analysis of the interaction between PDK1 and the E2·E3BP core. (A) Butterfly plot representing relative deuterium incorporation percentage (ΔD%, y axis, deuterons exchanged/maximal exchangeable amides × 100%) of peptic peptides from rat PDK1 (x axis, listed peptic peptides from the N- to C-terminus) in its free form (black) and in complex with human C-terminally truncated E2·E3BP core-derived proteins (in various colors), and in the absence (top) and presence of ATP (bottom). Overlapping peptides were capped. (B) Butterfly plot showing the changes in deuterium incorporation (ΔΔD, y axis, deuterons exchanged in the presence of each C-terminally truncated E2·E3BP core-derived protein minus deuterons exchanged in its absence) of peptic peptides from rat PDK1 upon its complexation with C-terminally truncated E2·E3BP core-derived proteins (in various colors) in the absence (top) and presence of ATP (bottom). (C) Difference plot showing the changes in deuterium incorporation (ΔΔD, y axis, deuterons exchanged in the presence of ATP minus deuterons exchanged in the absence of ATP) of peptic peptides from rat PDK1 [in its free form (black) and complexed with C-terminally truncated E2·E3BP core-derived proteins (in various colors)] in the presence of ATP. Each data point represents the mean ± the standard deviation from three independent experiments. Arrows show statistically significant changes.

