Abstract
Engineered nanomaterials (ENMs) possess unique characteristics affecting their interactions in biological media and biological tissues. Systematic investigation of the effects of particle properties on biological toxicity requires a comprehensive modeling framework which can be used to predict ENM particokinetics in a variety of media. The Agglomeration-diffusion-sedimentation-reaction model (ADSRM) described here is stochastic, using a direct simulation Monte Carlo method to study the evolution of nanoparticles in biological media, as they interact with each other and with the media over time. Nanoparticle diffusion, gravitational settling, agglomeration, and dissolution are treated in a mechanistic manner with focus on silver ENMs (AgNPs). The ADSRM model utilizes particle properties such as size, density, zeta potential, and coating material, along with medium properties like density, viscosity, ionic strength, and pH, to model evolving patterns in a population of ENMs along with their interaction with associated ions and molecules. The model predictions for agglomeration and dissolution are compared with in vitro measurements for various types of ENMs, coating materials, and incubation media, and are found to be overall consistent with measurements. The model has been implemented for an in vitro case in cell culture systems to inform in vitro dosimetry for toxicology studies, and can be directly extended to other biological systems, including in vivo tissue subsystems by suitably modifying system geometry.
Keywords: Engineered nanomaterials, Agglomeration, Dissolution, Settling, Monte Carlo, Cellular dosimetry, Modeling and simulation, Instrumentation
Introduction
The rising use of engineered nanomaterials (ENMs) in a variety of consumer products has increased concerns regarding the potential toxicity and risks associated with human exposures to such materials. Risk assessment of nanoscale materials has thus become a high priority for stakeholders, including environmental agencies and product manufacturers (Oberdorster 2010). A complete health risk-analysis of any chemical requires a comprehensive “source-to-dose-to-effect” assessment for humans, which requires multiple in vitro and in vivo studies across various species (Georgopoulos 2008; Gajewicz et al. 2012). A thorough characterization of the physicochemical properties and dynamic behavior of ENMs in various media is required for each step involved in this process.
ENMs differ from “conventional” chemicals due to their “nanoscale properties,” which result in complex particle-particle and particle-media interactions in environmental, chemical, and biological settings. Properties of ENMs (such as size, shape, chemical composition, surface area, zeta potential, and nature of coating) and media properties (such as density, viscosity, and pH) affect the kinetics and dynamics of the ENMs, involving agglomeration, dissolution, diffusion, and sedimentation. These processes lead to changes in size, shape, and chemical composition of the ENMs and are liable to affect their distribution and toxicity in biological tissues (Cohen et al. 2013; Wang et al. 2014). Agglomeration, along with dissolution, leads to a change in the physical state of ENMs in intracellular and extracellular media, thus directly influencing the manner and extent of their interaction with biological systems (Jiang et al. 2009; Bae et al. 2010). Such phenomena in environmental or biological media have a direct influence on each step of the “source-to-dose-to-effect” analysis for ENMs.
Physicochemical transformations of micro and nano-sized particles have been studied widely in relation to both environmental exposure and biological toxicity. Mathematical modeling of dynamics of particles in fluids has been pursued widely as well (Mason and Weaver 1924). Researchers have employed the aerosol general dynamic equation (GDE) to model transformation of particulate matter in environmental and biological systems (Lazaridis et al. 2001; Broday and Georgopoulos 2001). The ISDD (In vitro Sedimentation, Diffusion, and Dosimetry) model developed by Hinderliter et al. (2010) simulates NP diffusion and sedimentation, employing a differential equation-based framework for in vitro dosimetry. However, the ISDD model only considers noninteracting particles and does not include dynamic agglomeration or dissolution which would be expected to occur simultaneously with diffusion and settling for interacting NPs like AgNP. More recently, Liu et al. (2011) developed a stochastic direct simulation Monte Carlo (DSMC) model which included dynamic agglomeration along with the other processes included in the ISDD model. However, like the ISDD model, it also did not consider NP dissolution. Prediction of biological toxicity would be incomplete without a simultaneous quantification of silver ion production by dissolution as this “Trojan-horse mechanism” is widely known to play a critical role in cellular toxicity due to AgNP (Park et al. 2010). Thus, biological risk assessments for NPs have been incomplete due to lack of information regarding the physical state of the particles as they dynamically change over the span of a study (Wijnhoven et al. 2009). Models which can relate NP transformations and interactions to their intrinsic nanoscale properties and the properties of the medium can considerably reduce uncertainties in biological risk assessment of these new materials. The ADSRM model developed here mechanistically describes the complete set of processes involved in the interaction between ENMs and their environment and is the only computational model, known to us, that includes the entire spectrum of kinetic and dynamic transformation processes important for nanoparticles, specifically aggregation, diffusion, sedimentation, and dissolution of nanoparticles in a predictive and mechanistic framework, which is applicable to in vitro, as well as in vivo biological systems. It has been developed as a tool that can be used to predict ENM transformation and transport for a variety of media and conditions, to estimate cellular dosimetry in cell cultures for toxicological studies, as well as for in vivo intra and extra cellular domains.
Approach and methods
Modeling transport of particles in medium
Mathematical descriptions of particle transport in fluids (diffusion, advection, and gravitational settling) have been available for almost a century (Bird et al. 1960). In biological and environmental media, the processes of gravitational sedimentation, diffusion, agglomeration, and dissolution occur simultaneously. The current study employs a “modular” modeling approach, where each process has been separately modeled using well-known mechanistic rate equations, and each rate has been incorporated in a stochastic framework utilizing a direct simulation Monte Carlo (DSMC) scheme.
Gravitational sedimentation of NPs is described mathematically by Stokes’ Law (Kajihara 1971), which determines the sedimentation rate (v) of particles in a solution as a function of medium viscosity (μ), the densities of particles and media (ρp; ρf), diameter of the particles (d), and the acceleration due to gravity (g). The ISDD model of Hinderliter et al. 2010 modeled gravitational settling using Stokes’ Law and Sterling's modification of Stokes’ Law for agglomerates. For single particles, Stokes’ Law is given by
| (1) |
Equation 1 defines the sedimentation velocity for single particles. The agglomerate sedimentation velocity is described by Sterling's equation (Sterling et al. 2005) as
| (2) |
Here, effective agglomerate density, ρagg and effective agglomerate diameter, dagg are properties of agglomerates that can be estimated from individual particle properties according to Sterling (Sterling et al. 2005) as
| (3) |
In Eqs. 2 and 3, the parameters fP and fD stand for packing factor and fractal dimension, respectively. Agglomerates are not homogenously packed units but have a fractal structure (Sterling et al. 2005). The packing factor, PF varies between 0 and 1, and reflects the ratio of solid volume over total volume of an agglomerate. εagg is the effective porosity of the agglomerate and n is the number of primary NPs in the agglomerate.
The Stokes–Einstein equation describes the rate of diffusion (D) as a function of particle diameter (d), medium viscosity (μ), and temperature (T), as
| (4) |
Here kB is Boltzmann's constant with a value of 1.38 × 10⁻²³ m2kg/K/s2.
Advection (transport due to fluid motion) has not been included in this analysis, as it can be considered negligible for many in vitro and in vivo toxicological systems of concern; however, advection must be included when considering biological fluids (such as blood) in motion.
Modeling of dynamic agglomeration
Aggregation of NPs in solution is a complex phenomenon because it is affected by diffusion of individual particles and agglomerates and by the attractive and repulsive forces acting between each other. Aggregation of NPs in a medium can be modeled using the Smoluchowski equation (Hunter 2001). Smoluchowski modeled the fast coagulation of non-interacting particles using a convection-diffusion equation and developed a population-balance equation (PBE) for the development of aggregates of k particles through the collision of aggregates with i and j particles (where i + j = k). The PBE developed by Smoluchowski can be presented as
| (5) |
Here ni is the particle number concentration of the ith agglomerate, and βij is the agglomeration rate constant between the ith and the jth agglomerates. The agglomeration rate constant βbij is given by
| (6) |
Here, ri and rj are the effective radii of the two colliding agglomerates, the effective radii being calculated from Eq. 3 based on the numbers of primary particles constituting them. Smoluchowski's equation does not consider inter-particle attractive or repulsive interactions. The PBE equation developed by Smoluchowski can be modified to include such inter-particle interactions using the DLVO (Derjaguin–Landau–Verwey–Overbeek) theory. This involves replacing the agglomeration rate constant, β, in Eq. 5 by the modified agglomeration rate constant, k, where k = β/W, W being the stability ratio. The stability ratio is defined by the ratio of the total number of collisions between particles over the number of collisions that result in agglomeration (Hunter 2001), and is a measure of the stability of the particle dispersion. McGown and Parfitt (1967) used the DLVO theory to formulate an expression for Wij, the stability ratio for the ith and jth agglomerate pairs, as follows:
| (7) |
The denominator in Eq. 7 represents the number of collisions that result in agglomeration and is a function of ϕA,ij, the attractive van der Waals’ electric potential, while the numerator represents the total number of collisions and is a function of ϕT,ij. The total interaction potential, ϕT,ij, is the sum of the attraction potential, ϕA,ij, and the electric repulsion potential, ϕR,ij, for the pairs of agglomerates. s is a dimensionless distance between the pair of agglomerates given by s = 2R/(ri + rj), where R is the distance between the centers of the two agglomerates and ri, rj are the radii of the agglomerates estimated by Eq. 3. The stability equation (Eq. 7) integrates the interaction potential over the entire range of distance, from infinite distance of approach to collision, which is represented by s = 2. The attractive and the repulsive interaction potentials given by ϕA,ij and ϕR,ij can be estimated from established physical relations (Gregory 1975, 1981) between electric forces and parameters of the NPs and media, which are shown in detail in the Supporting Information (SI). Then the agglomeration rate constant, kagg,ij is calculated as
| (8) |
Modeling of nanoparticle dissolution
NP dissolution processes depend on the particular chemistry of the NP and the ions present in the media. AgNP is known to be oxidized by dissolved oxygen (DO) in the media and the reaction is also influenced by the protons (H+) in the media (Zhang et al. 2011; Tejamaya et al. 2012). The chemical reaction for the oxidation of Ag in solution can be expressed as Zhang et al. (2011):
The chemical equilibrium for the above reaction can be assessed using Nernst equation, as
| (9) |
Here, R is the Universal Gas constant, T is the temperature of the reaction medium, F is Faraday's constant, and n is the difference in the number of molecules between reactants and products based on reaction stoichiometry. Eo is the standard reaction potential (at 25 °C) for the reaction whose value is 0.47 volts (Zhang et al. 2011). Enet is the net free energy released by the reaction and needs to be positive for the reaction to proceed. The forward reaction given by the Ag oxidation reaction, stops when chemical equilibrium is reached, i.e., when Enet becomes negative. Anions present in the media, like phosphate or sulfide ions, would increase the rate of silver oxidation by precipitating the produced Ag+ ions as their respective salts and shifting the equilibrium to the right in the Ag oxidation reaction. Presence of such ions has not been considered in this version of the model. However, it has been shown by Zhang et al. (2011) that based on ionic equilibria, Ag+ would precipitate as salts starting with Ag3PO4 at a minimum concentration of 1.9 × 10⁻⁵ mol/L. The Ag+ concentrations produced in the entire time span of this study are lower than the threshold required for the precipitation of the salts.
Nanoparticle surface reaction
According to the stoichiometric equation, the release rate of Ag? ions can be expressed by an ordinary differential equation as
| (10) |
Here, [Ag+], [Ag], [O2], and [H+] represent the concentrations (in mol/L) of Ag ions, solid Ag, DO, and protons, respectively, and k is the dissolution rate constant. For reactions involving NPs, the size and surface area of the NPs become limiting criteria, as the reactions would depend on collisions with the other chemical agents in the system (Fogler 2005). Thus the reaction rate would be limited by the surface area of the NPs in the solution rather than by the concentration of solid Ag. So [Ag] in Eq. 10 would be replaced by πd2[AgNP], where [AgNP] represents the number concentration of nanoparticles. The reaction rate constant k would also depend on temperature (T) and activation energy (Ea) of the chemical reaction. Based on the hard-sphere collision theory, the rate constant can be expressed as Fogler (2005):
| (11) |
Here, R is the Universal Gas Constant and Ao is a scaling factor; fA is the fraction of the NP surface area that is exposed and available for reaction. Due to the presence of coatings and stabilizing agents, the entire surface area of the NPs might not be exposed to reaction. Estimation of the available surface area is dealt with in the next section. [H+], the concentration of hydrogen ions in the solution, can be related to the pH of the solution as: H+ = 10 −pH. [O2] represents the concentration of dissolved oxygen (DO) in the solution which is the primary oxidizing agent.
Citrate stabilization
The oxidation of Ag into Ag+ is also affected by other chemicals present in the media. ENMs are usually coated or stabilized by a chemical which acts as a reducing agent and prevents the oxidation of Ag. Citrate is one of the most common stabilizing agents used with silver nanoparticles. In the specific example of citrate-stabilized AgNP, the citrate ions act as a reducing agent. Citrate ions are oxidized by DO in the media and the reaction can be formulated as follows: where C3− represents the trivalent citrate ion . The rate constant for the oxidation of citrate ions has been estimated from literature data; the details of the calculation are included in the SI. Presence of citrate ions as a stabilizing agent around the NPs protects them from oxidation and dissolution in the medium. To quantify the extent of the protection, a variable Fcoat is defined as the ratio of the total moles of citrate adhered to the NPs to the total surface area of the NPs:
| (12) |
The fraction of NP surface area that is available for reaction, can be estimated from the current amount of citrate in the CV and the total surface area of ENMs which is dynamically updated in the model. Lower pH leads to higher protonation of the citrate ions and greater surface area of NPs exposed to oxidation. The fraction of exposed surface area of ENMs changes dynamically with time as citrate ions are oxidized in the medium. Estimation of Fcoat and the fraction of exposed surface area are included in the SI.
Dissolved oxygen
DO is depleted from the system due to both Ag oxidation and citrate reduction reactions. As in the present in vitro assay whose behavior has been simulated by the model, reaction systems exposed to ambient air are dynamically replenished by oxygen from air. The mass transfer of O2 from air is described by the equation Zhang et al. (2011):
| (13) |
Here, KO2 is the mass transfer coefficient for oxygen from air to media and CS is the saturation concentration of DO in the media at the ambient temperature. Zhang et al. (2011) measured the initial DO concentration in their medium to be 7.8 mg/L and also estimated the mass transfer coefficient of oxygen KO2 to be 6.01 μmol/L/hr. The transfer of oxygen is considered diffusion-limited and the transport of DO from the solution to the NP surface has been considered to occur at a faster rate. All relevant parameter values have been summarized in Table 1.
Table 1.
Parameter values used in the model
| Parameter | Value | References notes |
|---|---|---|
| Packing factor, fP | 0.637 | Sterling et al. (2005) |
| Fractal dimension, fD | 2.3 | Hinderliter et al. (2010) |
| Permittivity of vacuum, εo | 8.854 × 10⁻¹² farad/m | |
| Relative permittivity, ε | 80 | Based on water at 20 °C |
| Activation energy, EA | 33 × 103 J | Zheludkevich et al. (2003) |
| Rate constant for citrate oxidation, kCit | 1.235 × 10⁻¹⁰ mol/m3/sec | Estimated from Zhang et al. (2011) |
| Mass transfer rate of O2, KO2 | 1.67 × 10⁻⁶ mol/m3/sec | Estimated by Zhang et al. (2011) |
| Saturation conc. of O2, CS | 8.96 mg/L | Zhang et al. (2011) |
| Standard oxidation potential, Eo | 0.47 V | Zhang et al. (2011) (SI) |
| Density of medium, ρf | 1000 kg/m3 | Density of water |
| Viscosity of medium, μ | 0.001 Pa-s | Viscosity of water |
Modeling NP behavior using direct simulation Monte Carlo (DSMC) method
As mentioned in the Background section, modeling dynamic phenomena in dispersed systems involving particle transport and transformation processes have been carried out in the past using the aerosol general dynamic equation (GDE) (Lazaridis et al. 2001). However, the GDE is a deterministic equation, with process descriptions modeled entirely using predetermined rate laws. In contrast, stochastic methods such as Monte Carlo (MC) capture the underlying probabilistic nature of the processes and simplify considerably the programming effort (Kruis et al. 2000). Event-based processes like agglomeration are generally well suited to be modeled using MC schemes. Such schemes enable the inclusion of multiple particle transformation mechanisms in a straightforward manner (Zhao et al. 2007) and also record the history of particle populations, thus providing a way to visualize the evolution of a particular nanoparticle population in a given medium. Particle transport processes can also be treated in a stochastic manner and incorporated seamlessly into the MC simulation scheme (Hollander et al. 2001).
System geometry
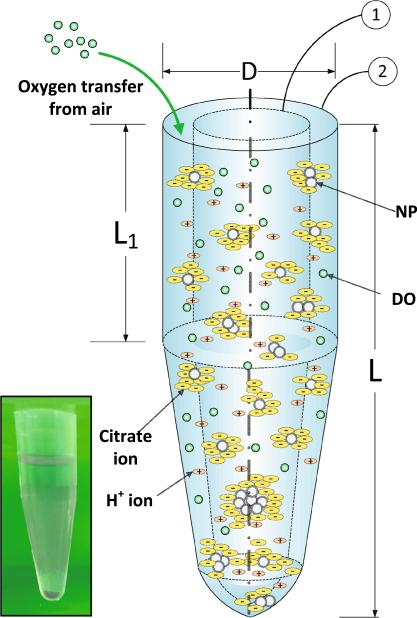
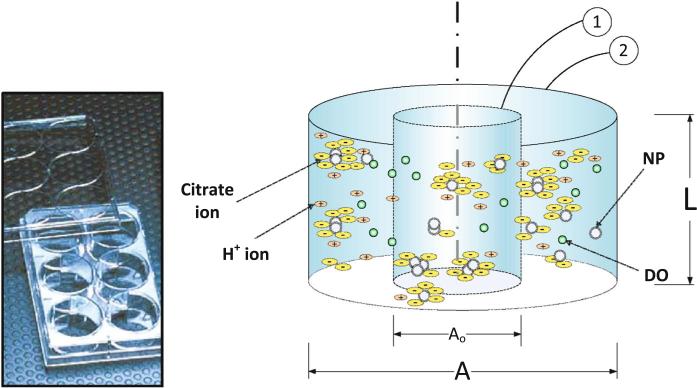
The modeling scheme used here employs a direct simulation Monte Carlo (DSMC) method, which is a “time-driven” algorithm (Zhao et al. 2007). Liu et al. (2011) used the DSMC method to model nanoparticle agglomeration and diffusion employing a constant number MC approach. We have also used the constant number DSMC according to Liu et al., but have made critical changes and modifications in order to capture realistic nanoparticle scenarios, both in vitro and in vivo. Unlike a cubical control volume used in Liu et al., the control volumes used here (shown in Figs. 1 and 2) reflect the geometry of the culture systems used for toxicological studies in vitro. The model can also be directly modified for other geometries, based on the particular system it simulates. Also, a critical requirement relevant to dosimetry assessment for in vitro studies, is to quantify the fraction of NPs settling at the bottom of the system with time. Tracking the amount of NPs settled with time necessitates replication of the exact geometry of the system, as settling is affected by shape and size of the vessel and also by the height of the fluid. Dissolution is a critical aspect of toxicological studies with AgNP because of the importance of ionic silver in cellular toxicity Wijnhoven et al. (2009). The model described here includes dissolution using a particle-based surface area limited reaction mechanism, involving all chemicals and ions present in the system.
Fig. 1.
Schematic diagram showing the implementation of the DSMC method for the in vitro system from Leo et al. (2013), with the control volume (CV) and the actual tube labeled as 1 and 2, respectively along with an image (inset) of the actual Eppendorf tube used for the in vitro measurements. Nanoparticles, dissolved oxygen (DO), hydrogen, and citrate ions are represented in the system. Total length, L, and diameter, D, are 4 cm and 1.4 cm, respectively based on the actual Eppendorf tube used for measurements. L1, the length of the cylindrical portion of the tube, is 47 % of the total length of the tube. (Diagram not drawn to scale and is for illustration purposes only)
Fig. 2.
Schematic diagram showing the implementation of the ADSRM model for citrate-stabilized AgNP in an in vitro culture well, with the control volume and the actual well shown as 1 and 2, respectively, along with an image (inset) of a Falcon 6-well plate used for in vitro measurements (Diagram not drawn to scale and is for illustration purposes only)
Steps in the Monte Carlo process
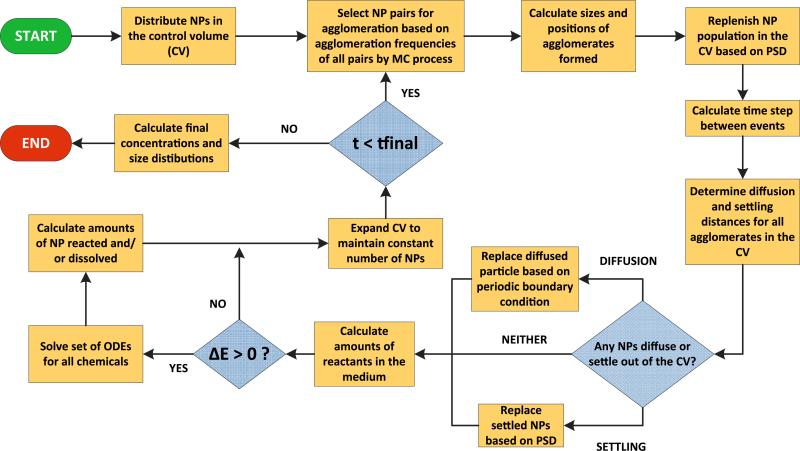
An example modeled system shown in Fig. 1 shows the control volume (CV) (identified as item 1 in the figure) and the entire incubation tube (identified as item 2), with the actual tube used for measurements shown inset. The CV has been selected to contain 10,000 particles, initially all being monomers and uniformly dispersed in the medium. The diameters of the particle population are randomly selected from the Particle Size Distribution (PSD) corresponding to the study. The steps in the MC process are schematically expressed in Fig. 3. The 10,000 NPs in the CV are randomly distributed along the vertical height of the CV, so that the position zi of the ith NP is randomly selected from the uniform distribution, U(0, L), where L is the height of the CV. The agglomeration rates (Kagg) and transport parameters (Diffusivity, D, and sedimentation velocity, V) for the NPs in the CV are computed using Eqs. 1 and 8. In this implementation of the model, we consider Nt = 100 agglomeration events at every time step. Then the time interval to the next step is calculated using the formula:
| (14) |
In the next step, the NPs participating in the 100 agglomeration events are selected by the MC algorithm, based on their mutual rates of agglomeration. The method employed is a sampling procedure proposed by Kruis et al. (2000): in this procedure, the agglomeration rates for all possible pairs of NPs in the CV are sequentially added, until the sum exceeds the value of a randomly sampled number. The mass of the newly formed agglomerate is the sum of the masses of the pair of NPs undergoing agglomeration and the agglomerate diameter is calculated using Eq. 3. Subsequently, the diffusion and settling distances, zD,i and zS,i respectively, are calculated based on the respective transport equations. zS,i is given by zS,i = vS,i.Δt, where vS,i is the particle's Stokes’ settling velocity given by Eq. 2. The distance traveled due to diffusion, zD,i, is estimated using the approach of Liu et al. (2011), employing a random number sampled from a normal distribution such that zD,i ~N(0, 2DiΔt, where Di is the Brownian diffusivity for the particle calculated from Eq. 4. Thus the total vertical distance traveled by the ith particle would be given by Δzi = zD,i zS,i. NPs which attain a vertical position zi ≤ 0 are considered to have settled. The settled NPs are taken out of the distribution of NPs considered in the CV and are replaced by NPs from outside the CV. The DSMC modeling scheme implemented here being a constant number Monte Carlo method, the number of NPs in the CV has to be maintained constant. Accordingly, the particles lost from the CV due to settling or agglomeration with other particles are replaced continuously. Unlike in Liu et al. (2011), where particles are replaced from the original PSD, in this DSMC scheme replacement of particles has been carried out from the current PSD of particles within the CV, based on the assumption that the PSD of particles both internal and external to the CV would be similar due to being part of the same continuous system. The model was run using Matlab® utilizing a 64-core (8 CPU × 8) Sun/ Oracle Intel Xeon 7560 server machine.
Fig. 3.
Schematic diagram showing the steps of the direct simulation Monte Carlo (DSMC) method implemented in this study
Inclusion of reaction within the DSMC scheme
A surface area-based oxidation reaction mechanism has been implemented in the DSMC scheme using a particle-based approach, where particles and agglomerates suffer oxidation based on their exposed surface area. The oxidation of citrate and the accompanying decrease in citrate stabilization is assumed uniform over all the particles in the CV. For each Monte Carlo time step estimated from Eq. 14, a set of ODEs similar to Eq. 10, for Ag+, citrate, and O2, is solved simultaneously. All individual component particles in an agglomerate are assumed to contribute equally to the dissolution based on their surface area. The amounts of all chemicals (silver, citrate, oxygen, and hydrogen) are calculated simultaneously, and their individual amounts are updated for the next step in the Monte Carlo process.
Evaluation of the model with different AgNPs and coating materials
The ADSRM model was evaluated with different batches of AgNPs and compared with corresponding results from the literature. The model was tested with widely different values of pH and incubation times, as well as with different AgNP sizes and surface chemistries. The various AgNPs and their properties are listed in Table 2. Citrate-stabilized AgNPs (referred to as L20) with a nominal size of 20 nm were utilized by Leo et al. (2013) to study long-term agglomeration and dissolution in media of various pH to reflect conditions in the human respiratory system. Tejamaya et al. (2012) utilized AgNPs of 3 different coatings—citrate, poly-ethylene glycol (PEG), and poly-vinyl pyrrolidone (PVP), for studies of agglomeration. These AgNPs with a nominal size of 10 nm are referred to as TC10, TPG10, and TPV10, for the citrate, PEG, and PVP-coated particles, respectively. Liu and Hurt (2010) used 1–2 nm citrate-coated AgNPs to study dissolution kinetics under different conditions. These AgNPs have been referred to as LH1. Additionally, the model was also evaluated with a set of citrate and PVP-coated AgNPs (referred to as C20, C110, P20, & P110) used by Wang et al. (2014) for their effect on dosimetry in cell culture plates used for in vitro studies with cells. The detailed list of parameters for all different types of AgNPs and their associated media are summarized in Table 3. The parameters have been obtained from the respective article and wherever unavailable have been replaced by default values. Unlike citrate which undergoes oxidation in the medium (as discussed in ’Citrate stabilization’ Section), PEG and PVP are more stable in various media and are potentially permeable to solutes and solvents (Tejamaya et al. 2012). Accordingly, oxidation of AgNP coatings has been assumed to be zero for PEG and PVP coatings, unlike citrate coatings. Unlike citrate, which stabilizes by repulsion, PEG and PVP stabilize NPs through steric hindrance (Cumberland and Lead 2009). Tejamaya et al. (2012) have used three different media for incubation of the AgNPs—chloride (CM), nitrate (NM), and sulfate (SM) media. Detailed calculation of the ionic strengths of each media is presented in the SI. The shape and size of the reaction vessel also have important effects in the physical phenomena, especially in settling. For the evaluation with L20 NPs, the Eppendorf tube used by Leo et al. (2013) has been replicated. Both Tejamaya et al. (2012) and Liu (2010) have used cylindrical tubes of different volumes. Evaluation has also been carried out in representative cell culture plates using RPMI 1640 culture media for a realistic scenario in predicting cellular dosimetry.
Table 2.
AgNP properties
| NP | Coating | Core material | Density (g/cm3) | Mol.Wt. | Coating Mol.Wt | Zeta potential (mV) |
|---|---|---|---|---|---|---|
| L20 | Citrate | Ag | 10.49 | 108 | 258 | –39.2 |
| TC10 | Citrate | Ag | 10.49 | 108 | 258 | NR |
| TPG10 | PEG | Ag | 10.49 | 108 | 5,000 | NR |
| TPV10 | PVP | Ag | 10.49 | 108 | 10,000 | NR |
| LH1 | Citrate | Ag | 10.49 | 108 | 258 | NR |
| C20 | Citrate | Au | 10.87 | 115.3 | 258 | –44.3 |
| P20 | PVP | Au | 10.87 | 115.3 | 10,000 | –38.2 |
| C110 | Citrate | Au | 10.49 | 108.04 | 258 | –45.2 |
| P110 | PVP | Au | 10.49 | 108.04 | 40,000 | –31.6 |
Source: AgNP properties (for L20) from Leo et al. (2013); AgNP properties (for C20, P20, C110, P110) from http://www.nanoComposix.com
NR Not reported
Table 3.
Study specific parameter values used in the model
| Parameters | Leo et al. (2013) | Tejamaya et al. (2012) | Liu and Hurt (2010) |
|---|---|---|---|
| Apparatus | Eppendorf tube | HDPE vials | Plastic tubes |
| Vessel vol. (mL) | 4 | NR | 15 |
| Study duration (days) | 14 | 21 | 7a |
| NP mean dia. (nm) | 20 | 11.6, 10.3, 10.8 | 1-2 |
| NP density (g/mL) | 10.49 | 10.49 | 10.49 |
| NP coating | Citrate | Citrate, PEG, PVP | Citrate |
| Coating mol. wt. | 258 | 258, 5000, 10000 | 258 |
| Zeta potential (mV) | −18.2, −22.5, −32.5 | NR | NR |
| NP conc. (mg/L) | 25 | 4.8, 2.4, 3 | 2, 0.2, 0.05 |
| Ionic strength (M) | 0.1 | 0.0018, 0.0018, 0.0022 | NR |
| pH | 3, 5, 7 | 7.3, 7.4, 7.2 | 5.68 |
| Dissolved O2 (mg/L) | NR | NR | 9.1 |
| Temperature | 37 °C | NR | 20 °C |
Actual study duration was up to 10 days for some samples, but measurements for until 7 days was taken for comparison, for uniformity across different samples
NR Not reported
Results and discussion
Aggregation of AgNP
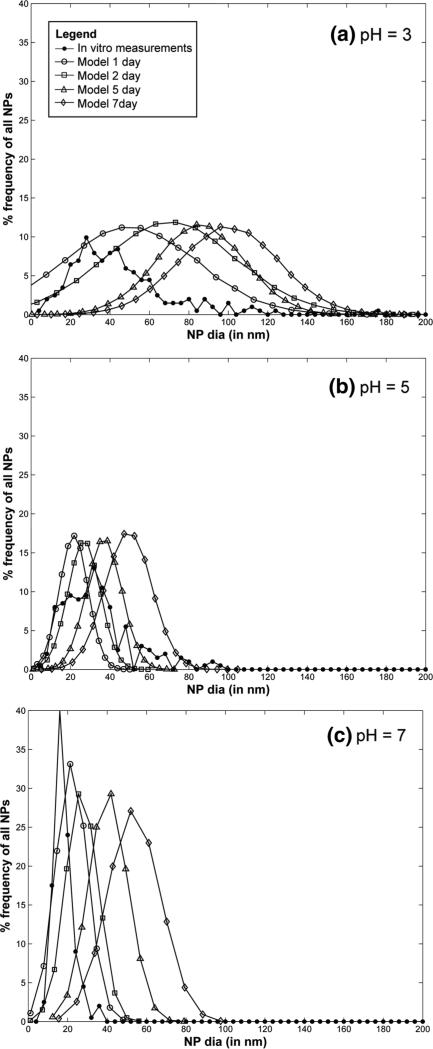
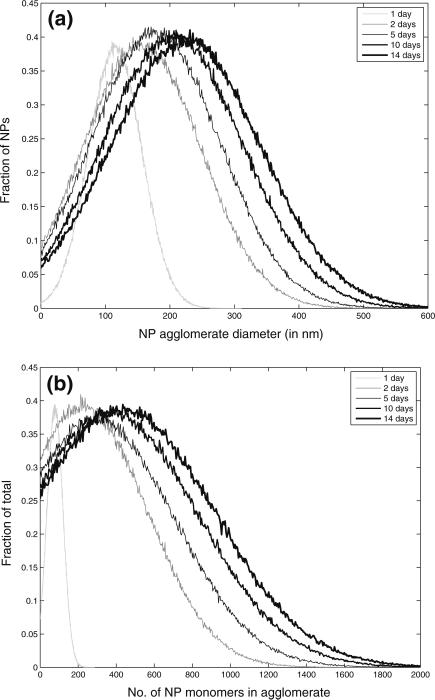
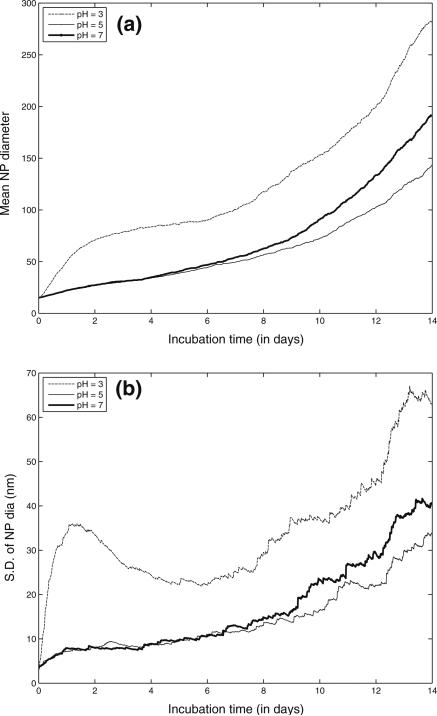
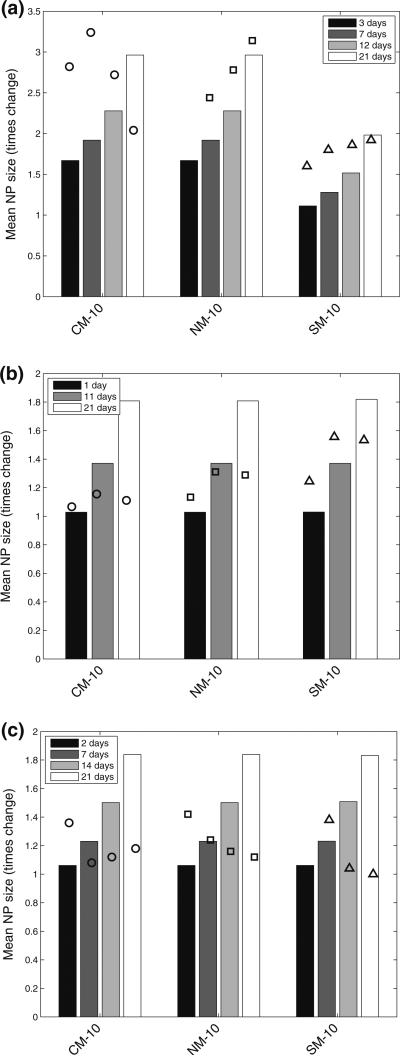
Aggregation of citrate-stabilized AgNP was simulated using the ADSRM model developed in this study, and model predictions were compared with in vitro measurements from Leo et al. (2013) for citrate-stabilized AgNP incubated for 7 days in a sodium perchlorate buffer. The values of the parameters pertaining to the incubation medium are summarized in Table 1. Values of other parameters used in the implementation of the model are also shown in Table 1. Figure 4a, b, and c shows comparisons between the measurements from Leo et al. (black dots) with model predictions for 1, 2, 5, & 7 days. The system with the medium at pH = 3 shows the largest increase in diameter followed by the system with medium at pH 5. At a pH 7, which is the same as distilled water, the agglomeration is negligible at 7 days. The model in general predicts faster agglomeration than what is observed in the in vitro system. This might be due to additional stabilization by the citrate ions, which prevents aggregation of NPs. There is large uncertainty in the quantification of citrate coating and surface coverage, as direct measurements were not carried out in the specific medium. The observed difference between model predictions and measurements might also be due to the difference in the estimation of agglomerate diameters between model and measurement. For the in vitro measurement technique, the average of two largest dimensions of NPs was recorded (Leo et al. 2013) as the estimate of diameter. The model, however, estimates the effective spherical diameter (or the hydrodynamic diameter) from Eq. 3, which might be different from the measured diameter in vitro employing the above technique, since NPs tend to form elongated strands due to agglomeration (Leo et al. 2013). However, the change in diameter is comparable to that observed by Zhang et al. (2011) in the linear growth phase. Decrease in pH is accompanied by an increase in ionic strength, as shown in Table 1, which leads to a compression of the electric double layer, thus increasing inter-particle interaction (Delay et al. 2011), leading to increased agglomeration. Particle agglomeration is affected by the surface zeta potential, ζ, which alters with change in medium pH and ionic strength, I (Elzey and Grassian 2010). The variation of ζ with pH and I is modeled using measurements from Leo et al. (2013) and Salgin et al. (2012). The details of the functional modeling expressing ζ with pH and i are included in the SI. pH is known to have a stronger effect (Cunha 2011) on particle ζ and for values of pH higher than the isoelectric point (pI), a decrease in pH shifts the value of ζ closer to zero and leads to greater agglomeration. Figure 5a and b shows the size and number distribution, respectively, of the NPs in the CV at 1, 2, 5, 10, and 14 days after incubation. The figures show that the size and number distributions in the CV become progressively broader and move towards larger sizes as time progresses. Figures 6a and b show the changes in NP diameter mean and standard deviation of the NP population in the CV for different values of pH. A pH of 3 leads to much greater agglomeration resulting in larger mean diameter and also larger variation in diameters across the population. The difference between the plots for pH 5 and pH 7 is minor because the effect of higher pH is reduced due to decreased dissolution at higher pH. While a lower pH of 5 causes more agglomeration than a pH of 7, increased Ag dissolution at a pH of 5 (shown in dissolution results) causes reduction in the agglomerate diameters thus canceling the effect due to increased agglomeration. Figure 7 shows comparisons of change in mean AgNP diameter with mean Z-values estimated by Tejamaya et al. (2012) for three different AgNPs—TC10 (citrate), TPG10 (PEG), and TPV10 (PVP) in 3 different media - CM-10, NM-10, and SM-10. The model captures the increase in size seen for the citrate-coated AgNPs. However, for the PEG and PVP-coated particles (Fig. 7b, c), the measurements show an apparent decrease in size which might be due to increased dissolution and/or precipitation. Interaction of PEG and PVP molecules with the various salts present in the media needs to be further examined to predict the temporal evolution of the particles more effectively. The discrepancy might also be because the measurements are Z-avg values and are compared to mean diameter values from the model. Z-avg values might change due to increased spread in the size distribution of the AgNPs (as shown by increase in SD in Fig. 6) and might not be exactly comparable to mean diameter.
Fig. 4.
Comparison of model prediction for 1, 2, 5, and 7 days and in vitro measurements for AgNP size distribution after 7 days of incubation at pH a 3, b 5, and c 7
Fig. 5.
Model simulation results of change NP population over the span of 14 days incubation time; panels (a) and (b) depict NP diameter distributions and distributions of number of primary NPs in an agglomerate in the model control volume as it changes over 1, 2, 5, 10, and 14 days of incubation in a medium of pH 3
Fig. 6.
Model simulation results of change in NP agglomeration state over the span of 14 days incubation time; panels (a) and (b) depict dynamic changes in NP mean diameter and standard deviation of NP diameter in the CV over 14 days of incubation in different pH
Fig. 7.
Comparison of ADSRM model predictions (vertical bars) of change in mean AgNP size over control and measurements (markers) over 21 days from Tejamaya et al. Tejamaya et al. (2012) with a citrate, b PEG, and c PVP-coated AgNPs
Settling of nanoparticles
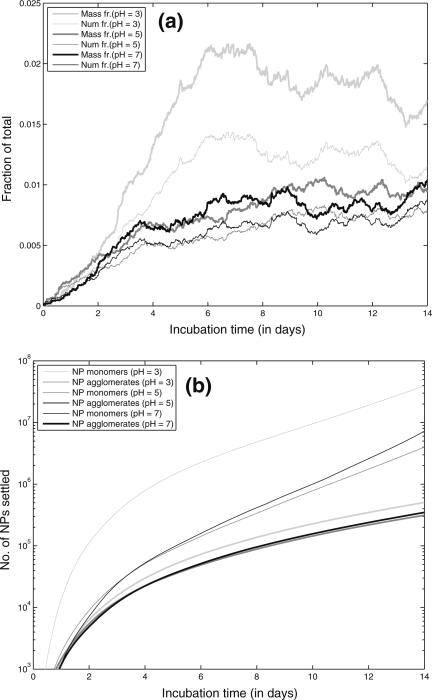
Figure 8a shows the fraction of NPs settled at the bottom of the tube for different values of pH. It shows the mass fraction of NPs settled and also the number fraction of primary NPs (monomers) settled. Gravitational settling depends on the height of the liquid level above the bottom of the vessel, since the particles have to travel downwards at the Stokes’ settling velocity given by Eq. 2. However, since the population of NPs inside the CV forms a representative sample of the entire population of NPs, the fractions settled would be the same for the NPs inside the CV as for the rest of the NPs. Figure 8a shows that there is a difference between the mass fraction settled and number fraction settled (thick and thin lines) and that the difference increases with time. This is due to the faster settling of the higher mass aggregates, leading to a higher total mass of the settled population. Acidic pH (pH = 3) leads to higher settling due to the formation of larger agglomerates. Lower pH also promotes increased protonation of the citrate ions which are used to stabilize the AgNP. Higher rate of citrate removal shifts the NP ζ-potential closer to the isoelectric point, thus reducing the inter-particle repulsion and promoting aggregation and settling. Figure 8b shows the estimated numbers of NPs settled in the CV. The thin line depicts the number of primary NP monomers settled, i.e., the total number of monomers settled irrespective of their state of aggregation. The bold line depicts the number of agglomerates settled. The increasing divergence of the 2 lines shows that the agglomerates that are settling have an increasing number of constituting monomers, i.e., the larger agglomerates tend to settle preferentially. Settling of NPs is important for estimating dosimetry for in vitro toxicological studies, where NPs are incubated with cell cultures generally located at the bottom of the vessel. The actual exposure of cells is to the settled population of NPs and not to the entire population (Hinderliter et al. 2010).
Fig. 8.
a Model results of fraction of NPs settled with bold line representing the mass fraction and the thin line representing the number fraction of primary monomeric NPs. b Model results of numbers of NPs settled; bold line represents the number of NP monomers which have settled irrespective of their state of aggregation and the thin line represents the number of NP agglomerates which have settled
Dissolution of AgNP
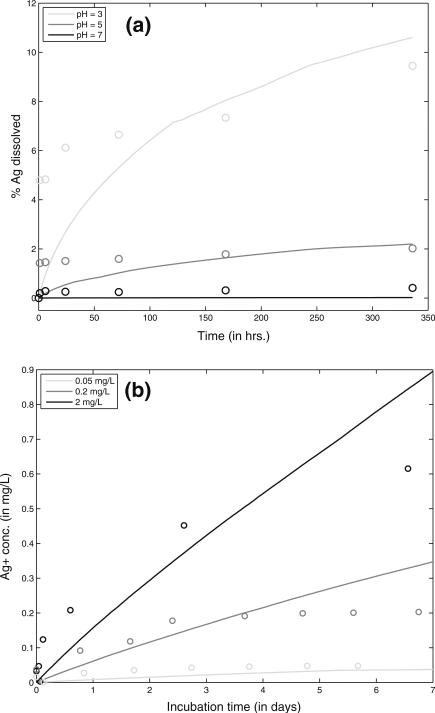
Dissolution of citrate-stabilized AgNP was simulated using the model developed for this study and model predictions were compared with in vitro measurements from Leo et al. (2013). The properties of the medium used by Leo et al. are summarized in Table 1. The model simulation was performed using DSMC for 14 days, for a population of 10,000 particles in the control volume and for 3 different pH values - 3, 5, and 7. The oxidation of Ag is dependent on the fraction of exposed surface area and is affected by the pH of the medium. Lower pH will lead to higher protonation of citrate resulting in higher exposed surface area available for oxidation. Figure 9a shows a comparison between model predictions and in vitro measurements over 14 days for pH 3, 5, and 7. The model predictions agree well with the measurements and capture both the initial high rate of dissolution and the later slower dissolution due to the decrease in reactive surface area of the NPs, as well as the decrease in DO. The reaction kinetics are dependent on the exposed surface area of the NPs; reduction in surface area due to agglomeration and settling causes a reduction in the dissolution rate. The reaction, however, does not reach equilibrium under the conditions and time span of the study. Figure 9b shows comparison with model predictions and measurements from Liu and Hurt (2010) for three different initial concentrations of AgNPs. The reactions do not cross the equilibrium line shown by Liu and Hurt and under the conditions explored do not reach equilibrium. The measurements appear to suggest a decrease in reaction kinetics, which is not adequately captured by the model. This might be due to some of the critical parameters like zeta potential, and ionic strength being unavailable for the study; they were replaced by default values for citrate-coated AgNPs.
Fig. 9.
Comparison of ADSRM model predictions (lines) of AgNP dissolution and in vitro measurements (circles) for 2 different studies. a Measurements over 14 days with citrate-stabilized AgNP (L20) from Leo et al. (2013) in media of 3 different values of pH; b Measurements over 7 days with citrate-stabilized AgNP from Liu and Hurt (2010) for 3 different initial concentrations of AgNP
ADSRM simulation for culture plates
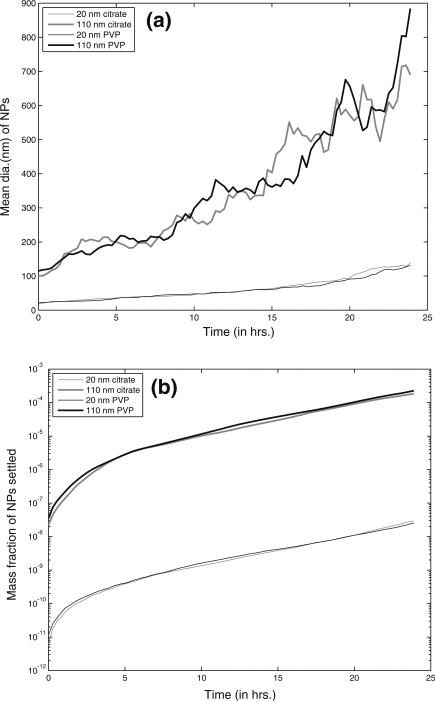
The ADSRM model was run for a time period of 24 h, using the NP properties summarized in Table 2. Figure 2 shows a schematic geometry of a culture plate, which has cells residing at the bottom. The simulation captures NP dosimetry to the cells at the bottom through a customized implementation of the ADSRM model. Figure 10a shows the changes in AgNP mean diameter over 24 h. In the in vitro culture, the cells at the bottom of the culture plate are not exposed to the entire population of NPs in the medium. Figure 10a shows that after 24 h, mean diameter of settled NPs reaches a value greater than 50 nm (for 20 nm NPs) and 400 nm (for 110 nm NPs), thus indicating that cells in the culture medium are exposed to NPs of far larger sizes than the initial dosage. The in vitro exposure of the cells to AgNP is also variable over time. Only a fraction of NPs which have settled (Fig. 10b) interact with the cells and that increases with time affecting cellular dynamics. Figure 10c shows that between 20 nm and 110 nm AgNP, the larger AgNP has a greater preference toward settling leading to a relatively higher mass dose for the cells at the bottom of the culture plate.
Fig. 10.
Model predictions from ADSRM for transformation processes of 4 different types of AgNP in RPMI 1640 medium over 24 h; a Mean diameter of all NPs in the medium over the time span of 24 h, and b mass fraction of AgNP settled
Study limitations
The ADSRM modeling framework demonstrated in this article has been developed as an integrative framework which draws from established models of particle-particle and particle-media interactions and supports prediction of ENM fate and transport in various media. The model is, however, limited by the fact that, whereas a wide variety of ENMs is present in the market today, very little characterization data exist for the nanoscale. ENMs tend to be characterized largely by their mass or concentration in solution, and this scarcity of data at the nanoscale leads to variability and uncertainty in predicting their fate in environmental or toxicological media. The ADSRM model developed here is based on available empirical relationships involving ENM interactions and various factors such as surface zeta potential, surface coating chemistry, media pH, and the concentration of other chemicals in the in vitro media. Unfortunately such detailed mechanistic relations could only be developed for silver ENMs, for which extensive studies are available. Applications of the ADSRM model are also limited by lack of information regarding coating chemistry. The model was developed initially for ENMs with citrate coating, but it has been extended to PEG and PVP coatings also, for which, however, extensive characterization information is lacking. Consequently, the model cannot adequately capture solution interactions involving polymer chains like PEG or PVP, which have more complex structures than citrate and would be expected to have a variety of chemical interactions at the nanoscale. Capturing all such mechanisms is beyond the scope of this article and requires, at the least, more detailed characterization measurements to be conducted.
Conclusions
The ADSRM modeling framework developed and implemented here for assessing cellular dosimetry is the first of its kind to include relevant physicochemical interactions of AgNP in media and estimate time dynamics of changes in NP form and quantity that affect the actual NP dose to cells in the media. The model captures the variations in ENM agglomeration with media characteristics and also with shape and size of the culture vessel, which can influence the fate of NP formulations in culture media. Dose-effect relationships developed using in vitro toxicological assays can be made more accurate by including dynamic changes in NP populations in the culture media affecting the number and sizes of NPs interacting with cells. Cell cultures residing at the bottom of culture plates are exposed to populations of NPs, with widely varying numbers and agglomeration states, resulting in widely different outcomes. The ADSRM model, when implemented and evaluated for multiple NP and coating combinations, can be directly applied to other NPs and for a variety of systems and media, given the relevant physicochemical parameters. The model development considers the various mechanisms such as agglomeration, sedimentation, diffusion, and reaction separately, so that new information regarding other NPs and coating materials and more detailed characterization information for silver ENMs could be easily incorporated into the model to give better predictions. It provides a useful tool that can be used to analyze complex behaviors of nanomaterials in chemical and biological media and help in better identification of cellular toxicity endpoints, while, in conjunction with in vitro and in vivo toxicological studies, it could improve understanding of particle-biosystem relationships.
Supplementary Material
Acknowledgments
Support for this work has been primarily provided by the NIEHS funded RESAC Center (Respiratory Effects of Silver and Carbon Nanomaterials—Grant Number U19ES019536-01). Additional support has been provided by the NIEHS sponsored Center for Environmental Exposures and Disease (CEED—Grant Number NIEHS P30E5S005022) at EOHSI. This work has not been reviewed by and does not necessarily represent the opinions of the funding agency. We would like to thank Linda Everett (Rutgers University) for editorial assistance and help with preparing the figures.
Contributor Information
Dwaipayan Mukherjee, Environmental and Occupational Health Sciences Institute (EOHSI), Rutgers University, Piscataway, NJ, USA; Department of Environmental and Occupational Medicine, Rutgers University-Robert Wood Johnson Medical School, Piscataway, NJ, USA; Department of Chemical and Biochemical Engineering, Rutgers University, Piscataway, NJ, USA.
Bey Fen Leo, Department of Materials and London Centre of Nanotechnology, Imperial College London, London, UK; Department of Mechanical Engineering, University of Malaya, Kuala Lumpur, Malaysia.
Steven G. Royce, Environmental and Occupational Health Sciences Institute (EOHSI), Rutgers University, Piscataway, NJ, USA Department of Environmental and Occupational Medicine, Rutgers University-Robert Wood Johnson Medical School, Piscataway, NJ, USA.
Alexandra E. Porter, Department of Materials and London Centre of Nanotechnology, Imperial College London, London, UK
Mary P. Ryan, Department of Materials and London Centre of Nanotechnology, Imperial College London, London, UK
Stephan Schwander, Environmental and Occupational Health Sciences Institute (EOHSI), Rutgers University, Piscataway, NJ, USA; Department of Environmental and Occupational Medicine, Rutgers University-Robert Wood Johnson Medical School, Piscataway, NJ, USA.
Kian Fan Chung, National Heart and Lung Institute, Imperial College London, London, UK.
Teresa D. Tetley, National Heart and Lung Institute, Imperial College London, London, UK
Junfeng Zhang, Nicholas School of the Environment and Duke Global Health Institute, Duke University, Durham, NC, USA.
Panos G. Georgopoulos, Environmental and Occupational Health Sciences Institute (EOHSI), Rutgers University, Piscataway, NJ, USA Department of Environmental and Occupational Medicine, Rutgers University-Robert Wood Johnson Medical School, Piscataway, NJ, USA; Department of Chemical and Biochemical Engineering, Rutgers University, Piscataway, NJ, USA.
References
- Bae E, Park HJ, Lee J, Kim Y, Yoon J, Park K, Choi K, Yi J. Bacterial cytotoxicity of the silver nanoparticle related to physicochemical metrics and agglomeration properties. Environ Toxicol Chem. 2010;29(10):2154–2160. doi: 10.1002/etc.278. [DOI] [PubMed] [Google Scholar]
- Bird RB, Stewart WE, Lightfoot EN. Transport phenomena. 1st edn. Wiley; New York: 1960. [Google Scholar]
- Broday DM, Georgopoulos PG. Growth and deposition of hygroscopic particulate matter in the human lungs. Aerosol Sci Technol. 2001;34(1):144–159. [Google Scholar]
- Cohen J, DeLoid G, Pyrgiotakis G, Demokritou P. Interactions of engineered nanomaterials in physiological media and implications for in vitro dosimetry. Nanotoxicology. 2013;7(4):417–431. doi: 10.3109/17435390.2012.666576. [DOI] [PMC free article] [PubMed] [Google Scholar]
- Cumberland SA, Lead JR. Particle size distributions of silver nanoparticles at environmentally relevant conditions. J Chromatogr A. 2009;1216(52):9099–9105. doi: 10.1016/j.chroma.2009.07.021. [DOI] [PubMed] [Google Scholar]
- Carneiro-da Cunha MG, Cerqueira MA, Souza BWS, Teixeira JA, Vicente AA. Influence of concentration, ionic strength and pH on zeta potential and mean hydrodynamic diameter of edible polysaccharide solutions envisaged for multinanolayered films production. Carbohydr Polym. 2011;85(3):522–528. [Google Scholar]
- Delay M, Dolt T, Woellhaf A, Sembritzki R, Frimmel FH. Interactions and stability of silver nanoparticles in the aqueous phase: influence of natural organic matter (NOM) and ionic strength. J Chromatogr A. 2011;1218(27):4206–4212. doi: 10.1016/j.chroma.2011.02.074. [DOI] [PubMed] [Google Scholar]
- Elzey S, Grassian V. Agglomeration, isolation and dissolution of commercially manufactured silver nanoparticles in aqueous environments. J Nanoparticle Res. 2010;12:1945–1958. [Google Scholar]
- Fogler H. Elements of chemical reaction engineering. 4th edn. Prentice Hall; Upper Saddle River: 2005. [Google Scholar]
- Gajewicz A, Rasulev B, Dinadayalane TC, Urbaszek P, Puzyn T, Leszczynska D, Leszczynski J. Advancing risk assessment of engineered nanomaterials: application of computational approaches. Adv Drug Deliv Rev. 2012;64(15):1663–1693. doi: 10.1016/j.addr.2012.05.014. [DOI] [PubMed] [Google Scholar]
- Georgopoulos P. A multiscale approach for assessing the interactions of environmental and biological systems in a holistic health risk assessment framework. Water Air Soil Pollut. 2008;8(1):3–21. [Google Scholar]
- Gregory J. Interaction of unequal double layers at constant charge. J Colloid Interface Sci. 1975;51(1):44–51. [Google Scholar]
- Gregory J. Approximate expressions for retarded van der Waals interaction. J Colloid Interface Sci. 1981;83(1):138–145. [Google Scholar]
- Hinderliter PM, Minard KR, Orr G, Chrisler WB, Thrall BD, Pounds JG, Teeguarden JG. ISDD: a computational model of particle sedimentation, diffusion and target cell dosimetry for in vitro toxicity studies. Part Fibre Toxicol. 2010;7(1):36. doi: 10.1186/1743-8977-7-36. [DOI] [PMC free article] [PubMed] [Google Scholar]
- Hollander ED, Derksen JJ, Bruinsma OSL, van den Akker HEA, van Rosmalen GM. A numerical study on the coupling of hydrodynamics and orthokinetic agglomeration. Chem Eng Sci. 2001;56(7):2531–2541. [Google Scholar]
- Hunter RJ. Foundations of colloid science. Oxford University Press; New York: 2001. [Google Scholar]
- Jiang J, Oberdrster G, Biswas P. Characterization of size, surface charge, and agglomeration state of nanoparticle dispersions for toxicological studies. J Nanoparticle Res. 2009;11(1):77–89. [Google Scholar]
- Kajihara M. Settling velocity and porosity of large suspended particle. J Oceanogr Soc Jpn. 1971;27(4):158–162. [Google Scholar]
- Kruis FE, Maisels A, Fissan H. Direct simulation Monte Carlo method for particle coagulation and aggregation. AIChE J. 2000;46(9):1735–1742. [Google Scholar]
- Lazaridis M, Broday DM, Hov O, Georgopoulos PG. Integrated exposure and dose modeling and analysis system 3. Environ Sci Technol. 2001;35(18):3727–3734. doi: 10.1021/es001545w. [DOI] [PubMed] [Google Scholar]
- Leo BF, Chen S, Kyo Y, Herpoldt KL, Terrill NJ, Dunlop IE, McPhail DS, Shaffer MS, Schwander S, Gow A, Zhang J, Chung KF, Tetley TD, Porter AE, Ryan MP. The stability of silver nanoparticles in a model of pulmonary surfactant. Environ Sci Technol. 2013;47(19):11, 232–11, 240. doi: 10.1021/es403377p. [DOI] [PMC free article] [PubMed] [Google Scholar]
- Liu HH, Surawanvijit S, Rallo R, Orkoulas G, Cohen Y. Analysis of nanoparticle agglomeration in aqueous suspensions via constant-number monte carlo simulation. Environ Sci Technol. 2011;45:9284–9292. doi: 10.1021/es202134p. [DOI] [PubMed] [Google Scholar]
- Liu J, Hurt RH. Ion release kinetics and particle persistence in aqueous nano-silver colloids. Environ Sci Technol. 2010;44(6):2169–2175. doi: 10.1021/es9035557. [DOI] [PubMed] [Google Scholar]
- Mason M, Weaver W. The settling of small particles in a fluid. Phys Rev. 1924;23(3):412–426. [Google Scholar]
- McGown DNL, Parfitt GD. Improved theoretical calculation of the stability ratio for colloidal systems. J Phys Chem. 1967;71(2):449–450. [Google Scholar]
- Oberdorster G. Safety assessment for nanotechnology and nanomedicine: concepts of nanotoxicology. J Intern Med. 2010;267:89–105. doi: 10.1111/j.1365-2796.2009.02187.x. [DOI] [PubMed] [Google Scholar]
- Park EJ, Yi J, Kim Y, Choi K, Park K. Silver nanoparticles induce cytotoxicity by a Trojan-horse type mechanism. Toxicol in Vitro. 2010;24(3):872–878. doi: 10.1016/j.tiv.2009.12.001. [DOI] [PubMed] [Google Scholar]
- Salgin S, Salgin U, Bahadir S. Zeta potentials and iso-electric points of biomolecules: the effects of ion types and ionic strengths. Int J Electrochem Sci. 2012;7:12, 404–12, 414. [Google Scholar]
- Sterling MC, Jr, Bonner JS, Ernest ANS, Page CA, Autenrieth RL. Application of fractal flocculation and vertical transport model to aquatic solsediment systems. Water Res. 2005;39(9):1818–1830. doi: 10.1016/j.watres.2005.02.007. [DOI] [PubMed] [Google Scholar]
- Tejamaya M, Romer I, Merrifield RC, Lead JR. Stability of citrate, PVP, and PEG coated silver nanoparticles in ecotoxicology media. Environ Sci Technol. 2012;46(13):7011–7017. doi: 10.1021/es2038596. [DOI] [PubMed] [Google Scholar]
- Wang X, Ji Z, Chang CH, Zhang H, Wang M, Liao YP, Lin S, Meng H, Li R, Sun B, Winkle LV, Pinkerton KE, Zink JI, Xia T, Nel AE. Use of coated silver nanoparticles to understand the relationship of particle dissolution and bioavailability to cell and lung toxicological potential. Small. 2014;10(2):385–398. doi: 10.1002/smll.201301597. [DOI] [PMC free article] [PubMed] [Google Scholar]
- Wijnhoven SW, Peijnenburg WJ, Herberts CA, Hagens WI, Oomen AG, Heugens EH, Roszek B, Bisschops J, Gosens I, Van De Meent D, Dekkers S, De Jong WH, van Zijverden M, Sips AJ, Geertsma RE. Nano-silver—a review of available data and knowledge gaps in human and environmental risk assessment. Nanotoxicology. 2009;3(2):109–138. [Google Scholar]
- Zhang W, Yao Y, Li K, Huang Y, Chen Y. Influence of dissolved oxygen on aggregation kinetics of citrate-coated silver nanoparticles. Environ Pollut. 2011;159(12):3757–3762. doi: 10.1016/j.envpol.2011.07.013. [DOI] [PubMed] [Google Scholar]
- Zhang W, Yao Y, Sullivan N, Chen Y. Modeling the primary size effects of citrate-coated silver nanoparticles on their ion release kinetics. Environ Sci Technol. 2011;45(10):4422–4428. doi: 10.1021/es104205a. [DOI] [PubMed] [Google Scholar]
- Zhao H, Maisels A, Matsoukas T, Zheng C. Analysis of four Monte Carlo methods for the solution of population balances in dispersed systems. Powder Technol. 2007;173(1):38–50. [Google Scholar]
- Zheludkevich ML, Gusakov AG, Voropaev AG, Vecher AA, Kozyrski EN, Raspopov SA. Studies of the surface oxidation of silver by atomic oxygen, chap. 30. In: Kleiman J, Iskanderova Z, editors. Protection of materials and structures from space environment, space technology proceedings. Vol. 5. Springer; Dordrecht: 2003. pp. 351–358. [Google Scholar]
Associated Data
This section collects any data citations, data availability statements, or supplementary materials included in this article.


