Abstract
Human exposure to specific environmental factors (e.g. air quality, lighting, and sound) is known to play an important role in the pathogenesis of many chronic diseases (e.g. asthma) and mental health disorders (e.g. anxiety). However, conventional fixed environmental monitoring stations are sparsely located and, despite environmental models, cannot adequately assess individual exposure levels. New forms of low-cost portable monitors have begun to emerge that enable the collection of higher spatial density “crowd sourced” data; however, the first generation of these low-cost environmental monitors have generally not been suitable for clinical environmental health studies due to practical challenges such as calibration, reproducibility, form factor, and battery life. In this paper, we present a wearable environmental monitor that overcomes these challenges and can be used in clinical studies The new device, called “Eco-Mini,” can be used without a smart phone and is capable of locally sampling and recording a variety of environmental parameters (Ozone, Sulfur Dioxide, Volatile Organic Compounds, humidity, temperature, ambient light color balance, and sound level) as well as individual activity (3-axis accelerometer) and location (GPS). In this paper, we also report findings and discuss lessons learned from a feasibility study conducted for one week with pediatric patients as part of an ongoing asthma research study.
I. Introduction and motivation
A. Air Pollution and Burden of Disease
The World Health Organization (WHO) recently declared air pollution to be the world’s largest environmental health risk, responsible for over 7 million deaths, with significant increases in morbidity, exacerbating symptoms in people with existing cardiovascular or pulmonary disease. In addition to the ambient air pollution due to growing urbanization and fossil fuel vehicles, approximately half of the world’s population is also exposed to high levels of indoor (household) air pollution, which is generated by smoke-producing biomass stoves used for cooking and heating [1].
B. Additional Environmental Factors
Although air pollution is considered the largest environmental health risk, other properties of our local environment (e.g. lighting, sound) have a demonstrated link to physical and mental health. Sound and noise levels have been identified as risk factors for several chronic diseases, including hypertension, ischemic heart disease, and anxiety disorders[2]. The color and intensity of ambient lighting has a wide range of neurobiological effects, including a profound impact on the human endocrine system, which governs processes such as melatonin production and our circadian rhythm [3-4]. An assessment of light exposure and light therapy is also important for treating jet lag and mood disorders [5].
C. Available Instrumentation
While interest in better environmental monitoring tools has existed for some time, the available commercial instrumentation has primarily been designed for industrial safety and environmental assessment. These personal toxic gas monitors are generally designed to detect only very high levels of toxic gases and are not suitable for monitoring lower ambient concentration levels in our every-day environment.
In terms of low-cost sensors, over the past several years, community groups and citizen scientists have developed a variety of very low-cost environmental monitors which are designed for large-scale “crowd sourced” participatory sensing, which often make use of the mobile phone GPS capability to create “crowd-sourced” environmental data maps that display air pollution [6, 7], sound level [8] or radiation level [9], for example. Unfortunately, the predominant air quality sensors employed in low-cost devices are metal-oxide sensors, which consume higher power (for the heater element) and also have a non-linear response, which makes sensor calibration and comparison of data across multiple sensors extremely difficult [10, 11]. Most recently, a lower power wearable device was developed exclusively for air quality mapping [12] which made use of electrochemical cells [13] for air quality sensing. However, this device required the simultaneous use of the mobile phone (for logging data as well as GPS location), did not measure other environmental parameters (e.g. light, sound, motion). While detection of particles instead of gases is also often used for air quality sensing, the detection of sub-micron size particles was not feasible within the size constraints of our small Eco-Mini. Furthermore, detection of specific gas species was preferred for better understanding the biochemical physiological response and understanding the environmental cause of the pollution.
D.Clinical Use of Wearable Sensors
Despite the enormous increase in the number of commercially available wearable devices to monitor physiology, the use of wearable sensors in medical research remains fairly limited. Aside from specialized diagnostic tools (e.g. Holter monitor), wearable accelerometers are increasingly being used for actigraphy, primarily in sleep medicine, but increasingly in other fields of clinical research (behavioral medicine, obesity studies) [14]. The use of actigraphy devices in medicine also sheds light on the fact that there exist important differences in the way wearable devices are used by clinical researchers vs home consumers. Unlike consumer devices, which are generally designed to communicate with a mobile phone and provide continuous interactive feedback, clinical studies often deploy wearable sensors that passively collect data for long periods of time, and the data is generally downloaded and processed after the devices are collected from the participants.
Within this context, in this paper we present a new design for a wearable environmental monitor (the “Eco-Mini”) with significant improvements in usability, form factor, battery life, and data quality that enables use in clinical studies. Data from a feasibility test with two pediatric asthma patients are also presented.
II. Design and Implementation
A. Device Hardware
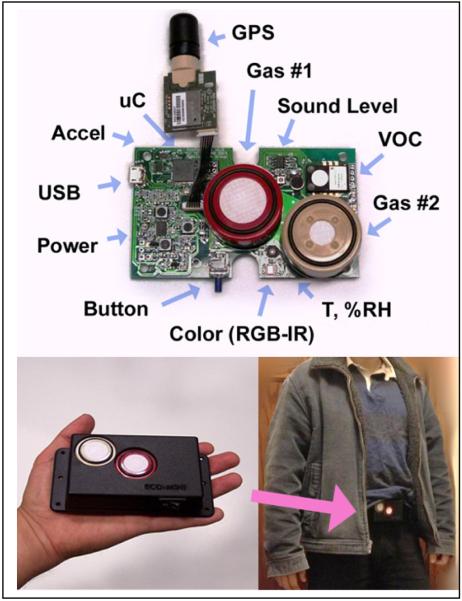
The electronic hardware for the Eco-Mini is shown in Figure 1, and consists of a high-performance, low-power microcontroller (Atmel Xmega 128K) with integrated 12-bit analog-to-digital converter (ADC) and SPI/I2C ports for communication with onboard sensor components. The monitor contains the following sensors and features:
Fig. 1.
(top) Photo of “Eco-Mini” wearable monitor and associated sensors. Not shown are micro-SD memory card and Bluetooth module on reverse side. (bottom) Photo of packaged device worn on waist strap for data collection.
Gas Sensors
For air quality monitoring, electrochemical sensors were chosen on the basis of low-power consumption, good linearity and good reproducibility. In addition, we made use of a new 4-electrode amperometric electrochemical cell design that was recently developed to improve stability, enable drift-correction, or reduce interference[15]. Separate low-power transimpedance amplifier circuits were used to measure the 2 outputs of each 4-electrode cell.
Volatile Organic Compounds (VOCs)
For VOC detection, a MEMS metal-oxide sensor with linearized I2C output was used (Applied Sensor iAQ Engine). While this miniature MEMs device requires less power (40mA at 5V) than conventional metal-oxide sensors, its operation unfortunately requires that the internal heater element remain on for 250ms for every sample reading. As a result, this sensor was removed from subsequent versions of the Eco-Mini.
Lighting spectrum measurement
For measurement of ambient lighting color, a digital color exposure chip was used (Hammamatsu S11059-02DT) which provides a 16-bit SPI digital output for each 4 wavelength band (red=615nm, green=530nm, blue=460nm, and infrared=855nm).
Sound level
Sound intensity was measured using a miniature electret microphone with a custom-designed low-power amplifier and detector circuit operating at 5V to optimize dynamic range. The sound level was calibrated using a handheld meter for dB units.
Temperature and Humidity
Digital self-calibrated temperature and humidity readings were provided over I2C by an integrated circuit (Silicon Labs Si7005), which is accurate to 0.5C and 5%RH.
3-axis Accelerometer
In order to detect when the Eco-Mini is being worn, and to provide actigraphy data, an ultra-low power accelerometer (Analog Devices ADXL362A) was included. In addition, since a person’s respiration rate increases with exercise, accelerometer data could also be used to better estimate individual air pollution exposure [16].
Global Positioning System
An integrated GPS unit with superior sensitivity (−160 dBm) and integrated helical antenna (SPK Electronics, GS407) was used to provide location data. Since this device did not support a sleep function, an external MOSFET circuit was added to completely power down the GPS circuit via firmware control for low-power operation.
Power Management
For improved usability, a rechargeable 3.7V 950 mAhr LiPol battery was used in conjunction with a USB power controller (Linear LTC3586). Since different sections of the hardware required different operating voltages (2.7V, 3.3V, 5V), multiple power rails were implemented.
Wireless Communication
A dual-mode low-power Bluetooth module (BlueRadios BR-LE4.0D2A) was used for providing wireless data to an external mobile phone using standard Bluetooth 2.0 mode or using Bluetooth 4.0. For ultralow-power Bluetooth LE operation, the BR-LE4.0-S2A could be substituted in the same PCB footprint.
Data storage
A micro-SD card with 2GB or memory is included to support data logging without the need of a smart phone. This memory size is sufficient for 6 months of data collection, assuming a sampling interval of 10 seconds.
B. Firmware and Operation
Firmware was developed for the Eco-Mini to provide a high degree of configurability and customization. Several key features are discussed below:
USB Communications
A virtual USB COM port was implemented in firmware to enable connection to a computer for viewing live data, changing the settings, or downloading collected data without the need for a mobile smart phone.
Embedded Gas Sensor Calibration
In order to enable data comparison across different devices, the gas sensor calculations for the 4-electrode cells were embedded into the Eco-Mini firmware. This is a critical feature, given that the gas sensitivity and zero bias current vary from sensor to sensor. All calibration coefficients (as well as all the other configuration settings) are saved in separate registers in non-volatile EEPROM on the device.
Selective power switching
In order to save power, the GPS, data logging, and Bluetooth radio could be activated and de-activated via software control (e.g. via a smart phone) as needed. A button is provided on the Eco-Mini device itself to turn ON/OFF the Bluetooth radio.
Adaptive Sampling
The sampling interval can be varied over the range 1 second to 1 hour via the Bluetooth or USB interface. The GPS unit and gas sensors were assigned different sampling intervals from the rest of the sensors, since these parameters may change relatively slowly.
Real-time Clock
A crystal-stabilized real-time clock was implemented in firmware to provide the time base used for all sampling and data logging functions. The real-time clock is automatically set via the GPS signal or can be set manually via the smart phone or PC.
Low-Power Mode
When the onboard battery drops below 3.2V, the sensor sampling is reduced to a predetermined rate and a low-battery warning is displayed via onboard LEDs. This feature is very important when the monitor is used as a stand-alone device without an external smart phone.
C. Mobile Application
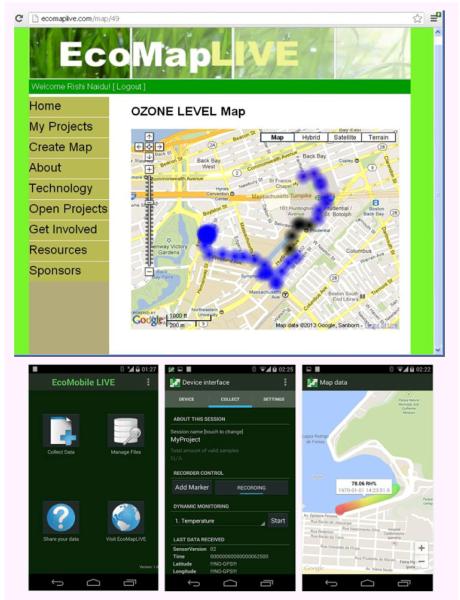
A mobile application (“EcoMobileLive”) was developed for Android using the JAVA SDK. The application provides live data views (Figure 2) on the mobile phone via the Bluetooth wireless link. The Bluetooth data streaming was implemented as a background service in order to enable co-existence with other concurrent mobile applications on the same phone. The mobile application also supports viewing previously recorded data files and Google Map display of data. The free app is available on the Google Play store.
Fig. 2.
(top) screen shots of web server application and (bottom) Android mobile app designed for use with the Eco-Mini.
D. Web Server
For post processing of collected data, a web server and simple JAVA script application was created to display previously-recorded data files. The web site was installed at: htttp://www.ecomaplive.com. Sample data is shown in Figure 2.
III. Testing and Validation
A. Gas Sensor Calibration and Practical Limits
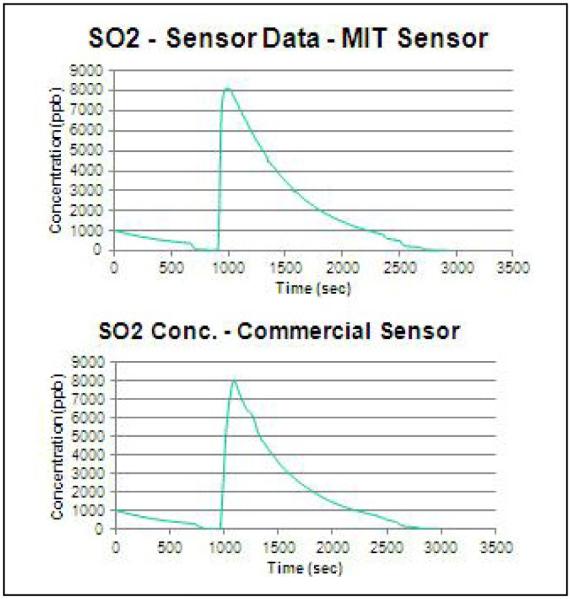
The sensitivity and zero current value of each gas sensor was provided by the manufacturer and included in the internal calibration. The Eco-Mini was tested in an atmospheric chemistry lab against commercial instruments. Ozone and Sulfur Dioxide sensors were selected specifically, since they are commonly found in industrial cities and are known irritants for pulmonary disease. As shown in Figure 3, the results were favorable. While the gas sensors used can detect changes in gas concentration as small as a few ppb, the practical accuracy of gas species detection is in the range 50-100 ppb, limited mainly by the electrical noise limit of several millivolts and the resolution of the 12-bit ADC.
Fig. 3.

Laboratory test data of SO2 gas sensor compared to Teladyne Model 100E UV fluorescent analyzer. Similar test was also conducted for O3 sensor, compared to Model 202 Ozone meter from 2B Technologies (not shown).
B. Power Measurements
The power consumption of the Eco-Mini was tested under various configurations. With GPS and Bluetooth OFF, the current consumption (at 3.7V) was approximately 3 milliamps while idle and with brief (20ms) burst of 15 mA when sampling. Bluetooth (standard) and GPS were found to increase the current consumption by 30mA and 45mA, respectively. At a 10-second sampling rate, the measured battery life of the device ranged from 6 hours (all sensors active, GPS/Bluetooth ON) to 12 days (GPS/Bluetooth off, data logging only).
C. ClinicalFeasibility Study
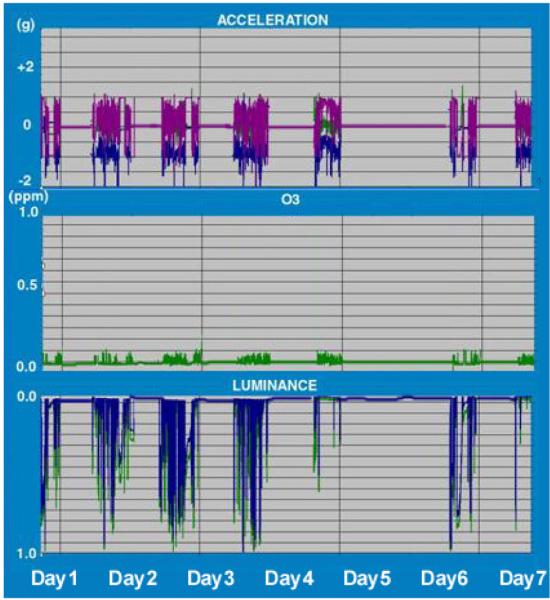
To evaluate feasibility of the Eco-Mini monitor for a clinical study, we conducted a small IRB-approved one-week test with two actual pediatric asthma patients, ages 10 and 13, in the Boston area, who were already part of another clinical study using GPS location. Since the subjects were already accustomed to wearing a commercial GPS device (QStars), the Eco-Mini monitor was added to the same belt worn around their waist. The Eco-Mini had sufficient battery life to enable the subjects to leave the wearable monitors running continuously for the entire week. Sample data from this feasibility test is shown in Figure 4.
Fig. 4.
Week-long sample data from asthma Subject #2, showing (top) x-y-z acceleration, (middle) Ozone level, and (bottom) visible and IR light intensity.
IV. Conclusion
We have presented a design of a wearable environmental monitor for clinical use that can simultaneously measure multiple environmental parameters, with emphasis on toxic gas monitoring for air pollution. The Eco-Mini can be used as a stand-alone device with internal data logging and GPS, or can be used in conjunction with a smart phone to provide real-time data monitoring and feedback (e.g. real-time cycling map). We expect that the size and comfort of the device will continue to improve as new miniature gas sensors become available. Looking to the future, it is possible that similar monitors will find increasing clinical use in the diagnosis and treatment of many human pathologies which are influenced or triggered by environmental stimuli. Affordable monitors may also find everyday use by patients, as part of behavioral interventions or therapies for a wide variety of cardiovascular and pulmonary disease, as well as mental health disorders and neurological disorders including autism and sensory processing disorder (SPD).
V. Acknowledgements
We would like to acknowledge Richard Redemske, Victor Horta Ferreira, Jose Leite, and Gilbert O’Neil for supporting the development of the firmware, web site, and mobile app.
References
- [1].World Health Organization (WHO) 7 Million Premature Deaths Annually Linked to Air Pollution. 2014 Mar; [Online]. Available: http://www.who.int/mediacentre/news/releases/2014/air-pollution/en/
- [2].Passchier-Vermeer W, Passchier WF. Noise exposure and public health. Enviro. Health Perspectives. 2000;108(Suppl 1):123. doi: 10.1289/ehp.00108s1123. [DOI] [PMC free article] [PubMed] [Google Scholar]
- [3].Gooley J, et al. Spectral responses of the human circadian system depend on the irradiance and duration of exposure to light. Science Translational Medicine. 2010;2(31):31ra33–31ra33. doi: 10.1126/scitranslmed.3000741. [DOI] [PMC free article] [PubMed] [Google Scholar]
- [4].Lockley SW, Brainard GC, Czeisler CA. High sensitivity of the human circadian melatonin rhythm to resetting by short wavelength light. J Clin Endocrinol Metab. 2003;88(9):4502–4505. doi: 10.1210/jc.2003-030570. [DOI] [PubMed] [Google Scholar]
- [5].Anderson JL, et al. Sleep in fall/winter seasonal affective disorder: effects of light and changing seasons. Journal of psychosomatic research. 1994;38(4):323–337. doi: 10.1016/0022-3999(94)90037-x. [DOI] [PubMed] [Google Scholar]
- [6].Solon O. Air Quality Egg Crowdsources Hyper-local Air Pollution Data. 2012 Mar 29; Wired Magazine. [Online]. Available: http://www.wired.co.uk/news/archive/2012-03/29/pachube-air-egg.
- [7]. Available: http://www.everyaware.eu/the-everyaware-project/
- [8]. Available: http://www.AirCasting.org.
- [9]. Available: http://blog.safecast.org/
- [10].Choi KJ, et al. One-dimensional oxide nanostructures as gas-sensing materials: review and issues. Sensors. 2010;10(4) doi: 10.3390/s100404083. [DOI] [PMC free article] [PubMed] [Google Scholar]
- [11].EveryAware Project Report on Sensor Selection, Calibration, and Testing. 2012 Aug; [Online]. Available: http://www.everyaware.eu/resources/deliverables/D1_1.pdf.
- [12].Nikzad N, et al. CitiSense: Improving Geospatial Environmental Assessment of Air Quality Using a Wireless Personal Exposure Monitoring System. Proceedings of Wireless Health Conference.2012. [Google Scholar]
- [13].Stetter JR, Li J. Amperometric Gas Sensors A Review. Chemical reviews. 2008;108(2):352–366. doi: 10.1021/cr0681039. [DOI] [PubMed] [Google Scholar]
- [14].Ancoli-Israel S, et al. The role of actigraphy in the study of sleep and circadian rhythms.” American Academy of Sleep Medicine Review Paper. Sleep. 2003;26(3):342–392. doi: 10.1093/sleep/26.3.342. [DOI] [PubMed] [Google Scholar]
- [15].Saffell JR, Hitchman ML, Dawson DH. Electrochemical Sensor for Determining Analyte in the Presence of Interferent and Method of Using the Sensor. 2003 Sep 23; U.S. Patent No. 6,623,619 B2. [Google Scholar]
- [18].Rodes CE, et al. Predicting adult pulmonary ventilation volume and wearing complianceby on-board accelerometry during personal level exposure assessments. Atmospheric Environment. 2012;57:126–137. doi: 10.1016/j.atmosenv.2012.03.057. [DOI] [PMC free article] [PubMed] [Google Scholar]


