

Abstract
Aims
It is well known that connexin43 (Cx43) forms gap junctions. We recently showed that Cx43 is also part of a protein-interacting network that regulates excitability. Cardiac-specific truncation of Cx43 C-terminus (mutant ‘Cx43D378stop’) led to lethal arrhythmias. Cx43D378stop localized to the intercalated disc (ID); cell–cell coupling was normal, but there was significant sodium current (INa) loss. We proposed that the microtubule plus-end is at the crux of the Cx43–INa relation. Yet, specific localization of relevant molecular players was prevented due to the resolution limit of fluorescence microscopy. Here, we use nanoscale imaging to establish: (i) the morphology of clusters formed by the microtubule plus-end tracking protein ‘end-binding 1’ (EB1), (ii) their position, and that of sodium channel alpha-subunit NaV1.5, relative to N-cadherin-rich sites, and (iii) the role of Cx43 C-terminus on the above-mentioned parameters and on the location-specific function of INa.
Methods and results
Super-resolution fluorescence localization microscopy in murine adult cardiomyocytes revealed EB1 and NaV1.5 as distinct clusters preferentially localized to N-cadherin-rich sites. Extent of co-localization decreased in Cx43D378stop cells. Macropatch and scanning patch clamp showed reduced INa exclusively at cell end, without changes in unitary conductance. Experiments in Cx43-modified HL1 cells confirmed the relation between Cx43, INa, and microtubules.
Conclusions
NaV1.5 and EB1 localization at the cell end is Cx43-dependent. Cx43 is part of a molecular complex that determines capture of the microtubule plus-end at the ID, facilitating cargo delivery. These observations link excitability and electrical coupling through a common molecular mechanism.
Keywords: Cx43, NaV1.5, EB1, Microtubule, Area composita, Connexome
1. Introduction
There is ample of evidence that connexin43 (Cx43) is essential to normal cardiac rhythm. A drastic decrease in Cx43 abundance leads to polymorphic ventricular tachycardia and death in mice.1,2 Loss or redistribution of Cx43 (‘gap junction remodelling’) is considered a substrate for severe arrhythmias (see, e.g., ref. 3,4). For the most part, interpretation of connexin-related arrhythmias has focused on Cx43 as the pore-forming subunit of gap junctions. Yet, recent studies demonstrate that loss of Cx43 expression leads to reduced sodium current (INa) amplitude in ventricular5,6 and atrial myocytes,7 thus indicating a gap junction-independent role for Cx43 in cardiac electrophysiology.5
A limiting factor to establish the relevance of Cx43-dependent, gap junction-independent functions was the lack of an experimental model where coupling was preserved and yet, other Cx43-dependent effects were demonstrable. Recently, Lübkemeier et al.8 reported results from a cardiac-restricted knock-in mouse line where, upon tamoxifen administration, Cx43 was replaced by a truncated form lacking the last five amino acids (mutation Cx43D378stop). Loss of these residues did not prevent proper Cx43 expression, localization, co-localization, or co-precipitation with partner molecules including the scaffolding protein ZO-1.9,10 Moreover, gap junctions were still formed, allowing normal electrical coupling via channels of same unitary conductance, voltage-dependence, and permselectivity as wild type. Yet, mice died in ventricular fibrillation within 21 days after tamoxifen. Electrophysiological studies showed a significant loss of INa and loss of fast transient outward current. We concluded that loss of gap junction-independent functions of Cx43 is sufficient for generation of life-threatening arrhythmias.
The observations above indicated that two fundamental components of action potential propagation, namely cell excitability and cell–cell coupling, share a common molecular network. Yet, the nature of their common link remained undefined. We explored the possibility that the microtubules are at the crux of the relation between Cx43 and INa. The hypothesis is supported by studies showing that loss of Cx43 disrupts microtubular stability and dynamics in 3T3 fibroblasts,11 and by experiments demonstrating that NaV1.5, the major sodium channel protein in the heart, is delivered to the cell membrane via microtubules.12 We therefore postulated that the Cx43D378stop mutation impairs the capture of the microtubule plus-end at the cell end, thus reducing the probability of NaV1.5 delivery. In this study, we used the microtubule plus-end tracking (+TIP) protein ‘end-binding 1’ (EB1) as a marker of the microtubule plus-end.
The hypothesis above implies that Cx43 truncation causes a minor and yet crucial displacement of microtubule- and sodium channel-related molecular complexes at the cell end. Assessment of our hypothesis required visualization of molecules and their function in the nanometre range. Thus, we implemented novel optical and conductance imaging approaches previously validated in our laboratory. Super-resolution fluorescence microscopy (SRFM)13 experiments yielded the first structural characterization of clusters formed by EB1 at the cell end of ventricular myocytes as well as their position, and that of NaV1.5 clusters, in relation to N-cadherin-rich sites. Studies in Cx43D378stop ventricular myocytes revealed a reduced proportion of EB1 and of Nav1.5 clusters at the N-cadherin-rich site. Separate scanning patch-clamp (SPC)14 and macropatch recordings unveiled a reduction in INa specifically at the cell end, without changes in unitary conductance. Experiments in stable Cx43-modified HL1 cells confirmed the relation between Cx43 and INa and showed it to be independent of the presence of permeable gap junctions, but dependent on Cx43 membrane localization. We propose that Cx43 is part of a molecular complex that captures the microtubule plus-end, thus allowing proper arrival of NaV1.5 to the cell end.15 These studies are relevant to our understanding of Cx43 function in electrophysiology, its participation in the arrhythmic substrate, and its potential as a target for antiarrhythmic therapy.
2. Methods
Adult mouse ventricular myocytes from control and Cx43D378stop mice littermates of both genders were obtained by enzymatic dissociation.8 Mice were euthanized by anaesthetic overdose (isoflurane >20%) and confirmed death by cervical dislocation. All procedures conformed to the Guide for Care and Use of Laboratory Animals published by the US National Institutes of Health (NIH Publication no. 58-23, revised 1996). Cx43D378stop refers to Cx43D378stop flox/flox-positive, αMyHC-Cre-ER(T2)-positive mice, injected 4 consecutive days with tamoxifen (3 mg dissolved in sterile peanut oil with 10% ethanol; mice weight hovered ∼28–30 g, giving an approximate tamoxifen dose of 0.1 mg of tamoxifen per gram of body weight). Animals were euthanized 14 days after the first day of injection (see also Lübkemeier et al.8). ‘Control’ (or Cre−) refers to Cx43D378stop flox/flox-positive, Cre-negative littermates. SRFM was conducted in a custom-built system, based on simultaneous two-colour direct stochastic optical reconstruction microscopy (dSTORM).13 Detailed experimental methods provided in Supplementary material online and in previous publications.13,14,16 Cluster analysis was automated for standardization (see details in Supplementary material online) following criteria detailed below.
2.1. Analysis of cluster distribution
2.1.1. N-Cadherin as a reference point
The following protein clusters were localized: N-cadherin, EB1, NaV1.5, Ankyrin-G (AnkG), and Cx43. Images were first obtained by conventional total internal reflection fluorescence (TIRF) and then acquired and processed using dual-colour SRFM.13 Examples are presented in Figure 1A and B. The images show N-cadherin (purple) and EB1 (green)-immunoreactive signals obtained by conventional TIRF (Figure 1A) and after processing to an ∼20 nm resolution (Figure 1B). The N-cadherin signal was highly specific to the cell end (see also Supplementary material online, Figure S1) and was therefore used as a reference point to locate ‘test clusters.’ The physical characteristics of the N-cadherin clusters are presented in Supplementary material online, Table S1.
Figure 1.
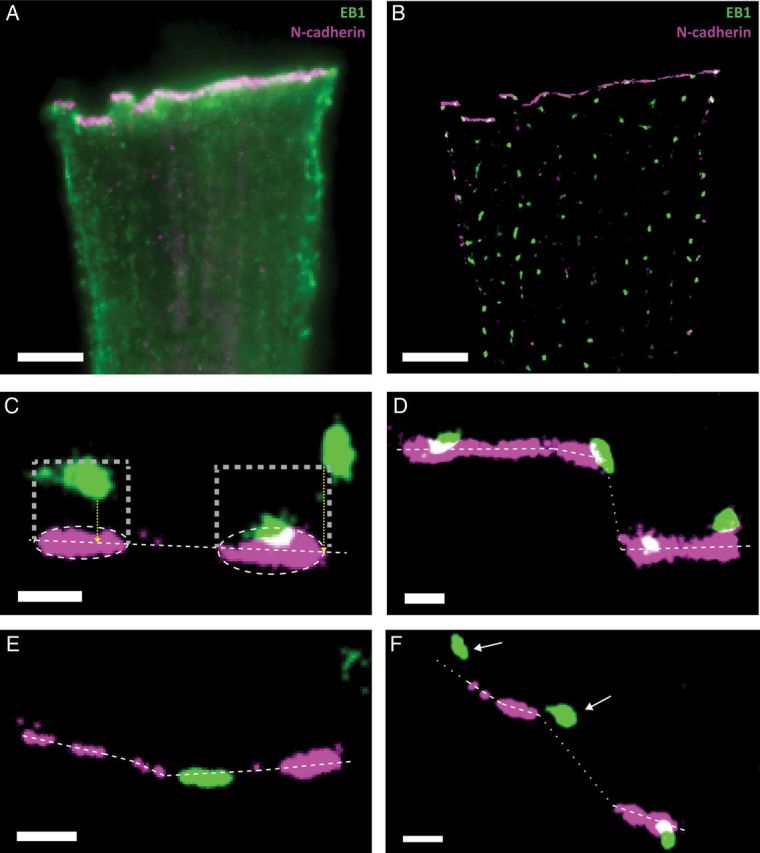
SRFM images of EB1 (green) and N-cadherin (purple) in adult murine ventricular myocytes. (A) TIRF image; projection of 2000 frames collected to generate the SRFM. (B) Image obtained by SRFM. (C–F) White dotted lines are drawn along the major axis of the ellipsoid containing the N-cadherin plaque. Rectangular areas in (C) outline the borders of the ROI; yellow dotted lines indicate the measure of distance to the cell end for two distal clusters. Clusters overlapping with the z plane of N-cadherin (D) or located along the horizontal axis between two N-cadherin clusters (E) were referred to as EB1-ID. Clusters localized in a region where the cell end could not be defined (yellow dotted line in F) were not included for analysis. Scale bars: 500 nm.
2.1.2. Defining the area of interest in the cell landscape
Test proteins reported here can be found not only at the cell end, but also periodically distributed along the cell length. Thus, we confined our area of interest to the region within 600 nm from the cell edge. The rationale for this decision was semi-arbitrary; first, this distance is about a third of the average distance between the cell edge and the first T-tubule (marking the first topological structure identifiable as a ‘non-intercalated disc’; see Supplementary material online, Figure S2) and therefore, far enough from molecular clusters associated with the costamere or T-tubule structures. Secondly, 600 nm is a distance that approximates the combined resolution of objects of two different colours in diffraction-limited microscopy. As such, it matches the window within which previous studies that relied on confocal microscopy have identified proteins as localizing to the cell end.
2.1.3. Defining individual clusters and/or their overlap
The minimum area of contiguous pixels defined as a cluster was 2400 nm2. This represents an area of six times our resolution and therefore was considered safely within the power of detection. Signal-positive areas of smaller dimensions were not included. Two clusters were considered separate if one was at least 20 nm apart from another in any direction. The latter applied both to clusters of the same species and to the separation between N-cadherin and the test cluster of interest.
2.1.4. Defining the position of test clusters relative to N-cadherin
Test clusters were divided into three different groups based on their position relative to N-cadherin: distal, ‘ID’, or ‘X’.
2.1.4.1. Distal clusters
This term defined clusters not overlapping with N-cadherin but localizing within a predefined region of interest (ROI). The N-cadherin cluster and its projection 600 nm into the cell limited the ROI, as follows. Each N-cadherin cluster was first fit to an ellipsoid, with the major axis running along the cell end (see, e.g., Figure 1C). From the two poles of this ellipsoid, and in direction perpendicular to its major axis, two perpendicular lines of 600 nm length were projected towards the cell centre, limiting a rectangular ROI where two sides were 600 nm and the other two sides, a length equal to that of the N-cadherin cluster (see white dotted lines in Figure 1C). Test clusters that entered the ROI (even if by one pixel; see the extreme example in the cluster shown in the upper right quadrant of Figure 1C) but that did not overlap with N-cadherin clusters were referred to as ‘distal’. For these cases, the ‘distance to cell end’ was defined by the length of a line perpendicular to the major axis of the N-cadherin cluster and reaching the closest pixel of the test cluster within the ROI.
2.1.4.2. ID clusters
If the test cluster signal overlapped with N-cadherin in one pixel or more, then we assumed that at least one part of that cluster had reached the cell end. We called these clusters ‘ID’ because they were in the area previously occupied by the intercalated disc (Figure 1D). Clusters were also identified as ‘ID’ if the leading edge of the cluster intersected the line joining the two major axes of neighbouring N-cadherin clusters, as long as the separation between the clusters was <1000 nm (Figure 1E). Indeed, correlative SRFM-bright field images showed that ellipsoid N-cadherin clusters that shared the same major axis in the XY plane and were <1000 nm apart from each other were contiguous along the same plane of the membrane.
2.1.4.3. X clusters
Once the ‘distal’ and ‘ID’ clusters were assigned, there was a small population of clusters that did not fit any of the parameters established above (see Figure 1F; clusters indicated by arrows). Their assignation into one group or another would have been arbitrary and therefore, we decided not to include them in our analysis. We refer to them as ‘X’ in the text, and their specific proportion per group is detailed.
Cluster measurements were constrained as defined above and automated using a script for image analysis, as described in Supplementary material online.
3. Results
3.1. Morphology and topology of EB1 clusters in adult cardiomyocytes
Previous studies17–19 indicate that capture of microtubules at the site of cell–cell contact involves association of cadherin-rich sites with the microtubule plus-end. Yet, there is a lack of information regarding the precise location and organization of the microtubule plus-end at the cardiac ID. We used EB1 as a prototype plus-end-binding protein, and implemented SRFM13 to localize EB1 in the cell-end landscape at a resolution of ∼20 nm. The super-resolved images provided previously unveiled quantifiable information on the structural features of EB1 molecular clusters. As shown by the bar graphs in Figure 2A–C (data labelled Cre−), EB1-ID clusters (black bars) occupied an average area of 66 654 ± 3574 nm2 (Figure 2A) and had an average circularity index of 0.697 ± 0.013 (Figure 2B). The average long axis of the ellipsoid containing the contour of the cluster was 356 ± 13 nm (Figure 2C). EB1-distal clusters (red bars) were of smaller size (38 612 ± 4344 nm2; P < 0.001), more circular (0.761 ± 0.017; P < 0.05), and had a shorter long axis (245 ± 14 nm; P < 0.001); the total number of clusters studied (n) was 432. Of that total, 14.6% classified as ‘X’ and were not used for the quantitative analysis of localization. Of those clusters included for analysis, 67.8% were assigned as EB1-ID and 32.2% were EB1-distal. Thus, for every one EB1-distal cluster, we detected 2.1 clusters at the ID (Figure 2D). The average distance between EB1-distal clusters and the N-cadherin plaques in control (Cre−) cells was 209 ± 11 nm.
Figure 2.

EB1 cluster analysis. Acquisition methods detailed in Agullo-Pascual et al.13 For all panels, EB1-ID: black bars; EB1-distal: red bars. ‘Cx43D378stop’ refers to data obtained from myocytes collected from Cx43D378stop flox/flox-positive, αMyHC-Cre-ER(T2)-positive mice, injected with tamoxifen and euthanized 14 days after first injection. ‘Cre−’ refers to Cx43D378stop flox/flox-positive, cre-negative littermates.8 (A) Average area occupied by individual clusters. (B) Average cluster circularity; 1.0 indicates perfect circle. (C) Average long axis of the ellipsoid fitting the cluster. (D) Proportion of EB1 clusters detected at ID for every distal cluster. For all panels, *P < 0.05; **P < 0.001. Comparisons by unpaired Student's t-test except for data in (D) (χ2 test, P < 0.05). N = 369 and 282 clusters for 32 Cre− cardiomyocytes and 29 Cx43D378stop cardiomyocytes, respectively.
The presence of defined, well-organized EB1 clusters (rather than the diffuse presence of the protein along the region) suggested that, in cardiomyocytes, individual microtubules organize into bundles, as it occurs in other cells such as neurons20 and skeletal myocytes.21 To assess whether the dimensions of EB1 clusters conform with the known dimensions of microtubule bundles, we used molecular modelling methods (see Supplementary material online, Figure S3 and Video S1 for details) and placed the structure of microtubules22 into the nanoscale-resolved EB1 space domain. Protein data bank co-ordinates of the alpha-beta tubulin dimer (Figure 3A) were used to model the 13 protofilaments that line a single microtubule of 26 nm of outer diameter and 18 nm of inner diameter (Figure 3B and Supplementary material online, Figure S3). Individual microtubules were spaced in a hexagonal packing conformation, forming a lattice where the centre of each microtubule was at 46 nm from its neighbours (Figure 3C; same parameters as in Peter and Mofrad23). The resulting lattice was fit into the EB1 clusters resolved at sub-diffraction limit (see example in Figure 3D; green and purple are SRFM images of EB1 and N-cadherin, respectively). The number of microtubules within this simulated bundle21 was consistent with estimates in axons and in skeletal muscle (10–100).24 Based on average long axes (Figure 2C; see also Supplementary material online), we estimated that the average number of plus-end microtubules per bundle was 49 and 23 for EB1-ID and EB1-distal clusters, respectively.
Figure 3.
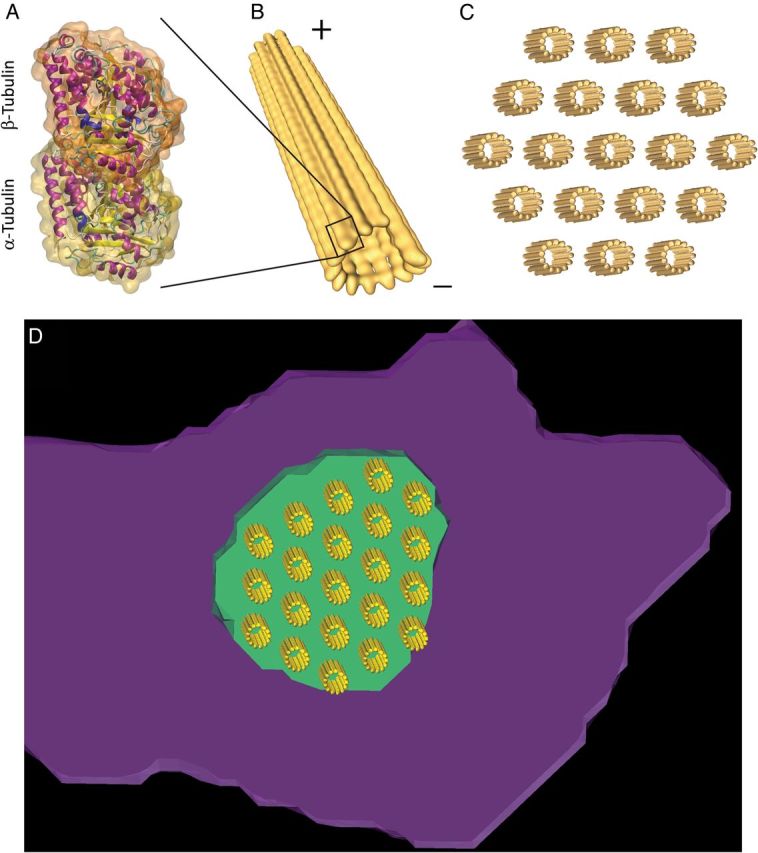
(A) Atomic structure of αβ tubulin heterodimer (1jff.pdb). (B) Microtubule composed of 13 protofilaments with minus- and plus-ends indicated. Protofilaments were built from αβ tubulin heterodimers associated head to tail, conferring their characteristic polarity. (C) Model of a bundle of 19 microtubules with hexagonal packing. The microtubule edge-to-edge and centre-to-centre spacing was 20 and 46 nm, respectively. (D) Partial view of one cluster of EB1 proteins (green) overlapping with a cluster of N-cadherin (purple). A model of microtubule bundle with hexagonal packing was superimposed on the SRFM signal.
3.2. Morphology and topology of EB1 clusters in Cx43D378stop myocytes
The system of parameters derived from our SRFM observations allowed us to compare the data in control cells with those obtained from mice expressing the Cx43D378stop protein. The dimensions of EB1 clusters were not affected by the Cx43 truncation, and the significant difference in cluster size ID vs. distal was also preserved (see Figure 2A–C; compare data labelled Cre− with data labelled Cx43D378stop). However, the proportion of clusters localized at the cell end was significantly reduced. A total of 364 clusters were measured, and 23% of them did not fulfil the conditions for classification as either EB1-ID or EB1-distal. Of the remaining clusters, 40.8% were distal and 59.2% were categorized as EB1-ID. Expressed differently, for every EB1-distal cluster, we found 2.1 clusters in the ID region of control cells, but only 1.45 clusters in the ID region of Cx43D378stop cells (Figure 2D). This difference was statistically significant (P < 0.05 by the χ2 test). The average distance between EB1-distal clusters and the N-cadherin plaques in Cx43D378stop cells was 224 ± 12 nm and as such, not statistically different from the control. In summary, truncation Cx43D378stop led to a reduction in the proportion of EB-1 clusters localized to the ID region. The average number of clusters per cell and the total EB-1 abundance in heart tissue assessed by immunoblot was not changed by the Cx43D378stop mutation (see Supplementary material online, Figure S4).
3.3. Analysis of NaV1.5 cluster distribution at the cell end in Cx43D378stop myocytes
Previous studies have shown that NaV1.5 is delivered into the membrane via the microtubule network.12 We therefore speculated that the reduced number of EB1-ID clusters in Cx43D378stop cells would impact the subcellular distribution of NaV1.5. NaV1.5 organized into separate clusters, regularly spaced along the surface. Figure 4A shows the immunoreactive signals of NaV1.5 (green) and N-cadherin (purple) detected by conventional TIRF (left) and by SRFM (right). Figure 4B shows representative SRFM images of distal and overlapping NaV1.5 clusters with N-cadherin in Cre− cells compared with Cx43D378stop cells. As in the case of EB-1, we noted a large difference in cluster size depending on whether it localized in the ID region, or distal to it (Figure 4C). The difference persisted in Cx43D378stop cells. The clusters showed an ellipsoid shape, also preserved in cells expressing Cx43D378stop cells (Figure 4D). A total of 428 clusters were analysed in control cells, and 505 in Cx43D378stop. 14.7% of the total control population, and 12.5% of the mutant, could not be defined as either ‘ID’ or ‘distal’. Of the total population of assigned clusters in the control group, the largest fraction was found either in the z-plane of an N-cadherin plaque, or in the same horizontal plane along two clusters (74.8% were Nav1.5-ID and 25.2% were Nav1.5-distal). The proportion of Nav1.5-ID clusters decreased significantly in Cx43D378stop cells. Indeed, in control cells, for every cluster of Nav1.5-distal detected, we found 2.97 clusters at the ID region (Figure 4E), and this number decreased to 1.95 in the Cx43D378stop cells (P < 0.01 by the χ2test). The average distance between Nav1.5-distal clusters and the N-cadherin plaque was not affected by the Cx43 truncation (313 ± 15 nm in control and 335 ± 13 nm in Cx43D378stop cells, respectively). The average number of clusters per cell was not different between genotype (see Supplementary material online, Table S2). Interestingly, the separation of NaV1.5 from N-cadherin was not associated with changes in the abundance or localization of the NaV1.5 scaffolding protein, AnkG (see Supplementary material online, Figure S5). Also of relevance, the area and subcellular distribution of Cx43 clusters were not different between cells of the two genotypes, further supporting evidence that truncation Cx43D378stop did not affect the ability of Cx43 to form gap junction plaques (see Supplementary material online, Figure S5). Western blot analysis showed no difference in abundance of total NaV1.5 protein in control vs. Cx43D378stop hearts (see Lübkemeier et al.8). These results led us to speculate that Cx43D378stop cells would have a decreased number of functional sodium channels specifically in the ID region of the cell.
Figure 4.

Localization of NaV1.5 and N-cadherin in adult ventricular myocytes. (A) Image by TIRF (projection of 2000 frames collected for SRFM) or SRFM, left and right, respectively. White-boxed areas enlarged in bottom panels, showing increased resolution by SRFM. Purple: N-cadherin; green: NaV1.5. (B) Enlargement showing proximity between NaV1.5 and N-cadherin clusters in Cre− (left) and Cx43D378stop (right) cells. (C) Average area occupied by NaV1.5 clusters at the cell end (NaV1.5-ID; black bars) or distal (NaV1.5-distal; red columns) in Cre− and Cx43D378stop cells. (D) Average cluster circularity. (E) ID clusters normalized relative to the number of clusters in the distal region. n = 365 clusters in 23 cells imaged (ID: 273; distal: 92) and 441 clusters in 22 cells imaged (ID: 291; distal: 150) for Cre− and Cx43D378stop. (If ID/distal ratios were calculated per cell, and then averaged: Cre−:4.6 ± 0.8, n = 23; D378stop: 2.4 ± 0.3, n = 20; two cells not counted since distal clusters = 0.) Scale bars: 5 and 1 µm in (A) (upper and lower panels, respectively) and 200 nm in (B).
3.4. Reduced INa in the ID region of Cx43D378stop myocytes
Sodium channels distribute in distinct pools over the cell, resulting in region-specific variations in INa coincident with selective location of partner proteins.25,26 Based on the results obtained by SRFM, we assessed location-specific INa properties from Cx43D378stop myocytes compared with control. Patch-clamp recordings were obtained either from the region previously occupied by the ID or from the cell midsection (M; Figure 5A–C; red and blue circles in Figure 5A, respectively; see also Lin et al.25). As shown in Figure 5B, the average peak INa amplitude recorded from the ID region was significantly reduced in Cx43D378stop myocytes (red) when compared with control. In contrast, there was no difference in average peak INa amplitude recorded from the M region (Figure 5C). Replacing Cx43 with Cx43D378stop had no effect on voltage-dependent steady-state inactivation or fast recovery from inactivation of INa (see Supplementary material online, Figure S6 and Table S3). SPC14 revealed that the unitary conductance of individual channels was also unchanged (Figure 5D and E). Overall, Cx43D378stop caused selective reduction in INa at the ID without changes in voltage-dependent gating, kinetics, or unitary conductance properties. These results are consistent with the notion of a reduced abundance of NaV1.5 subunits functionally inserted in the membrane of the ID region of the cell.
Figure 5.

(A) Red and blue circles illustrate macropatch recording locations (ID or M, respectively). (B and C) I–V relations of INa in macropatches from ID (B; n = 8 and 9 for Cre- and Cx43D378stop, respectively) or M regions (C; n = 5 for both groups). Black and red circles correspond to data from myocytes isolated from Cre− and Cx43D378stop, respectively. (D) SICM recording of adult ventricular cell end; pipette diagram illustrates the site of recording for SPC. (E) Unitary sodium channel conductance measurements from either Cre−, or Cx43D378stop cells. Number of events at Vm = −50, −60, −70, and −80 mV are, for Cre−: 192, 209, 207, and 184; for Cx4D378stop: 203, 199, 193, and 150.
3.5. Cx43 regulation of INa is independent of functional gap junction channel formation
To further assess the relation between Cx43 sequence, the microtubular network, and sodium channel function, we used the mouse atrial myocyte cell line HL1. Characterization of INa, and expression of SCN5A (vs. other sodium channel genes) in HL1s, has been reported.16 Using lentiviral siRNA technology, we generated a stable Cx43-deficient (Cx43KD) line, and a corresponding control expressing a non-silencing vector (Cx43φKD). As expected,6 average peak INa density in Cx43KD cells was significantly decreased compared with control, and no changes in either voltage-dependence of inactivation or recovery from inactivation were observed (see Supplementary material online, Figure S7 and Table S4). Transient transfection of full-length Cx43 (GFP-tagged at the C-terminus for cell identification) led to an increase in average peak INa density (black symbols in Figure 6A). Transfection with a plasmid expressing only GFP was used as control (red circles in Figure 6A). Cells expressing Cx43D378stop showed significantly reduced INa compared with those expressing full-length Cx43 (Figure 6B). Reduced INa was also observed in cells expressing a mutant Cx43 lacking its microtubule-binding domain (and thus unable to reach its final destination at the membrane;27 mutant Cx43Δ234-243; Figure 6C). Yet, a Cx43 mutant that forms plaques but not functional gap junction channels (Cx43Y17S;11 Figure 6D) correlated with normal INa. All constructs were expressed to a similar extent (see Supplementary material online, Figure S8; additional data in Supplementary material online, Figure S9 and Table S5). Similar results for Cx43D378stop were obtained from a stable HL1 cell line expressing the truncated protein (see Supplementary material online, Figure S10 and Table S6). These results show that INa depends on the ability of Cx43 to reach the cell membrane, but not on its ability to form functional gap junction channels.
Figure 6.

INa I–V relations in Cx43-KD HL1 cells. Data normalized to maximum average INa at −30 mV in Cx43-GFP-expressing cells (black in all panels; n = 13). Red symbols represent data from Cx43-KD cells transfected with GFP alone (A; n = 13), Cx43D378stop (B; n = 10), a Cx43 mutant lacking the microtubule-binding domain (Cx43Δ234-243; C; n = 11), or Cx43 mutation Y17S (D; n = 11).
4. Discussion
We implemented nanoscale-imaging methods, supported by conventional experimental techniques, to characterize the relation between Cx43, NaV1.5, and the microtubule plus-end at the ID region of adult ventricular myocytes. The immunoreactive signal of the +TIP molecule EB1 was used to mark the position and dimensions of EB1-containing microtubule plus-end bundles (see also Cerrone et al.16). EB1-ID clusters were larger than those in the distal region, likely reflecting microtubule stability after capture. Deletion 378–382 of Cx43 reduced the proportion of EB1 clusters at the ID region, consistent with a model where the Cx43 mutation impaired EB1 capture at the ID. Similarly, we observed a reduced proportion of NaV1.5-ID clusters and a reduced number of functional sodium channels at the ID region. We propose that mutation Cx43D378stop impairs EB1 capture at the cell end, leading to deficient cargo delivery (including NaV1.5) and consequently, reduced numbers of functional sodium channels at the cell end. These data are consistent with previous studies showing that Cx43 is required for proper microtubule dynamics,11 and that NaV1.5 forward trafficking requires the microtubular network.12 We further show that the relation of Cx43 with INa does not require functional gap junction channels, but does require the ability of Cx43 to reach the cell membrane.
4.1. Limitations
Our analysis of protein proximity is based on sub-diffraction limit visualization methods (two-colour SRFM). Technical validation and limitations have been presented before.13 Image resolution after processing was ∼20 nm in the X–Y plane.13 Axial image volume was constrained by the depth of focus and by rejection of defocused emitters during super-resolution reconstruction, and estimated to be <160 nm.13 As all measurements were collected from 2D images (3D-STORM28 remains underdevelopment for application to cardiac myocytes), some distances may be underestimated, consequent to possible separation between clusters in the z plane. Yet, this is a random error, occurring with the same likelihood across all data points and in both studied populations (control and Cx43D378stop). The large number of measured events minimized the impact of random error in the statistical analysis between groups.
Our studies were carried out in isolated cells, fixed within 45 min after the heart was excised. For N-cadherin, minimal or no remodelling during this time would be expected (see, e.g., ref. 29). Additional experiments indicated that most Cx43 clusters still localized to the cell end (see Supplementary material online, Figure S5). Time course of remodelling of NaV1.5 and EB1 following dissociation is unknown. Anecdotally, we have observed that INa at the ID is rather constant for at least 6 h after dissociation. We therefore expect that cell dissociation introduced only a minimum error, of similar magnitude in both study populations (control and Cx43D378stop).
This paper provides the first nanometric data on the position of NaV1.5 and EB1 in adult cardiomyocytes, their relation to N-cadherin, and their dependence to Cx43 sequence. The general characterization of Cx43D378stop hearts has been presented before,8 including data showing that (i) the abundance of Cx43D378stop in heart lysates was similar to that of full-length Cx43 in hearts from wild-type mice, (ii) Cx43D378stop localized to the ID cell membrane, co-localized, and co-precipitated with ZO-1 and NaV1.5 (though co-localization with NaV1.5 was slightly reduced), (iii) gap junction channels were unaffected by the Cx43 mutation, but sodium and potassium currents were reduced, and (iv) abundance of Cx4D378stop protein in soluble and insoluble fractions was not different from wild-type protein. Here, based on those data, we utilize SRFM for the first time to localize NaV1.5 and EB1 in relation to N-cadherin with nanometric resolution, and define their dependence on Cx43 and on gap junction channels.
In previous studies, we have shown that macropatch-recorded sodium currents are larger in cell pairs.25 Here, however, we decided to limit our recordings to single myocytes, to maintain better correlation with the SRFM studies (carried out only in single cells). Also, it should be noted that while INa was clearly affected, no distinction can be made in HL1 cells between ID and other regions. The analysis of subdomains is therefore restricted to adult ventricular myocytes.
4.2. Microtubule-mediated traffic and residual INa
We show that mutation Cx43D378stop reduces, but does not completely eliminate INa. Furthermore, although we show that the proportion of NaV1.5/EB1 clusters at the cell end decreases, we still find a number of clusters that reach the cell end. As such, our data suggest the reduced probability of +TIPs capture, rather than complete interruption of the microtubule pathway. Considering the importance of microtubule trafficking to function, it seems likely that +TIP capture would not depend on a single molecule but on a complex, and that deficiency in one component would impair but not completely interrupt the entire trafficking process.
Cx43 delivery to the ID involves, at least in part, the microtubule network.18 Yet, we have not noticed a difference in the extent of electrical coupling in Cx43D378stop cells8 or in the distribution of Cx43 clusters by SRFM (see Supplementary material online, Figure S5). Loss of the Cx43 PDZ-binding domain has been associated with increased gap junction plaque size, due to increased accretion of Cx43 into the plaque area.30 The latter may compensate for the reduced delivery, resulting in a functional and structural distribution not different from control. It is also possible that microtubule-signalling platforms are captured in a cargo-dependent manner. The latter is an interesting possibility to be explored by SRFM.
4.3. Intermediaries in the Cx43–EB1–NaV1.5 interaction
We propose that Cx43 is part of the complex that captures the microtubule plus-end. Yet, we do not propose that Cx43 directly binds EB1. In fact, the interaction is more likely indirect, since the PDZ-binding domain of Cx43 is a necessary component and yet, EB1 does not contain a known PDZ domain. Our efforts to identify PDZ domain-containing molecules in the heart with a role in microtubule trafficking and that bind Cx43 have been unsuccessful. Of note, though sequence 378–382 of Cx43 is a known PDZ-binding domain, this region could have other functions. Interestingly, studies in axon initial segment31 have shown that EB1 links microtubules to AnkG. The latter scaffolds the sodium channel complex in neurones and heart cells,32,33 and interacts with Cx43 and PKP2 in cardiomyocytes.34 Yet, we did not observe an increase in the proportion of distal AnkG clusters in Cx43D378stop cells. The ID proteome is abundant. The nature of the molecular intermediaries between Cx43 and EB1 remains undefined.
4.4. Placing the Cx43–NaV1.5 interaction in the ID landscape
We show a function of Cx43 that is independent of gap junction channel formation; we therefore speculate that these functions take place outside the gap junction plaque. Two possible (not mutually exclusive) candidates are the area composita and the perinexus.
4.4.1. The area composita
Immunoelectron microscopy images of ID often show Cx43 labelling not only along gap junctions but also outside the gap junction plaque, including regions where an intercellular space is detectable (see, e.g., Figure 7A). This suggests that, as in the case for molecules previously ascribed exclusively to desmosome35 or adherens junctions,36 Cx43 may be present at the area composita,37 an ID structure of mixed morphology also containing molecules of the cadherin family.36 We speculate that the area composita captures EB1, and that deficiencies in molecules of this structure, including Cx43, can impair microtubule-mediated delivery of cargo (Figure 7B and C).
Figure 7.

(A) Immunoelectron microscopy of adult ventricular ID decorated with gold particles targeting Cx43. Notice abundant clustering along gap junctions but also at areas with clear intercellular space (arrows). (B and C) Model for the interaction of microtubules (blue) with mixed clusters of junctional proteins that include Cx43 (green), N-cadherin (light blue), and PKP2 (pink). In (B), EB1 (red) anchors at the membrane to deliver cargo (a vesicle containing NaV1.5; purple). In (C), a defect in Cx43 prevents EB1 capture, impeding cargo delivery and consequently, reducing NaV1.5 population at the membrane.
4.4.2. The perinexus
Our results, and those of Lübkemeier et al.,8 suggest a close physical proximity between Cx43 and NaV1.5, in agreement with Rhett et al.38 These authors proposed that the Cx43–NaV1.5 interaction occurs in the area surrounding the gap junction plaque (‘the perinexus’39). Whether the perinexus serves as an anchoring point for microtubules remains unclear. High-resolution Electron Microscopy (EM) images of adult ventricular tissue (such as in Delmar and Liang40) do not reveal features compatible with cytoskeletal structures (such as microtubules) in the gap junction perimeter; yet, EM images do often show mechanical junctions in close proximity to gap junctions, separated by areas of vesicular activity (e.g. Delmar and Liang40). These vesicles may carry more than one protein species; as such, interjunctional areas may be sites for interaction between proteins classically associated with only one type of structure. It is important to note that most NaV1.5 clusters identified were in the plane of N-cadherin plaques. Gap junctions are expected to run in a plane perpendicular to that of N-cadherin and as such, may occupy the ‘x’ area. Only 14.7% of NaV1.5 clusters fell in that category. Improved resolution will be necessary to determine the precise location of NaV1.5 in the ID landscape.
4.5. The connexome
Our results are consistent with the notion of an area of the ID, outside the gap junction plaque, where Cx43 interacts with other molecules for functions unrelated to electrical coupling. In our model, a molecular complex that includes Cx43 and PKP2 (see also Cerrone et al.16), as well as proteins of the cadherin family, serves as a point of capture for EB1, so that NaV1.5 can be delivered and inserted into the ID (Figure 7B). Failure of EB1 to anchor would associate with distancing of EB1 and NaV1.5 from the cell end, causing reduced INa (Figure 7C). This model is compatible with the idea of microtubules as ‘movable platforms’ that deliver molecules to destinations specified in part by the composition of the capture site (see Figure 4A and B in ref. 15). Altogether, we propose that molecules classically defined as belonging to gap junctions, desmosomes, or the sodium channel complex associate with each other in a protein-interacting network (a ‘connexome’) that regulates excitability, cell–cell adhesion, and electrical coupling in the heart.16 Interactions within the connexome may be critical for arrhythmogenesis, particularly in cases of arrhythmogenic cardiomyopathy and of Brugada syndrome.41
Supplementary material
Supplementary material is available at Cardiovascular Research online.
Conflict of interest: none declared.
Funding
This work was supported by grants from the National Institutes of Health (R01-HL106632 and R01-GM57691 to M.D.), the German Research Foundation (Wi270/32-1 and SFB 645, B2 to K.W. and I.L.), a Leducq Foundation Transatlantic Network (M.D.), the Arnold and Mabel Beckman Foundation (E.R.), and the Michel Mirowski International Fellowship in Cardiac Pacing and Electrophysiology from the Heart Rhythm Society (E.A.-P.), and the participation of the NYULMC OCS Microscopy Core.
References
- 1.Danik SB, Liu F, Zhang J, Suk HJ, Morley GE, Fishman GI, Gutstein DE. Modulation of cardiac gap junction expression and arrhythmic susceptibility. Circ Res. 2004;95:1035–1041. doi: 10.1161/01.RES.0000148664.33695.2a. [DOI] [PMC free article] [PubMed] [Google Scholar]
- 2.Gutstein DE, Morley GE, Tamaddon H, Vaidya D, Schneider MD, Chen J, Chien KR, Stuhlmann H, Fishman GI. Conduction slowing and sudden arrhythmic death in mice with cardiac-restricted inactivation of connexin43. Circ Res. 2001;88:333–339. doi: 10.1161/01.res.88.3.333. [DOI] [PMC free article] [PubMed] [Google Scholar]
- 3.Qu J, Volpicelli FM, Garcia LI, Sandeep N, Zhang J, Marquez-Rosado L, Lampe PD, Fishman GI. Gap junction remodeling and spironolactone-dependent reverse remodeling in the hypertrophied heart. Circ Res. 2009;104:365–371. doi: 10.1161/CIRCRESAHA.108.184044. [DOI] [PMC free article] [PubMed] [Google Scholar]
- 4.Akar FG, Nass RD, Hahn S, Cingolani E, Shah M, Hesketh GG, DiSilvestre D, Tunin RS, Kass DA, Tomaselli GF. Dynamic changes in conduction velocity and gap junction properties during development of pacing-induced heart failure. Am J Physiol Heart Circ Physiol. 2007;293:H1223–H1230. doi: 10.1152/ajpheart.00079.2007. [DOI] [PubMed] [Google Scholar]
- 5.Danik SB, Rosner G, Lader J, Gutstein DE, Fishman GI, Morley GE. Electrical remodeling contributes to complex tachyarrhythmias in connexin43-deficient mouse hearts. FASEB J. 2008;22:1204–1212. doi: 10.1096/fj.07-8974com. [DOI] [PMC free article] [PubMed] [Google Scholar]
- 6.Jansen JA, Noorman M, Musa H, Stein M, de Jong S, van der Nagel R, Hund TJ, Mohler PJ, Vos MA, van Veen TA, de Bakker JM, Delmar M, van Rijen HV. Reduced heterogeneous expression of Cx43 results in decreased Nav1.5 expression and reduced sodium current that accounts for arrhythmia vulnerability in conditional Cx43 knockout mice. Heart Rhythm. 2012;9:600–607. doi: 10.1016/j.hrthm.2011.11.025. [DOI] [PMC free article] [PubMed] [Google Scholar]
- 7.Desplantez T, McCain ML, Beauchamp P, Rigoli G, Rothen-Rutishauser B, Parker KK, Kleber AG. Connexin43 ablation in fetal atrial myocytes decreases electrical coupling, partner connexins, and sodium current. Cardiovasc Res. 2012;94:58–65. doi: 10.1093/cvr/cvs025. [DOI] [PMC free article] [PubMed] [Google Scholar]
- 8.Lübkemeier I, Requardt RP, Lin X, Sasse P, Andrie R, Schrickel JW, Chkourko H, Bukauskas FF, Kim JS, Frank M, Malan D, Zhang J, Wirth A, Dobrowolski R, Mohler PJ, Offermanns S, Fleischmann BK, Delmar M, Willecke K. Deletion of the last five C-terminal amino acid residues of connexin43 leads to lethal ventricular arrhythmias in mice without affecting coupling via gap junction channels. Basic Res Cardiol. 2013;108:348–364. doi: 10.1007/s00395-013-0348-y. [DOI] [PMC free article] [PubMed] [Google Scholar]
- 9.Sorgen PL, Duffy HS, Sahoo P, Coombs W, Delmar M, Spray DC. Structural changes in the carboxyl terminus of the gap junction protein connexin43 indicates signaling between binding domains for c-Src and zonula occludens-1. J Biol Chem. 2004;279:54695–54701. doi: 10.1074/jbc.M409552200. [DOI] [PubMed] [Google Scholar]
- 10.Hunter AW, Barker RJ, Zhu C, Gourdie RG. Zonula occludens-1 alters connexin43 gap junction size and organization by influencing channel accretion. Mol Biol Cell. 2005;16:5686–5698. doi: 10.1091/mbc.E05-08-0737. [DOI] [PMC free article] [PubMed] [Google Scholar]
- 11.Francis R, Xu X, Park H, Wei CJ, Chang S, Chatterjee B, Lo C. Connexin43 modulates cell polarity and directional cell migration by regulating microtubule dynamics. PLoS ONE. 2011;6:e26379. doi: 10.1371/journal.pone.0026379. [DOI] [PMC free article] [PubMed] [Google Scholar]
- 12.Casini S, Tan HL, Demirayak I, Remme CA, Amin AS, Scicluna BP, Chatyan H, Ruijter JM, Bezzina CR, van Ginneken AC, Veldkamp MW. Tubulin polymerization modifies cardiac sodium channel expression and gating. Cardiovasc Res. 2010;85:691–700. doi: 10.1093/cvr/cvp352. [DOI] [PubMed] [Google Scholar]
- 13.Agullo-Pascual E, Reid DA, Keegan S, Sidhu M, Fenyö D, Rothenberg E, Delmar M. Super-resolution fluorescence microscopy of the cardiac connexome reveals plakophilin-2 inside the connexin43 plaque. Cardiovasc Res. 2013;100:231–240. doi: 10.1093/cvr/cvt191. [DOI] [PMC free article] [PubMed] [Google Scholar]
- 14.Bhargava A, Lin X, Novak P, Mehta K, Korchev Y, Delmar M, Gorelik J. Super-resolution scanning patch clamp reveals clustering of functional ion channels in adult ventricular myocyte. Circ Res. 2013;112:1112–1120. doi: 10.1161/CIRCRESAHA.111.300445. [DOI] [PMC free article] [PubMed] [Google Scholar]
- 15.Tamura N, Draviam VM. Microtubule plus-ends within a mitotic cell are ‘moving platforms’ with anchoring, signalling and force-coupling roles. Open Biol. 2012;2:120132. doi: 10.1098/rsob.120132. [DOI] [PMC free article] [PubMed] [Google Scholar]
- 16.Cerrone M, Lin X, Zhang M, Agullo-Pascual E, Pfenniger A, Chkourko-Gusky H, Novelli V, Kim C, Tirasawadichai T, Judge DP, Rothenberg E, Chen HS, Napolitano C, Priori S, Delmar M. Missense mutations in plakophilin-2 cause sodium current deficit and associate with a brugada syndrome phenotype. Circulation. 2014;129:1092–1103. doi: 10.1161/CIRCULATIONAHA.113.003077. [DOI] [PMC free article] [PubMed] [Google Scholar]
- 17.Bellett G, Carter JM, Keynton J, Goldspink D, James C, Moss DK, Mogensen MM. Microtubule plus-end and minus-end capture at adherens junctions is involved in the assembly of apico-basal arrays in polarised epithelial cells. Cell Motil Cytoskeleton. 2009;66:893–908. doi: 10.1002/cm.20393. [DOI] [PubMed] [Google Scholar]
- 18.Shaw RM, Fay AJ, Puthenveedu MA, von Zastrow M, Jan YN, Jan LY. Microtubule plus-end-tracking proteins target gap junctions directly from the cell interior to adherens junctions. Cell. 2007;128:547–560. doi: 10.1016/j.cell.2006.12.037. [DOI] [PMC free article] [PubMed] [Google Scholar]
- 19.Pustylnik S, Fiorino C, Nabavi N, Zappitelli T, da Silva R, Aubin JE, Harrison RE. EB1 levels are elevated in ascorbic acid (AA)-stimulated osteoblasts and mediate cell-cell adhesion-induced osteoblast differentiation. J Biol Chem. 2013;288:22096–22110. doi: 10.1074/jbc.M113.481515. [DOI] [PMC free article] [PubMed] [Google Scholar]
- 20.Conde C, Caceres A. Microtubule assembly, organization and dynamics in axons and dendrites. Nat Rev Neurosci. 2009;10:319–332. doi: 10.1038/nrn2631. [DOI] [PubMed] [Google Scholar]
- 21.Oddoux S, Zaal KJ, Tate V, Kenea A, Nandkeolyar SA, Reid E, Liu W, Ralston E. Microtubules that form the stationary lattice of muscle fibers are dynamic and nucleated at Golgi elements. J Cell Biol. 2013;203:205–213. doi: 10.1083/jcb.201304063. [DOI] [PMC free article] [PubMed] [Google Scholar]
- 22.Nogales E, Whittaker M, Milligan RA, Downing KH. High-resolution model of the microtubule. Cell. 1999;96:79–88. doi: 10.1016/s0092-8674(00)80961-7. [DOI] [PubMed] [Google Scholar]
- 23.Peter SJ, Mofrad MR. Computational modeling of axonal microtubule bundles under tension. Biophys J. 2012;102:749–757. doi: 10.1016/j.bpj.2011.11.4024. [DOI] [PMC free article] [PubMed] [Google Scholar]
- 24.Fadic R, Vergara J, Alvarez J. Microtubules and caliber of central and peripheral processes of sensory axons. J Comp Neurol. 1985;236:258–264. doi: 10.1002/cne.902360209. [DOI] [PubMed] [Google Scholar]
- 25.Lin X, Liu N, Lu J, Zhang J, Anumonwo JM, Isom LL, Fishman GI, Delmar M. Subcellular heterogeneity of sodium current properties in adult cardiac ventricular myocytes. Heart Rhythm. 2011;8:1923–1930. doi: 10.1016/j.hrthm.2011.07.016. [DOI] [PMC free article] [PubMed] [Google Scholar]
- 26.Petitprez S, Zmoos AF, Ogrodnik J, Balse E, Raad N, El-Haou S, Albesa M, Bittihn P, Luther S, Lehnart SE, Hatem SN, Coulombe A, Abriel H. SAP97 and dystrophin macromolecular complexes determine two pools of cardiac sodium channels Nav1.5 in cardiomyocytes. Circ Res. 2011;108:294–304. doi: 10.1161/CIRCRESAHA.110.228312. [DOI] [PubMed] [Google Scholar]
- 27.Giepmans BN, Verlaan I, Hengeveld T, Janssen H, Calafat J, Falk MM, Moolenaar WH. Gap junction protein connexin-43 interacts directly with microtubules. Curr Biol. 2001;11:1364–1368. doi: 10.1016/s0960-9822(01)00424-9. [DOI] [PubMed] [Google Scholar]
- 28.Huang B, Wang W, Bates M, Zhuang X. Three-dimensional super-resolution imaging by stochastic optical reconstruction microscopy. Science. 2008;319:810–813. doi: 10.1126/science.1153529. [DOI] [PMC free article] [PubMed] [Google Scholar]
- 29.Kostin S, Hein S, Bauer EP, Schaper J. Spatiotemporal development and distribution of intercellular junctions in adult rat cardiomyocytes in culture. Circ Res. 1999;85:154–167. doi: 10.1161/01.res.85.2.154. [DOI] [PubMed] [Google Scholar]
- 30.Maass K, Shibayama J, Chase SE, Willecke K, Delmar M. C-terminal truncation of connexin43 changes number, size, and localization of cardiac gap junction plaques. Circ Res. 2007;101:1283–1291. doi: 10.1161/CIRCRESAHA.107.162818. [DOI] [PubMed] [Google Scholar]
- 31.Leterrier C, Vacher H, Fache MP, d'Ortoli SA, Castets F, Autillo-Touati A, Dargent B. End-binding proteins EB3 and EB1 link microtubules to ankyrin G in the axon initial segment. Proc Natl Acad Sci USA. 2011;108:8826–8831. doi: 10.1073/pnas.1018671108. [DOI] [PMC free article] [PubMed] [Google Scholar]
- 32.Lowe JS, Palygin O, Bhasin N, Hund TJ, Boyden PA, Shibata E, Anderson ME, Mohler PJ. Voltage-gated Nav channel targeting in the heart requires an ankyrin-G dependent cellular pathway. J Cell Biol. 2008;180:173–186. doi: 10.1083/jcb.200710107. [DOI] [PMC free article] [PubMed] [Google Scholar]
- 33.Zhou D, Lambert S, Malen PL, Carpenter S, Boland LM, Bennett V. AnkyrinG is required for clustering of voltage-gated Na channels at axon initial segments and for normal action potential firing. J Cell Biol. 1998;143:1295–1304. doi: 10.1083/jcb.143.5.1295. [DOI] [PMC free article] [PubMed] [Google Scholar]
- 34.Sato PY, Coombs W, Lin X, Nekrasova O, Green KJ, Isom LL, Taffet SM, Delmar M. Interactions between ankyrin-G, plakophilin-2, and connexin43 at the cardiac intercalated disc. Circ Res. 2011;109:193–201. doi: 10.1161/CIRCRESAHA.111.247023. [DOI] [PMC free article] [PubMed] [Google Scholar]
- 35.Delmar M, McKenna WJ. The cardiac desmosome and arrhythmogenic cardiomyopathies: from gene to disease. Circ Res. 2010;107:700–714. doi: 10.1161/CIRCRESAHA.110.223412. [DOI] [PubMed] [Google Scholar]
- 36.Li J, Goossens S, van Hengel J, Gao E, Cheng L, Tyberghein K, Shang X, De Rycke R, van Roy F, Radice GL. Loss of alphaT-catenin alters the hybrid adhering junctions in the heart and leads to dilated cardiomyopathy and ventricular arrhythmia following acute ischaemia. J Cell Sci. 2012;125:1058–1067. doi: 10.1242/jcs.098640. [DOI] [PMC free article] [PubMed] [Google Scholar]
- 37.Franke WW, Borrmann CM, Grund C, Pieperhoff S. The area composita of adhering junctions connecting heart muscle cells of vertebrates. I. Molecular definition in intercalated disks of cardiomyocytes by immunoelectron microscopy of desmosomal proteins. Eur J Cell Biol. 2006;85:69–82. doi: 10.1016/j.ejcb.2005.11.003. [DOI] [PubMed] [Google Scholar]
- 38.Rhett JM, Ongstad EL, Jourdan J, Gourdie RG. Cx43 associates with Na(v)1.5 in the cardiomyocyte perinexus. J Membr Biol. 2012;245:411–422. doi: 10.1007/s00232-012-9465-z. [DOI] [PMC free article] [PubMed] [Google Scholar]
- 39.Rhett JM, Jourdan J, Gourdie RG. Connexin 43 connexon to gap junction transition is regulated by zonula occludens-1. Mol Biol Cell. 2011;22:1516–1528. doi: 10.1091/mbc.E10-06-0548. [DOI] [PMC free article] [PubMed] [Google Scholar]
- 40.Delmar M, Liang FX. Connexin43 and the regulation of intercalated disc function. Heart Rhythm. 2012;9:835–838. doi: 10.1016/j.hrthm.2011.10.028. [DOI] [PMC free article] [PubMed] [Google Scholar]
- 41.Agullo-Pascual E, Cerrone M, Delmar M. Arrhythmogenic cardiomyopathy and brugada syndrome: diseases of the connexome. FEBS Lett. 2014;588:1322–1330. doi: 10.1016/j.febslet.2014.02.008. [DOI] [PMC free article] [PubMed] [Google Scholar]