

Abstract
Objective.
First, we tested the hypothesis that the rate of change of physical frailty and cognitive function in older adults are correlated. Next, we examined if their rates of change are associated with the same brain pathologies.
Methods.
About 2,167 older adults participating in the Religious Orders Study and the Rush Memory and Aging Project had annual clinical evaluations. Bivariate random coefficient models were used to estimate simultaneously the rates of change in both frailty and cognition, and the correlation of change was characterized by a joint distribution of the random effects. Then, we examined whether postmortem indices from deceased were associated with the rate of change of frailty and cognition.
Results.
During an average follow-up of 6 years, frailty worsened by 0.09 unit/y and cognition declined by 0.08 unit/y. Most individuals showed worsening frailty and cognition (82.8%); 17% showed progressive frailty alone and <1% showed only cognitive decline. The rates of change of frailty and cognition were strongly correlated (ρ = −0.73, p < .001). Among deceased (N = 828), Alzheimer’s disease pathology, macroinfarcts, and nigral neuronal loss showed independent associations with the rate of change in both frailty and cognition (all ps < .001). In these models, demographics explained about 9% of the variation in individual rate of change in frailty, and neuropathologies explained about 8%. In contrast, demographics and neuropathologies accounted for 2% and 30%, respectively, of the variance in the cognitive decline.
Conclusion.
The rates of change in frailty and cognition are strongly correlated and this may be due in part because they share a common pathologic basis.
Key Words: Physical frailty, Cognition, Aging, Brain pathology.
Concepts of chronic age-related neurologic diseases are evolving with evidence that Alzheimer’s disease (AD), Parkinson’s disease (PD) and cerebrovascular disease pathology are common in older individuals without overt neurologic disease (1–3). Moreover, the presence of these pathologies in older adults is associated with a wider range of clinical manifestations including higher levels of frailty and lower levels of physical and cognitive functions (4–7).Despite these advances, there are several important gaps in our knowledge about progressive frailty and cognitive decline in older adults (8–12). First, because prior studies have examined the rate of change in frailty or cognition separately, it is not known to what extent their rates of change are correlated (13,14).Second, in prior work, separate analyses showed that the pathologies of AD, PD, and cerebrovascular disease were related to progressive frailty and cognitive decline (4,7). It is not known whether the same pathologies are associated with the rate of change in frailty and cognition in the same individuals.
We used data from 2,167 older persons participating in two cohort studies of aging that include brain donation at death. First, we tested the hypothesis that the rates of change of frailty and cognition are correlated. Second, we tested whether their rates of change were related to the same brain pathologies (15,16).The measure for frailty used in this study is based on the physical frailty measure proposed by Fried and colleagues (10) and has been used by many investigators and does not include cognitive function. Measures of physical frailty and cognition were derived from structured annual assessments and postmortem indices were obtained from autopsy. Bivariate random coefficient models were used to estimate simultaneously the rates of change in both cognition and frailty, and the correlation of the level of and the rate of change in both functions was characterized by a joint distribution of the random effects. We also examined whether postmortem indices of common brain pathologies are associated with both worsening physical frailty and cognition.
Methods
Participants
Participants are from two ongoing studies of aging approved by the Institutional Review Board of Rush University Medical Center. Participants in both studies agree to annual clinical exams and autopsy at the time of death. Both studies employ common antemortem and postmortem data collection allowing analyses of data from the combined cohorts (15,16). Participation in the annual follow-up evaluations exceeds 90% of survivors and the autopsy rate exceeds 85%. In these analyses, baseline is the cycle in which the first valid frailty assessment with a valid measure of cognition during the same cycle was available.
At the time of these analyses, 2,607 participants had enrolled and completed their baseline clinical assessment for these analyses (Religious Order Study [ROS]: N = 1,088; Memory and Aging Project [MAP]: N = 1,519). To calculate the rate of change in frailty and cognition only cases with two or more valid frailty and cognition assessments were included (mean = 5.4, SD = 2.9, range = 2–16), about 75% had four or more assessments. There were 440 who were excluded because they did not have a second evaluation either because they died before their second visit, had not been in the study long enough for follow-up assessment, or were lost to follow-up, leaving 2,167 for these analyses.
Cognition and Clinical Diagnoses
An annual uniform structured clinical evaluation includes medical history, neurologic examination, and neuropsychological performance tests (15,16). Nineteen cognitive tests were assessed and their scores were used to create a composite measure of global cognitive function to minimize floor and ceiling effects (14,15). Dementia (N = 121, 5.6%) was diagnosed in a three-step process. Cognitive tests were scored by a computer and reviewed by a neuropsychologist to diagnose cognitive impairment. Then, participants were evaluated by a physician who used all cognitive and clinical data to diagnose dementia (15,16). Parkinson’s disease (N = 20, 1%) was based on a self-report history of PD for which the participant received treatment with levodopa (5).
Physical Frailty
Physical frailty was based on grip strength, timed walk, body composition, and fatigue. These components were not weighted and were summarized in a previously established continuous composite measure (see Supplementary Methods) (6,7,13,17–19). To be consistent with prior frailty measures, composite physical frailty is constructed so that a higher value was indicative of more severe frailty.
Comorbidities and Other Covariates
Sex and years of education were recorded at the baseline interview. Age in years was computed from self-reported date of birth and clinical evaluation date. Seven chronic diseases were documented at baseline based on self-report of hypertension, diabetes, myocardial infarction, cancer, thyroid disease, head trauma, and stroke (16).
Postmortem Indices
Brain removal, tissue sectioning and preservation, and a uniform gross and microscopic exam with quantification of postmortem indices followed a standard protocol. Postmortem indices included the presence of chronic macroinfarcts and microinfarcts as well as semiquantitative measure of nigral neuronal loss and a summary measure for AD and Lewy body disease pathology (see Supplementary Methods).
Statistical Analyses
Pairwise associations of baseline frailty and cognition with demographic variables were examined using Pearson correlations. Bivariate random coefficient models were used to estimate simultaneously the levels and rates of change of frailty and cognition, and the correlation of level of and change in both outcomes was characterized by a joint distribution of the random effects. These models examined the simultaneous rate of change in frailty and cognition over the same interval of time. Subsequent analyses controlled for demographic (age, sex, and education), and chronic health conditions. In a final series of analyses, we added terms for postmortem indices and estimated to what extent postmortem indices were associated with the rates of change in frailty and cognition. Models were examined graphically and analytically, and assumptions were judged to be adequately met. Quantile–quantile plots were reviewed to insure that composite measures of frailty and global cognition were not affected by floor and ceiling effects (see Supplementary Methods). A priori level of statistical significance was .05. Programming was done in SAS version 9.3 (SAS Institute Inc., Cary, NC) (20).
Results
Clinical Characteristics of Participants at Baseline
Clinical characteristics of participants in these analyses at baseline are included in Table 1. Frailty at baseline ranged from −1.69 to 2.40 with a more positive value indicative of more severe frailty, on average frailty was −0.03 (SD = 0.59). Frailty was associated with age (r = .48; p < .001) and education (r = −.16, p < .001). At baseline, women were more frail (t 2,165 = 2.59, p = .010). Cognition at baseline ranged from −3.45 to 1.46 with a more positive value indicative of better cognition, on average cognition was 0.07 (SD = 0.63). Cognition was associated with age (r = −.37; p < .001) and education (r = .33, p < .001). At baseline, cognition was higher in women (t 964 = 2.23, p = .026). At baseline for these analyses, frailty and cognition were related (r = −.43, p < .001).
Table 1.
Clinical Characteristics at Study Entry and Postmortem Indices (N = 2167)
| All (N = 2,167) | Alive (N = 1,191) | Deceased (N = 976) | |
|---|---|---|---|
| Variable | Mean (SD) or N (%) | Mean (SD) or N (%) | Mean (SD) or N (%) |
| Demographics | |||
| Age at baseline (y) | 78.5 (7.71) | 75.9 (7.46) | 81.7 (6.75)* ,† |
| Age at last visit (y) | 88.5 (6.62) | 82.8 (7.59) | 86.4 (6.57)† |
| Sex (female) | 1571 (72.5%) | 927 (77.8%) | 644 (66.0%)† |
| White, non-Hispanic | 1916 (88.5%) | 1009 (84.8%) | 907 (93.0%)† |
| Education (y) | 16.2 (3.70) | 16.1 (3.75) | 16.3 (3.63) |
| Apolipoprotein E4 allele status | 466 (24.2%) | 225 (22.9%) | 241 (25.5%) |
| Global cognition (composite) | 0.07 (SD = 0.63) | 0.23 (0.55) | −0.13 (0.66)† |
| Physical frailty (composite) | −0.03 (SD = 0.59) | −0.21 (0.51) | 0.18 (0.60)† |
| Self-report medical conditions | 1.66 (1.09) | 1.24 (1.00) | 1.53 (1.11)‡ |
| Hypertension | 1066 (49.2%) | 560 (47.0%) | 506 (51.9%) |
| Diabetes | 226 (10.5%) | 111 (9.4%) | 115 (11.9%) |
| Myocardial infarction | 247 (11.4%) | 84 (7.1%) | 163 (16.7%) |
| Cancer | 674 (31.1%) | 348 (29.2%) | 326 (33.4%) |
| Thyroid disorder | 415 (19.2%) | 231 (19.4%) | 184 (18.9%) |
| Head trauma | 148 (6.8%) | 83 (7.0%) | 65 (6.7%) |
| Stroke | 189 (9.36%) | 61 (5.7%) | 128 (13.2%) |
| Postmortem indices (N = 828) | |||
| Postmortem interval (h) | 8.50 (7.68) | ||
| Chronic macroinfarct (≥1) | 294 (35.6%) | ||
| Chronic microinfarct (≥1) | 240 (29.0%) | ||
| Alzheimer’s disease (based on National Institute on Aging Reagan) | 515 (62.3%) | ||
| Lewy body disease present | 180 (21.8%) | ||
| Nigral neuronal loss (moderate–severe) | 120 (14.6%) | ||
Notes: NIA = National Institute on Aging.
*Based on t test or chi-square test.
† p < .001, ‡ p < .05.
Correlation of Levels and Rates of Change of Frailty and Cognition
Worsening frailty and cognition occur simultaneously in the same individuals and their initial levels and rates of change may not be independent. Comparing the level and rate of change of frailty and cognition derived from separate models assumes they are independent outcomes and may underestimate their associations. Therefore, in these analyses, we employed bivariate random coefficient models which used the repeated clinical observations to estimate the correlation structure between frailty and cognition. This single model examines the associations of baseline level of frailty and cognition with the rate of change in frailty and cognition and the extent to which simultaneous change in frailty and cognition are associated. Crude paths of change (gray lines) and mean paths of change predicted by the model (black) in frailty (top) and cognition (bottom) during this study are illustrated in the left upper and lower panels of Figure 1.
Figure 1.

Change in frailty and cognition and the effect of more brain pathology on their rates of change. The left panels show change in frailty (top) and global cognitive function (bottom) during the study. Crude paths of change (gray lines) and mean paths of change predicted by the model (black lines) in frailty (top) and global cognitive function (bottom). The right panels show the predicted paths of frailty (top) and cognition (bottom) for four participants with increasing burden of brain pathology. (1) Black line, the predicted path for a participant with low level of Alzheimer’s disease (AD) pathology (10th percentile). (2) Red line, the predicted path for a participant with a high level of AD pathology (90th percentile). (3) Green line, the predicted path for a participant with a high level of AD pathology (90th percentile) and macroinfarcts. (4) Blue line, the predicted path for a participant with a high level of AD pathology (90th percentile), macroinfarcts and severe nigral neuronal loss.
Average follow-up was 6 years (5.9 years, SD = 3.98 years). On average, frailty increased by about 0.09 units/y (0.088, SD = 0.044) with a range from −0.012 unit/y to 0.272 unit/y. On average, cognition declined about 0.08 unit/y (−0.077, SD = 0.094) with a range from −0.582 unit/y to 0.123 unit/y. Examining the slopes measures for physical frailty and cognition, about 17.0% showed progressive frailty alone (N = 369, 17.0%) but most showed progressive frailty and cognitive decline (N = 1,794, 82.8%) and <1% showed only cognitive decline. At baseline, individuals with both progressive frailty and declining cognition were older, had less education, were more frail, and had lower cognition compared with individuals with only progressive frailty (results not shown).
At baseline, individuals with more severe frailty tended to have lower cognition but only about 20% of the estimated shared variance of cognition (estimated by squaring the correlation and multiplying by 100) was associated with the severity of frailty (Table 2). Baseline frailty was associated with the rate of change in frailty and cognition (Table 2). However, these associations accounted for less than 20% of the shared variance (about 16% or 13%). Similar associations were noted for baseline cognition with declining cognition and progressive frailty (Table 2). Thus, baseline levels of frailty or cognition only account for a small amount of the variance in either progressive frailty or declining cognition.
Table 2.
Correlation of Baseline and Longitudinal Changes in Frailty and Cognition*
| Variable | Frailtybl | Change in Cognition | Change in Frailty |
|---|---|---|---|
| Cognitionbl | −0.48 | 0.50 | −0.46 |
| Frailtybl | — | −0.40 | 0.35 |
| Change in cognition | — | −0.73 |
Notes: *Estimated correlation between the baseline and longitudinal terms included in the simultaneous bivariate random coefficient models (Figure 2). The core model included terms for baseline frailty and cognition and their interaction with time, that is, the rate of change in frailty and the rate of change in cognition. Progressive frailty and declining cognition were inversely related because the summary measure for cognition was constructed so that a higher value was indicative of better function and the frailty measure was constructed so that a more positive value was indicative of more severe frailty.
In contrast, the simultaneous change in the person-specific rates of change of frailty and cognition was strongly correlated (r = −.73, p < .001) but almost 50% of the estimated shared variance remained unexplained (Table 2). Similar findings were observed in analyses of only those individuals who died and underwent autopsy (r = −.70, p < .001).
On the left in Figure 2 is a two-dimensional histogram of the model derived annual rates of change in frailty and cognition. The points cluster along the full range of the diagonal, indicating a strong linear association between the rates of change in frailty and cognition. The density map on the right side of Figure 2 highlights the strong relationship between the rates of change in frailty and cognition.
Figure 2.
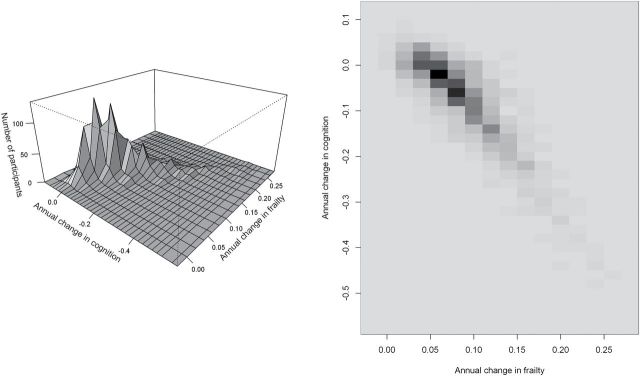
Annual rates of change in frailty and cognition. On the left is a two-dimensional histogram of annual rates of change in frailty and cognition estimated by simultaneous random effects model. The figure on the right depicts the density of the number of participants shown in the two-dimensional histogram with black showing increased density compared with the lighter shades of gray.
Determining the rate of change of frailty and cognition in separate models assumes they are independent outcomes and may therefore underestimate their association. We compared the association between the rates of change in frailty and cognition derived from a single simultaneous change model with the results derived from separate mixed-effect models. The rates of change in frailty and cognition derived from separate models were strongly correlated (r = −.52, p < .001) but less than the association derived from a single simultaneous change model (Table 2).
In sensitivity analyses, we repeated the models described above after excluding cases with clinical dementia or a diagnosis of PD at baseline and the correlation of the rate of change in frailty and cognition remained highly significant (r = −.69, p < .001). Similar findings were observed in analyses of only those individuals who died and underwent autopsy (r = −.66, p < .001).
In further analyses, we considered several other covariates which might affect the relationship between frailty and cognition. Prior literature suggests that demographic variables and race may be associated with the rate of change in frailty and cognition, so we added terms to control for age, sex, education, and race and their interaction with time (21–23). Age but not sex, education or race was associated with the rates of change in frailty and cognition (results not shown). The association between simultaneous change in frailty and cognition was significant when controlling for demographic variables and race (r = −.68, p < .001). Similar findings were observed in analyses of only those individuals who died and underwent autopsy (r = −.69, p < .001).
Poor health can affect both frailty and cognition. The number of chronic health conditions present during the study was associated with the rate of change in frailty but not in cognition (results not shown). Controlling for the number of chronic health conditions present during the study did not affect the correlation of the rate of change in frailty and cognition (r = −.74, p < .001). Similar findings were observed in separate analyses of those individuals who died and underwent autopsy (r = −.72, p < .001).
Because there were more women than men included in this study (Table 1), we examined separate models. Simultaneous change in frailty and cognition was associated in both men (r = −.78, p < .001) and women (r = −.73, p < .001). Similar findings were observed in analyses of only those individuals who died and underwent autopsy (men [r = −.72, p < .001]; women [r = −.71, p < .001]).
The individuals included in these analyses derived from two different studies. In separate analyses, the association of progressive frailty and cognitive decline was significant in both studies (ROS: r = −.78, p < .001; MAP: r = −.67, p < .001). Similar findings were observed in separate analyses of only those individuals who died and underwent autopsy (ROS: r = −.72, p < .001; MAP: r = −.70, p < .001).
Correlation of Rates of Change of Components of Frailty and Cognition
Because frailty is a multidimensional construct, it is possible that the rate of change in cognition may be associated with some of the individual components of frailty but not others. We repeated the analyses described earlier for physical frailty for its components (grip strength, gait speed, and body mass index) which were amenable to these longitudinal analyses. In separate models, the rates of change of all three components were significantly correlated with the rate of change in cognition. The strongest correlation was between the rates of change of gait speed and cognition (r = −.67, p < .001). The rates of change in grip strength and cognition were also strongly correlated (r = −.51, p < .001) although the rates of change in body mass index and cognition were much less strongly correlated (r = −.17, p = .003).
Associations of Brain Pathologies and the Rates of Change of Frailty and Cognition
A shared pathologic basis might account for the strong association between worsening frailty and cognition. There were 976 of 2,167 cases included in these analyses who died (45%) and 872 (89.3%) underwent a brain autopsy. A uniform neuropathologic examination had been completed in the first consecutive 828 individuals (ROS = 475, MAP = 353). A summary of the five brain pathologies measured in this study are included in Table 1. About 85% of cases had evidence of one or more neuropathologies (1 = 33.3%; 2 = 30.2%; 3 = 16.6%; 4 = 3.9%; 5 = 1.0%).
We repeated the core model (Table 2) in deceased participants who underwent autopsy and added four terms for each of the postmortem indices and terms for age, sex, and education as well as the interactions of these seven terms with time to the core model (Table 2)to determine if brain pathologies were associated with the rates of change of frailty and cognition. In this model, the correlation between the simultaneous change in frailty and cognition remained significant (r = −.708, p < .001). The presence of macroinfarcts, AD pathology, and nigral neuronal loss were each associated with a more rapid progression of frailty and declining cognition during the study, whereas microscopic infarcts was not (Table 3). Similar findings were obtained in a model which included Lewy body pathology instead of nigral neuronal loss (results not shown). As in earlier work when terms for Lewy body pathology and nigral neuronal loss were included together the association of Lewy body pathology and progressive frailty is no longer significant (results not shown) (5,7).
Table 3.
Associations of Brain Pathology and the Rate of Change in Frailty and Cognition (N = 828)*
| Rate of Change in Frailty | Rate of Change in Cognition | ||
|---|---|---|---|
| Term | Estimate (SE, p Value) | Term | Estimate (SE, p Value) |
| Rate of change in frailty × Age | 0.002 (0.0006, .006) | Rate of change in cognition × Age | −0.003 (0.0008, <.001) |
| Rate of change in frailty × Sex | 0.009 (0.009, .304) | Rate of change in cognition × Sex | −0.009 (0.012, .461) |
| Rate of change in frailty × Education | −0.003 (0.001, .006) | Rate of change in cognition × Education | 0.001 (0.002, .494) |
| Rate of change in frailty × Macroinfarcts | 0.032 (0.009, p < .001) | Rate of change in cognition × Macroinfarcts | −0.035 (0.012, p = .003) |
| Rate of change in frailty × Microinfarcts | 0.009 (0.009, p = 0.342) | Rate of change in cognition × Microinfarcts | −0.006 (0.012, p = .583) |
| Rate of change in frailty × AD pathology | 0.020 (0.007, p = .004) | Rate of change in cognition × AD pathology | −0.112 (0.009, p < .001) |
| Rate of change in frailty × Nigral neuronal loss | 0.017 (0.005, p < .001) | Rate of change in cognition × Nigral neuronal loss | −0.025 (0.006, p < .001) |
Notes: AD = Alzheimer’s disease.
*Estimated from simultaneous bivariate random coefficient models which included terms for baseline and rate of change in frailty and cognition. To this core model, we added terms to control for demographics (age, sex, and education) and four pathologies and their interactions with the rate of change in cognition and rate of change in frailty. This table only shows the interaction between demographic variables and brain pathologies and the rates of change in cognition and frailty. The other terms included in the model are not shown.
The right panels of Figure 1 illustrate the additive effects of these three pathologies on the rate of change of frailty and cognition by showing the trajectories for four average participants with increasing burden of these pathologies. The rate of increase in frailty for a participant with high levels of AD pathology (90th percentile), macroinfarcts, and severe nigral neuronal loss was two times more rapid than an individual with only low levels of AD pathology (10th percentile). The rate of cognitive decline for a participant with high levels of AD pathology (90th percentile), macroinfarcts and severe nigral neuronal loss was 10 times more rapid than an individual with only low levels of AD pathology (10th percentile).
As shown in Table 4, together the terms for demographic variables and postmortem indices included in this model explained more than 15% of the variance of progressive frailty. In contrast, these same demographic variables and postmortem indices explained more than 30% of the variance of declining cognition.
Table 4.
Percentage of the Variance of Rate of Change in Frailty and Cognition Explained by Demographics and Postmortem Indices
| Term | Percentage of Variance of Change in Frailty | Percentage of Variance of Change in Cognition |
|---|---|---|
| Demographics | 9.19% | 2.10% |
| Age | 6.37% | 2.09% |
| Sex | 0.00% | 0.01% |
| Education | 2.82% | 0.00% |
| Pathologies | 8.06% | 29.96% |
| Macroinfarcts | 3.42% | 0.97% |
| Microinfarcts | 0.20% | 0.00% |
| AD pathology | 1.53% | 26.34% |
| Nigral neuronal loss | 2.91% | 2.63% |
| Total | 17.25% | 32.04% |
Note: AD = Alzheimer’s disease. Values in bold represent the total percentage of variance explained by demographic and pathology variables.
Discussion
The majority of very old adults in this community-based study of more than 2,000 individuals, followed for an average of 6 years, exhibited progressive physical frailty and cognitive decline. There was a strong correlation between the rate of worsening physical frailty and cognition and this correlation was not explained by demographic variables, race, or the number of chronic health conditions developed during the study. Analyses of frailty’s components suggest that the strong correlation between the rates of change in physical frailty and cognition is primarily due to gait speed and grip strength. Among more than 800 participants who died and underwent autopsy, macroinfarcts, AD, and PD pathology showed independent associations with the rate of change of both physical frailty and cognition. Overall these data suggest that late-life progressive physical frailty and declining cognition are strongly correlated and this may be due in part because they share a common pathologic basis.
Prior longitudinal studies have shown that both frailty and cognition worsen over time, but these studies have not examined whether their rates of change in the same individuals are associated (13,14). Understanding the extent to which their worsening is correlated has important translational consequences for identifying at risk individuals as well as for efforts to explicate their underlying biology. Several studies which have examined whether declining motor and cognitive function are associated have reported mixed results (24). A prior study in one of these cohorts found a strong correlation between the rate of change in Parkinsonism and cognition (25). In contrast, a more recent study did not find any correlation between the rate of change in motor function and cognition (26).
To fill this gap in our knowledge, the current study examined simultaneous change models which provide cross-sectional and longitudinal perspectives of frailty and cognition in the same individuals. This study confirms that individuals with higher baseline levels of frailty generally had lower levels of cognition. Second, overall both frailty and cognition worsen over time. Third, this study confirmed that baseline levels of frailty and cognition predicted the subsequent rate of change in either frailty or cognition. However, together these associations which are usually examined accounted for only a minority of <20% of the estimated variance of frailty and cognition. This underscores the necessity of identifying other features such as the rates of change of frailty and cognition which might account more fully for progressive frailty and cognition in older adults.
Nearly all the cases in this study showed some degree of progressive frailty and more than 80% showed concomitant clinical evidence of cognitive decline. The estimated correlation between the rates of change in frailty and cognition showed that their rates of change were more strongly associated, than previously recognized, accounting for >50% of the estimated variance in some models. The strong correlation between the rates of change in frailty and cognition is similar to a prior report in one of these cohorts which compared the rates of change in parkinsonism and cognition and may reflect the suggestion that both constructs, that is, parkinsonism and physical frailty, may measure different aspects of late-life motor impairment (26). These data have important public health consequences because they suggest that the majority of older adults experience both progressive frailty and cognitive decline and that their dissociation is uncommon. Therefore, the projected population increase in older individuals over the coming decades will require public health interventions not only for cognitive impairment but also likely to require care for concomitant progressive frailty.
The measure for frailty used in this study is based on the classification system for physical frailty proposed by Fried and colleagues (10) and has been used by many investigators. Nonetheless, considerable debate surrounds the extent to which cognition should be included in the definition of the syndrome and as yet there is no consensus on this issue (27,28). Nonetheless, the current study suggests that analyzing physical frailty with cognition separately can offer insights into common features and facets which might not be apparent if both constructs are summarized into a single complex clinical phenotype (29).
Traditionally, cognitive and physical functions are considered separate outputs of distinct neural systems and affected by distinct neurologic diseases and their underlying pathologies (1–6). Nonetheless, there is increasing evidence that both cognition and physical function may rely on similar underlying neural systems essential for planning and monitoring goal-directed behavior including attention, decision making, and executive functions (30,31). Furthermore, as deficits accumulate in older adults, increased sharing of shrinking residual resources may contribute to the strong association between the rate of change in cognition and frailty observed in the current study (32). The strong association between simultaneous change in frailty and cognition suggests that they may share a common pathologic basis. Recent reports have reported associations between several common brain pathologies and impaired physical and cognitive function in older adults without overt neurologic diseases (5,33–35). However, these studies have not examined the associations of these pathologies with the rate of change of frailty and cognition in the same individuals.
Brain pathologies examined in the current study explained more of the variance of declining cognition than progressive frailty (about 30% vs about 10%). Because we are unaware of similar analyses, it is unknown if these differences provide evidence that these pathologies are differentially associated with frailty and cognition or whether this reflects differences in the metrics of the frailty and cognitive measures employed. In addition, cognition does not rely directly on structural elements outside the brain. Therefore, non-neurologic causes of cognitive impairment such as those associated with systemic disease must still be mediated through the brain. In contrast, motor features contributing to physical frailty derive from motor control systems which reside both within the brain as well as in various other CNS regions including the brainstem and spinal cord. Moreover, through peripheral nerves, these motor control systems are integrated together with peripheral musculoskeletal structures and non-neurologic systems such as cardiopulmonary function and systemic metabolism. Thus, it is likely that physical frailty and cognition may show some degree of inter-relationship due to the effect on both from processes occurring in the brain but that overall brain pathology may account for a greater amount of declining cognition. Further studies are needed to determine the contributions of different CNS regions outside of the brain and non-neural systems to physical frailty (36). Nonetheless, the current data extends prior reports by showing that the accumulation of diverse brain pathologies in older adults is likely to contribute to both progressive frailty and declining cognition in the same individuals (Figure 1) (5,33–35). These data suggest that the accumulation of diverse common brain pathologies may affect a much larger number of older adults, who may manifest varying degrees of frailty and cognitive impairments not severe enough for traditional neurologic diagnoses. Thus, a much larger number of older adults might benefit from treatments developed for AD, PD, and cerebrovascular pathologies.
The study has strengths that lend confidence in the findings. All participants were recruited from the community and underwent an annual detailed clinical evaluation. Uniform, structured clinical, and postmortem procedures were followed. Autopsy rates were very high and all postmortem evaluations were performed by examiners blinded to all clinical data. The analytic approach employed in this study permitted simultaneous characterization of both cross-sectional and longitudinal association in the same individuals. The availability of postmortem indices provided an opportunity to examine whether frailty and cognition may share a common pathologic basis. However, this study cannot determine if the association with pathology is causal or that frailty and cognition are affected by a third latent variable. The large number of cases provided sufficient power to evaluate demographic and clinical variables that might have affected results.
This study has important limitations. First, participants were selected by their willingness to participate in these studies and their rates of chronic diseases may be lower than other studies suggesting that they may not represent the general population. Longitudinal studies of population-based samples are needed. Some of the individual components of physical frailty were assessed crudely such as body mass index and fatigue which may have resulted in an underestimation of change in frailty. Although regression to the mean cannot be excluded, annual follow-up rates were high and the use of composite measures minimized floor and ceiling effects. Because most of the postmortem indices were obtained from traditional cognitive regions, the findings may underestimate the association with frailty. Observation over a longer period of time would likely improve the estimation of individual patterns of progressive frailty and cognitive decline.
Supplementary Material
Supplementary material can be found at: http://biomedgerontology.oxfordjournals.org/
Funding
This work was supported by National Institute of Health grants R01AG17917, P30AG10161, R01AG31553, R01NS078009, and R01AG043379, the Illinois Department of Public Health, and the Robert C. Borwell Endowment Fund.
Supplementary Material
Acknowledgments
We thank all the participants in the Rush Memory and Aging Project and Religious Order Study. We also thank the staff of the Rush Alzheimer’s Disease Center.
References
- 1. Jack CR, Jr, Albert M, Knopman DS, et al. Introduction to revised criteria for the diagnosis of Alzheimer’s disease: National Institute on Aging and the Alzheimer’s Association workgroup. Alzheimers Dement. 2011;7:256–262. [Google Scholar]
- 2. Lang AE. A critical appraisal of the premotor symptoms of Parkinson’s disease: potential usefulness in early diagnosis and design of neuroprotective trials.Mov Disord. 2011;26:775–783. [DOI] [PubMed] [Google Scholar]
- 3. Gorelick PB, Scuteri A, Black SE, et al. Vascular contributions to cognitive impairment and dementia. Stroke. 2011;42:2672–2713. [DOI] [PMC free article] [PubMed] [Google Scholar]
- 4. Wilson RS, Leurgans SE, Boyle PA, Schneider JA, Bennett DA. Neurodegenerative basis of age-related cognitive decline. Neurology. 2010;75:1070–1078. [DOI] [PMC free article] [PubMed] [Google Scholar]
- 5. Buchman AS, Shulman JM, Nag S, et al. Nigral pathology and parkinsonian signs in elders without Parkinson disease. Ann Neurol. 2012;71:258–266. [DOI] [PMC free article] [PubMed] [Google Scholar]
- 6. Buchman AS, Schneider JA, Leurgans S, Bennett DA. Physical frailty in older persons is associated with Alzheimer disease pathology. Neurology. 2008;71:499–504. [DOI] [PMC free article] [PubMed] [Google Scholar]
- 7. Buchman AS, Yu L, Wilson RS, Schneider JA, Bennett DA. Association of brain pathology with the progression of frailty in older adults. Neurology. 2013;80:2055–2061. [DOI] [PMC free article] [PubMed] [Google Scholar]
- 8. Bandeen-Roche K, Xue QL, Ferrucci L, et al. Phenotype of frailty: characterization in the women’s health and aging studies. J Gerontol A Biol Sci Med Sci. 2006;61:262–266. [DOI] [PubMed] [Google Scholar]
- 9. Fried LP, Ferrucci L, Darer J, Williamson JD, Anderson G. Untangling the concepts of disability, frailty, and comorbidity: implications for improved targeting and care. J Gerontol A Biol Sci Med Sci. 2004; 59:255–263. [DOI] [PubMed] [Google Scholar]
- 10. Fried LP, Tangen CM, Walston J, et al. ; Cardiovascular Health Study Collaborative Research Group. Frailty in older adults: evidence for a phenotype. J Gerontol A Biol Sci Med Sci. 2001;56:M146–M156. [DOI] [PubMed] [Google Scholar]
- 11. Anstey KJ, Cherbuin N, Eramudugolla R, et al. Characterizing mild cognitive disorders in the young-old over 8 years: prevalence, estimated incidence, stability of diagnosis, and impact on IADLs. Alzheimer’s Dementia. 2013;9:640–648. [DOI] [PubMed] [Google Scholar]
- 12. Hebert LE, Weuve J, Scherr PA, Evans DA. Alzheimer disease in the United States (2010–2050) estimated using the 2010 census. Neurology. 2013;80:1778–1783. [DOI] [PMC free article] [PubMed] [Google Scholar]
- 13. Buchman AS, Boyle PA, Wilson RS, Tang Y, Bennett DA. Frailty is associated with incident Alzheimer’s disease and cognitive decline in the elderly. Psychosom Med. 2007;69:483–489. [DOI] [PubMed] [Google Scholar]
- 14. Wilson RS, Beckett LA, Barnes LL, et al. Individual differences in rates of change in cognitive abilities of older persons. Psychol Aging. 2002;17:179–193. [PubMed] [Google Scholar]
- 15. Bennett DA, Schneider JA, Buchman AS, Barnes LL, Boyle PA, Wilson RS. Overview and findings from the rush Memory and Aging Project. Curr Alzheimer Res. 2012;9:646–663. [DOI] [PMC free article] [PubMed] [Google Scholar]
- 16. Bennett DA, Schneider JA, Arvanitakis Z, Wilson RS. Overview and findings from the religious orders study. Curr Alzheimer Res. 2012;9:628–645. [DOI] [PMC free article] [PubMed] [Google Scholar]
- 17. Buchman AS, Wilson RS, Bienias JL, Bennett DA. Change in frailty and risk of death in older persons. Exp Aging Res. 2009;35:61–82. [DOI] [PMC free article] [PubMed] [Google Scholar]
- 18. Boyle PA, Buchman AS, Wilson RS, Leurgans SE, Bennett DA. Physical frailty is associated with incident mild cognitive impairment in community-based older persons.J Am Geriatr Soc. 2010;58:248–255. [DOI] [PMC free article] [PubMed] [Google Scholar]
- 19. Buchman AS, Leurgans SE, Boyle PA, Schneider JA, Arnold SE, Bennett DA. Combinations of motor measures more strongly predict adverse health outcomes in old age: the rush memory and aging project, a community-based cohort study. BMC Med. 2011;9:42. [DOI] [PMC free article] [PubMed] [Google Scholar]
- 20. SAS/STAT® Software for Unix, Version (9.18) [Computer Program]. Cary, NC: SAS Institute Inc.; 2002–2003. [Google Scholar]
- 21. Sachs-Ericsson N, Blazer DG. Racial differences in cognitive decline in a sample of community-dwelling older adults: the mediating role of education and literacy. Am J Geriatr Psychiatry. 2005;13:968–975. [DOI] [PubMed] [Google Scholar]
- 22. Barnes LL, Wilson RS, Li Y, et al. Racial differences in the progression of cognitive decline in Alzheimer disease. Am J Geriatr Psychiatry.2005;13:959–967. [DOI] [PubMed] [Google Scholar]
- 23. Hirsch C, Anderson ML, Newman A, et al. ; Cardiovascular Health Study Research Group. The association of race with frailty: the cardiovascular health study. Ann Epidemiol. 2006;16:545–553. [DOI] [PubMed] [Google Scholar]
- 24. Clouston SAP, Brewster P, Kuh D, et al. The dynamic relationship between physical function and cognition in longitudinal aging cohorts. Epidemiol Rev. 2013;35:33–50. [DOI] [PMC free article] [PubMed] [Google Scholar]
- 25. Wilson RS, Bennett DA, Gilley DW, Beckett LA, Schneider JA, Evans DA. Progression of Parkinsonism and loss of cognitive function in Alzheimer disease. Arch Neurol. 2000;57:855–860. [DOI] [PubMed] [Google Scholar]
- 26. Deary IJ, Johnson W, Gow AJ, et al. Losing one’s grip: a bivariate growth curve model of grip strength and nonverbal reasoning from age 79 to 87 years in the Lothian Birth Cohort 1921. J Gerontol B Psychol Sci Soc Sci. 2011;66:699–707. [DOI] [PubMed] [Google Scholar]
- 27. Ferrucci L, Guralnik JM, Studenski S, Fried LP, Cutler GB, Jr, Walston JD; Interventions on Frailty Working Group. Designing randomized, controlled trials aimed at preventing or delaying functional decline and disability in frail, older persons: a consensus report. J Am Geriatr Soc. 2004;52:625–634. [DOI] [PubMed] [Google Scholar]
- 28. Kelaiditi E, Cesari M, Canevelli M, et al. ; IANA/IAGG. Cognitive frailty: rational and definition from an (I.A.N.A./I.A.G.G.) international consensus group. J Nutr Health Aging. 2013;17:726–734. [DOI] [PubMed] [Google Scholar]
- 29. Buchman AS, Bennett DA. Cognitive frailty. J Nutr Health Aging. 2013;17:738–739. [DOI] [PMC free article] [PubMed] [Google Scholar]
- 30. Wolpert DM, Landy MS. Motor control is decision-making. Curr Opin Neurobiol. 2012;22:996–1003. [DOI] [PMC free article] [PubMed] [Google Scholar]
- 31. Amboni M, Barone P, Hausdorff JM. Cognitive contributions to gait and falls: evidence and implications. Mov Disord. 2013;28:1520–1533. [DOI] [PMC free article] [PubMed] [Google Scholar]
- 32. Wilson RS, Segawa E, Buchman AS, Boyle PA, Hizel LP, Bennett DA. Terminal decline in motor function. Psych Aging. 2012;4:988–1007. [DOI] [PMC free article] [PubMed] [Google Scholar]
- 33. Bennett DA, Wilson RS, Boyle PA, Buchman AS, Schneider JA. Relation of neuropathology to cognition in persons without cognitive impairment. Ann Neurol. 2012;72:599–609. [DOI] [PMC free article] [PubMed] [Google Scholar]
- 34. Buchman AS, Yu L, Boyle PA, et al. Microvascular brain pathology and late-life motor impairment. Neurology. 2013;80:712–718. [DOI] [PMC free article] [PubMed] [Google Scholar]
- 35. Wilson RS, Boyle PA, Levine SR, et al. Emotional neglect in childhood and cerebral infarction in older age. Neurology. 2012;79:1534–1539. [DOI] [PMC free article] [PubMed] [Google Scholar]
- 36. Rosso AL, Studenski SA, Chen WG, et al. Aging, the central nervous system, and mobility. J Gerontol A Biol Sci Med Sci. 2013;68:1379–1386. [DOI] [PMC free article] [PubMed] [Google Scholar]
Associated Data
This section collects any data citations, data availability statements, or supplementary materials included in this article.