

Abstract
Motivation: Functional relationship networks, which summarize the probability of co-functionality between any two genes in the genome, could complement the reductionist focus of modern biology for understanding diverse biological processes in an organism. One major limitation of the current networks is that they are static, while one might expect functional relationships to consistently reprogram during the differentiation of a cell lineage. To address this potential limitation, we developed a novel algorithm that leverages both differentiation stage-specific expression data and large-scale heterogeneous functional genomic data to model such dynamic changes. We then applied this algorithm to the time-course RNA-Seq data we collected for ex vivo human erythroid cell differentiation.
Results: Through computational cross-validation and literature validation, we show that the resulting networks correctly predict the (de)-activated functional connections between genes during erythropoiesis. We identified known critical genes, such as HBD and GATA1, and functional connections during erythropoiesis using these dynamic networks, while the traditional static network was not able to provide such information. Furthermore, by comparing the static and the dynamic networks, we identified novel genes (such as OSBP2 and PDZK1IP1) that are potential drivers of erythroid cell differentiation. This novel method of modeling dynamic networks is applicable to other differentiation processes where time-course genome-scale expression data are available, and should assist in generating greater understanding of the functional dynamics at play across the genome during development.
Availability and implementation: The network described in this article is available at http://guanlab.ccmb.med.umich.edu/stageSpecificNetwork.
Contact: gyuanfan@umich.edu or engel@umich.edu
Supplementary information: Supplementary data are available at Bioinformatics online.
1 INTRODUCTION
Functional relationship networks offer a potentially critical complement to the reductionist focus of modern biology and to our ability to understand and interpret diverse biological processes systematically in an organism. These networks are modeled through integrating heterogeneous large-scale genomic data (Chikina et al., 2009; Guan et al., 2008, 2010, 1012; Huttenhower et al., 2006; Inouye et al., 2012; Lee et al., 2004, 2008, 2011; Park et al., 2013; Peña-Castillo et al., 2008; Pop et al., 2010; Singh-Blom et al., 2013) and they represent the probability of co-functionality between any two genes in the genome. Mining these networks can help us discover gene functions and identify disease/phenotype-associated genes. We have previously modeled the global functional relationship network for the mouse (Guan et al., 2008, 2010) and developed the algorithm that can systematically model tissue-specific networks in mammalian systems (Guan et al., 2012).
Current network models, including the ones we previously established, have one major limitation: a single network is generated without considering the dynamic changes of functional connections, which might be expected to change during the differentiation of any given cell lineage. It should be anticipated that functional connections might consistently evolve, which would allow different cell fates to arise from the same genetic background. It has been widely accepted and modeled that at the co-expression, physical interaction and pathway levels, interactions between genes are constantly changing (Bandyopadhyay et al., 2010; Kim et al., 2012; Park et al., 2003). Motivated by our recently developed method to infer dynamic signaling network responses (Zhu and Guan, 2014) and to classify cell lineage-specific expression patterns (Bethunaickan et al., 2014), we extend our algorithm to integrate heterogeneous datasets for predicting the dynamic co-functionality relationships across a differentiation process.
To capture such dynamics in functional connections, here, we introduce the concept of ‘transitional’ functional relationship networks, which are intended to reveal the activated and deactivated functional relationships between any two stages distinguishable during cell lineage differentiation. The assumption behind this algorithm is that an existing connection in the stationary network is likely to be activated, if both members of a pair of genes become upregulated, and vice versa. However, unlike most of the existing methods that directly map upregulated/downregulated genes to the stationary network (Faith et al., 2007; Langfelder and Horvath, 2008), we reweigh diverse genomic datasets for their relevance to the (de)-activated functional relationships to model such transitional networks for the particular differentiation process under investigation.
Compared with co-expression network approaches such as context likelihood of relatedness (CLR; Faith et al., 2007) and weighted correlation network analysis (WGCNA; Langfelder and Horvath, 2008), this algorithm has the following benefits: (i) It requires only two stage-specific samples, while CLR and WGCNA need a large number of samples. (ii) This algorithm does not use stage-specific dataset to directly calculate co-expression level but to adjust the integration, so its performance is robust to measurement noise in the stage-specific expression data.
We applied this new algorithm to the human erythroid cell differentiation process to establish transitional networks. We collected RNA-seq data at 4, 8, 11 and 14 days after initial induction of erythroid cell differentiation from purified human CD34+ bone marrow progenitor cells to model the (de)-activated networks between any two time points. We found that these networks correctly identify erythroid-specific genes as well as erythropoiesis-related connections, which are not revealed in a static network. Most importantly, we identified novel candidates driving the erythroid cell differentiation process, such as OSBP2 and PDZK1IP1. We expect that this methodology can be applied to model dynamic functional relationship networks for other differentiation processes as well. This network algorithm is publicly available at: http://guanlab.ccmb.med.umich.edu/stageSpecificNetwork.
2 METHODS
Our method of constructing ‘transitional’ networks can be summarized diagrammatically in three steps (Fig. 1): (i) establish a ‘gold standard’ describing functionally related gene pairs that become (de)activated between two time points using existing functional annotation databases and differentiation process-specific expression data; (ii) collect heterogeneous genomic datasets (∼1000 in total) from public databases (Alfarano et al., 2005; Edgar et al., 2002; Ceol et al., 2010; Güldener et al., 2006; Kerrien et al., 2012; Ozier et al., 2003; Stark et al., 2011), including expression profiles, physical and genetic interactions (see complete data description in Supplementary Information S1), and (iii) weigh and integrate them using the transitional stage-specific ‘gold standard’ pairs, and therefore generate networks that cover all genes. Relevant content is available in subsequent sections.
Fig. 1.

Strategy for constructing transitional networks. First, global gold standard pairs are generated from GO, KEGG and BioCyc databases. Then, we collected time-course RNA-seq data from erythroid cell differentiation to identify the upregulated and downregulated genes between any two time points. These gene lists were then used to restrict the global gold standard for the activated/deactivated networks. Around 1000 public genomic datasets such as expression and protein–protein physical and genetic interactions were differentially weighed using the global gold standard and the stage-specific gold standards, respectively, and then integrated through Bayesian networks to generate the global, static network and the transitional networks. Finally, we computationally compared the performance of transitional networks with the traditional static network and validated genes critical to erythroid differentiation
2.1 Genomic data acquisition and pre-processing
We collected heterogeneous functional genomic data as the training data for the Bayesian integration step. All data were converted into pair-wise similarity scores S(i, j), which corresponds to the level of similarity between genes i and j within a dataset.
2.1.1 Expression data
We acquired 1021 human microarray datasets from Gene Expression Omnibus (GEO; Edgar et al., 2002; all of the datasets have no less than three samples) as of March 8, 2013. A list of datasets used in this project can be found in the Supplementary Information S1. For each dataset, Pearson product-moment correlation coefficient, ρ, is calculated to evaluate the level of co-expression between every gene pair. The ρ values were transformed into z-scores using Fisher transformation and then shifted to . This normalization is used to minimize the difference among different datasets and platforms. Pairs that lack information in the dataset under investigation were considered missing. Furthermore, between datasets, mutual information was calculated to reduce the contribution of similar datasets (as described in the next section), which could significantly ameliorate the negative effects of repetitive datasets that often occur in public databases (Huttenhower et al., 2006, 2009).
2.1.2 Interaction data
A total of 28 713 pairs were retrieved from BioGRID (Stark et al., 2011), BIND (Alfarano et al., 2005), DIP (Ozier et al., 2003), IntAct (Kerrien et al., 2012), MINT (Ceol et al., 2010) and MIPS (Güldener et al., 2006) as of April 24, 2013. An interacting pair is assigned with a value of 1. Pairs that do not appear in the interaction datasets are assigned with a value of 0. Protein domain data were not included in the analysis because of its direct overlap with the gold standard retrieved from Gene Ontology (GO).
2.2 Gold standard functionally related pairs
2.2.1 Global, static gold standard
Following the tradition in this field (Guan et al., 2008, 2012; Huttenhower et al., 2006), for the global static network, positive gold standard gene pairs are obtained from several biological datasets: GO (Ashburner et al., 2000) terms, BioCyc (Karp et al., 2005) and Kyoto Encyclopedia of Genes and Genomes (KEGG; Kanehisa et al., 2004) pathways. A gene pair where both genes are annotated to the same specific biological process (GO), or having a direct interaction in BioCyc or KEGG, is considered as a positive pair. GO terms or pathways with >300 annotated genes are excluded to avoid broad biological processes or pathways. As the target of the transitional networks is functional relationships instead of physical interactions, protein–protein interaction data were used as a feature dataset instead of gold standard. A total of 674 098 positive gold standard gene pairs were obtained. Because there is no existing database that defines functional unrelated genes, the negative gold standard was approximated with randomly selected pairs. Based on a prior that ∼5% of gene pairs are functionally related, which is a ratio used in many previous studies (Guan et al., 2008, 2012; Huttenhower et al., 2006), we randomly generate ∼1.2 × 10⁷ negative gold standard pairs.
2.2.2 Stage-specific RNA-Seq for human erythroid cell differentiation
We included purified human CD34+ hematopoietic progenitor cells to differentiate ex vivo under conditions that were previously reported to achieve 1000-fold cell proliferation and nearly synchronous erythroid differentiation (Giarratana et al., 2004; Shi et al., 2013, 2014a and b). This dataset covers four time points, Day 4, 8, 11 and 14, with two biological replicates each. Detailed RNA-Seq protocol could be found in Supplementary Files. The data have been deposited in the NCBI GEO [accession number GSE54602].
2.2.3 Preprocessing RNA-Seq data to identify significantly changed genes between stages
NCBI build 37.2 transcript annotation file was used as the reference genome, and BOWTIE2 indexes were created by bowtie2-build. RNA-Seq data were mapped to NCBI build 37.2 transcript annotation files, using TopHat v2.0.10 and Cufflinks v2.1.1.
After mapping, replicates at the same time point were combined using their average Fragments Per Kilobase of transcript per Million mapped reads (FPKM) values.
We define a significantly changed gene by two criteria: (i) its absolute FPKM value change is >0.1 and (ii) its FPKM fold change is >2.0. We have tested the robustness of this algorithm to the variation of these two cutoffs (see Supplementary Table S1 for the number of differentially regulated genes). We have evaluate the robustness of our method by testing different cutoff, or existing tool (DESeq Anders and Huber (2010)), when determining the significantly changed genes. A similar performance has been observed (Supplementary Figs S6 and S7).
2.2.4 Gold standard for transitional networks
A gold standard pair for the activated network at a particular transitional stage must satisfy two criteria: (i) They must be functionally related in the global sense; (ii) both genes in this pair must be significantly upregulated. Supplementary Table S2 lists the number of positive pairs generated for each network using these two criteria. It shows that, as expected, when erythroid cell differentiation proceeds, the number of significantly differently expressed genes between adjacent stages drops. Based on this table, the first stage, Day 4 to 8, during which the cells were committed to the erythropoiesis fate, contains the strongest signals of differentiation. Similarly, we generated the gold standard positives for the deactivated networks between each pair of stages, requiring that the functionally related pairs must be downregulated together. Owing to the insufficient number of gold standard pairs for Day 8 to Day 11 activation, Day 11 to Day 14 activation and deactivation networks, they are excluded from analysis.
Note that, the positive global gold standard represents only the existing human knowledge, which is not complete. Thus, the intersection of gold standard and the upregulated genes is not complete to represent all important functional relationships in erythropoiesis. Bringing the 1021 genomic datasets, which cover the majority of the genes, allows us to infer a probability, even for the genes which no function has been assigned to in the GO/BioCyc/KEGG databases.
2.3 Bayesian integration
The algorithm used to generate the static and transitional networks is based on Bayesian networks regularized with mutual information. Using this method, different datasets are weighted differently by how well they recover the gold standard pairs. Specifically, the posterior probability of a functional relationship is calculated by integrating all available evidence (Guan et al., 2008, 2012; Huttenhower et al., 2009)
| (1) |
where FR = 1 represents a pair of genes are functionally related globally or at a specific stage, according to the target network, n is the number of datasets, stands for the score for this gene pair in dataset k and Z is a normalization factor (more details regarding caculation of the posterior can be found in Supplementary Files). Prior is arbitrarily assigned with a value of 0.05 as the convention in the functional relationship network field (Guan et al., 2008, 2012; Huttenhower et al., 2009). Intuitively, for genes i, j, the probability ()) denotes how likely, given existing datasets and their accuracy and relevance to the stage under investigation, they participate in the same biological process.
Conditional dependence between input datasets is a major factor affecting the performance of naive Bayesian integration (Guan et al., 2008, 2012; Huttenhower et al., 2009; Pop et al., 2010; Wong et al., 2012) because Equation 1 is valid if and only if all the evidences are conditionally independent. Giving that many biological datasets share information, multiple strategies were used to minimize the effects of information overlap. For physical interactions, as many datasets do not have enough examples to learn a trustable posterior, we combined different data sources into one and removed the duplicate entries in the combined dataset. For gene expression data, which are the major sources of the overlapping information, we calculated α, which represents the ratio of the sum of mutual information between one dataset and all other datasets to the entropy of this dataset.
The probability value is adjusted using mutual information (Guan et al., 2008, 2012; Huttenhower et al., 2009):
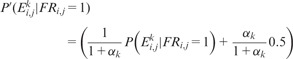 |
(2) |
when the value of αk is small, i.e. microarray dataset k contains highly independent information with other datasets, is the dominating contributor to ; if the value of αk is large, i.e. dataset k contains highly redundant information with others, is close to 0.5 and contributes almost nothing to the final posterior probability.
3 RESULTS
3.1 Top upweighted datasets for activated network between Day 4 and Day 8
We used Bayesian integration regularized with mutual information to weigh and integrate the genomic data together to model these ‘transitional’ networks. Bayesian framework has been used extensively for integrating heterogeneous genomic datasets that differ in nature (Chikina et al., 2009; Guan et al., 2008, 2010, 2012; Huttenhower et al., 2009; Pop et al., 2010; Wong et al., 2012). In the present context, the Bayesian integration can automatically leverage the implicit relationships between datasets and a developmental stage and consequently generate accurate stage-specific networks even from feature data that are not specifically designed for a particular stage of interest. As shown in Table 1, datasets that are relevant to erythroid cell differentiation were automatically assigned greater posterior in our transitional network integration, when compared with the static network integration. The most upweighted dataset for the Day 4 to Day 8 activated network, GDS2431 (Keller et al., 2007), directly measured adult CD34+ hematopoietic progenitor cell differentiation. Other top-weighted datasets, GDS3044, GDS304, GDS1059, GDS1310 and GDS841, were obtained from cord blood cells, leukemia cells or peripheral blood cells. They are likely to indirectly reflect the erythroid cell differentiation process. Furthermore, the reliability of each dataset is also automatically taken into consideration using the Bayesian network classifier trained on the gold standard from GO (Ashburner et al., 2000), BioCyc (Karp et al., 2005) and KEGG (Kanehisa et al., 2004) analysis. Therefore, a dataset that is both highly relevant to the target stage and of high quality will be given greater weight. Using this method, we generated networks representing the activated and deactivated functional relationships between Days 4/8, 8/11, 4/11 and 4/14 during erythroid cell differentiation (networks for activated Day 8 to Day 11 and Day 11 to Day 14 were excluded because of the small number of differentially regulated genes).
Table 1.
Top upweighted expression datasets for the activated network between Day 4 and Day 8
| GDS2431 | Title: Erythroid differentiation in vitro: time course |
| Analysis of adult differentiating CD34+ hematopoietic progenitor cells at various time points up to 11 days of growth in serum-free medium containing erythropoietin, interleukin-3 and stem cell factor. Results provide insight into the molecular basis of erythropoiesis. | |
| GDS3044/ | Title: Imatinib effect on K562 leukemia cell line (III)/(IV) |
| GDS3045 | Summary: Analysis of K562 leukemia cells treated with 1 uM imatinib for 24 h. Results provide insight into molecular mechanisms underlying BCR/ABL1-mediated leukemogenesis. |
| GDS1059 | Title: Acute myeloid leukemia response to chemotherapy |
| Summary: Analysis of mononuclear cells from 54 chemotherapy treated patients <15 years of age with AML. | |
| Mononuclear cells taken from peripheral blood or bone marrow. | |
| GDS1310 | Title: Neonatal mononuclear cell response to lipopolysaccharide |
| Analysis of neonatal mononuclear cells from cord blood incubated with 5 ug/ml lipopolysaccharide (LPS). Effect of LPS on adult mononuclear cells from peripheral blood compared. Results provide insight into the molecular basis for increased susceptibility of neonates to sepsis. | |
| GDS841 | Title: Adult acute myeloid leukemia: bone marrow and peripheral blood expression profiles |
| Summary: Part of a study profiling 54 bone marrow and 65 peripheral blood samples from 116 adults with AML. | |
| Results identify distinct gene expression signatures that correlate with clinical outcomes. Signatures used to construct a clinical outcome predictor using 133 genes. | |
Note. This table shows the datasets that are automatically determined to be most related to erythroid differentiation. Co-expressed genes in these datasets will be automatically assigned a higher posterior (See Supplementary Material for more details).
3.2 Cross-validation shows that the transitional networks are accurate for predicting stage-specific activated and deactivated functional relationships
We performed cross-validation to computationally evaluate the ability of the transitional networks to identify activated and deactivated functional relationships between two differentiation stages. That is, for each transitional network, only part of the gold standard is used to establish the model, while the rest part of gold standard, which can not be seen during the model training, is used to validate the prediction. Our assumption was that when we examine the genes that are upregulated and co-functional as the test set, the model for the activated network should perform better than the models for static networks. To prevent contamination in cross-validation, the gold standard was split into two disjoint graphs, with one serving as the training set and the other as the test set. A static network Guan et al. (2008), which represents the global functional relationship network generated without cell lineage specificity information, has been used for comparison.
We found that improvement is consistently recorded by these transitional networks compared with the static network (Fig. 2 and Table 2). For example, the Day 4/8 activated network had an area under the receiver operating characteristic curve (AUC) of 0.739, whereas the static network had an AUC of 0.650 using the same test set, which is a 59% improvement in AUC over the random baseline (0.5). Such improvement is consistent across the entire precision-recall spectrum (Fig. 2c–d). Similarly, compared with the static network, the Day 4/8 network had an AUC improved from 0.628 (static) to 0.719 (transitional), thus representing a 71% improvement in AUC. Such improvement was observed for all activated and deactivated networks across all pairs of stages.
Fig. 2.

Transitional networks are more accurate than the static network in capturing the dynamic functional connections between erythroid cell differentiation stages. This figure shows the cross-validation performance of the models for activated, deactivated and static networks for Day 4 to Day 8, evaluated against the upregulated gold standard (a and c) or downregulated gold standard (b and d). The evaluation results indicate that the models for the transitional networks performed better than the static network in predicting their respective activated and deactivated functional connections
Table 2.
AUC and AUPRC for transitional networks and the static network
| Stage | AUC (baseline = 0.5) | AUPRC (baseline = 0.05) |
|---|---|---|
| Day 4 to Day 8 activation | 0.739 | 0.112 |
| Day 4 to Day 8 deactivation | 0.719 | 0.155 |
| Day 8 to Day 11 deactivation | 0.776 | 0.184 |
| Day 4 to Day 11 activation | 0.709 | 0.104 |
| Day 4 to Day 11 deactivation | 0.706 | 0.118 |
| Day 4 to Day 14 activation | 0.734 | 0.095 |
| Day 4 to Day 14 deactivation | 0.666 | 0.077 |
| Average performance for the static network | 0.666 | 0.086 |
| Average performance for the transitional networks | 0.721 ± 0.034 | 0.121 ± 0.037 |
| Average improvement over the static network | 33% ± 20% | 96% ± 102% |
On average, the AUC of the static network evaluated against the activated/deactivated gold standards is 0.666 and the Area Under Precision Recall Curve (AUPRC) is 0.077, while the transitional networks achieved an average AUC of 0.721 (±0.034, median value = 0.719) and AUPRC of 0.121 (±0.037, median value = 0.112; Table 2). Evaluation results of receiver operating characteristic curves and precision recall curves are available in Supplementary Figures S1–S4. The consistent improvement by application of the transitional network algorithms demonstrates the robust performance of this algorithm and implies that these networks can correctly reveal the dynamic functional connections during erythroid cell differentiation.
Because progenitor cells are fully committed to the erythroid fate between days 4/8, during which the majority of the network rewiring occurs, the following discussion focuses on the networks generated at this transitional stage.
3.3 Validation of the transitional network using critical gene pairs and genes during erythropoiesis
These new transitional networks are able to identify functional relationships that are activated at specific stages. Our experience on well-studied gene pairs is valuable to assess the quality of the networks. To identify the erythoid-specific gene from the transitional networks, we first acquired a gene list of genes with specific and essential roles in erythrocyte physiology [100 genes from Hembase Goh et al. (2004) and 10 well-known erythroid-related transcriptional factor, the full gene list is available in Supplementary Information S3]. Then for every gene in the genome, the average connection strength between this gene and 110 of the known erythroid-related genes is calculated, for the global network and Day 4 to Day 8 activation network, respectively. Genes with larger connection strengths in activation network than global network are considered as erythroid-specific genes. The top 100 significantly changed (erythroid-specific) genes are listed in Supplementary Information S2. All biological examples and novel genes are mentioned below are selected from the list. Genes in Table 3, for example, are well-studied erythroid-specific genes and are expected to function together as erythroid cells differentiate. Hemoglobin beta (HBB; Fig. 3a and b) has co-function probabilities of only 0.141 and 0.121 with Hemoglobin alpha 1 and 2 (HBA1 and HBA2) in the static network. These probabilities increased to 0.618 and 0.974, respectively, in the Day 4 to Day 8 activated network (Table 3 and Fig. 3b). This astonishing disparity between the two models implies that the activated relationships like HBA2–HBB, which are not apparent in the static network, can be readily identified in the transitional networks with high confidence. Table 3 lists some other functional connections between important genes that directly participate in erythroid cell differentiation, in both the static and the Day 4 to Day 8 activated networks.
Table 3.
Probabilities of functional relationships between critical genes for erythropoiesis in the Day 4 to Day 8 activated network and in the static network
| Gene A | Gene B | Day 4 to Day 8 activated network | the static network |
|---|---|---|---|
| HBA1 | HBA2 | 0.315 | 0.167 |
| HBA1 | HBB | 0.618 | 0.141 |
| HBA2 | HBB | 0.974 | 0.121 |
| HBA1 | HBD | 0.089 | 0.066 |
| HBA2 | HBD | 0.073 | 0.056 |
| HBB | GYPA | 0.137 | 0.003 |
| HBD | GYPA | 0.923 | 0.005 |
| HBB | GYPB | 0.998 | 0.074 |
| HBB | GYPC | 0.632 | 0.041 |
| HBD | GYPB | 0.966 | 0.021 |
| HBD | GYPC | 0.742 | 0.038 |
Fig. 3.

Local Networks of HBB, HBD, GATA1, ANK1, IL2RA and FLT3 reveal functional connections that are critical to erythroid differentiation. Compared with the static network (a, c, e and g), the local activated networks for HBB (b), HBD (d), GATA1 (f) and ANK1 (h) are much more densely connected and enriched for genes that are critical to the erythroid cell differentiation process. IL2RA and FLT3 are highly connected to many downregulated genes in the deactivated network (i–l), implying that their biological functions are shut down during erythroid cell differentiation
The local topology of the transitional stage-specific network is informative for identifying individual genes that are important for erythropoiesis. Figure 3c and d shows an example when using this network to query gene HBD. In the global static network, HBD has only seven neighbors with connections and the probabilities of most of its functional relationships are <0.2. This result indicates that the overall connectivity level of HBD is low in the static sense (Fig. 3c). In the Day 4 to Day 8 activated network, 13 genes had connection probabilities of >0.8 with HBD (Fig. 3d). This strong connectivity implies that HBD is a stage-specific gene that is intimately associated with erythroid differentiation. Additionally, this local network of HBD is significantly enriched for erythrocyte differentiation-related processes (GO:0043249, GO:0030218, GO:0034101 and GO:0048821; Table 4), while no enrichment was found in the static network for this gene. These observations strongly support the effectiveness of the stage-specific networks in identifying genes that are central to erythroid differentiation and the accuracy of those networks. To intuitively show how much edges differ between the transitional networks and the static network, we implemented a web-based interface to visualize the prediction results at http://guanlab.ccmb.med.umich.edu/stageSpecificNetwork.
Table 4.
Top enriched GO terms for HBD in the Day 4 to Day 8 activated networks
| Day 4 to Day 8 activated network | ||
|---|---|---|
| GO ID | GO term | Bonferroni-corrected P-value |
| GO:0065008 | Regulation of biological quality | 1.02e-10 |
| GO:0043249 | Erythrocyte maturation | 1.27e-6 |
| GO:0030218 | Erythrocyte differentiation | 3.86e-6 |
| GO:0034101 | Erythrocyte homeostasis | 6.05e-6 |
| GO:0002262 | Myeloid cell homeostasis | 1.67e-5 |
| GO:0048821 | Erythrocyte development | 2.78e-5 |
| GO:0061515 | Myeloid cell development | 5.67e-5 |
| GO:0030099 | Myeloid cell differentiation | 8.29e-5 |
Inspired by the transitional network for HBD, we further examined several well-known erythroid-specific genes by comparing the Day 4 to Day 8 activated network with the static network. For example, erythroid master regulator GATA1 [reviewed in (Cantor and Orkin, 2002; Crispino, 2005; Ferreira et al., 2005)] plays essential roles in erythroid lineage commitment (Kitajima et al., 2006) and in erythroid terminal maturation (Pevny et al., 1991). In the present analysis, we observed that the static network of GATA1 is not enriched for any biological process specific to erythropoiesis, while in the transitional network, GATA1 is closely connected with other well-known erythroid genes such as GYPB, ANK1 and ALAS2 (Fig. 3e and f). Thus, the transitional network faithfully reflects the physiological roles of GATA1 in erythroid cells. Among them, one close neighbor of GATA1 was KLF1, with a connection strength of 0.76. KLF1’s expression is restricted to erythroid cells, and it is directly involved in multiple steps during erythroid differentiation (Tallack et al., 2010), including activating β-globin transcription (Dang et al., 2000) as well as maintaining the membrane stability of erythroid cells and globin homeostasis (Funnell et al., 2007). Again, the function of KLF1 is successfully predicted by the transitional network. In the transitional activated network, KLF1 is connected to genes that are enriched for myeloid/erythroid differentiation (P = 0.02/0.01, respectively), with an average connectivity strength (of the top 25 neighbors) of 0.74, compared with 0.09 in the static network. Another example is ANK1 (Fig. 3g and h), an erythroid membrane anchoring protein, which links spectrin tetramers to the transmembrane protein band 3 and RhAG to link the membrane and the erythroid cytoskeleton (Bennett, 1978; Huang et al., 2013; Nicolas et al., 2003), and comprises the key determinant that maintains the membrane elasticity of red blood cells. Here, the functional connection between ANK1 and spectrin (SPTA1) in the activated network was 0.84, while their connection is much weaker in the static network (0.002), indicating that this activated network algorithm correctly predicts erythroid-specific functional relationships.
In addition to evaluating the transitional networks that verify well-established erythroid genes, we also investigated the genes whose connectivity strengths changed most in the transitional networks (both activated and deactivated networks) over the global, static network. For example, interleukin 2 receptor alpha (IL2RA, Fig. 3i and j) showed a difference of connectivity strength (of the top 25 neighbors) of ∼0.93 between the Day 4 to Day 8 deactivated network and the static network. The most closely related neighbors of IL2RA were enriched for T-cell activation (P = ) and immune system process (P = ), suggesting that genes involved in non-erythroid lineage differentiation become repressed during erythroid differentiation. FLT3 (fms-related tyrosine kinase 3) is another significantly altered gene predicted by the deactivated network compared with the static network (Fig. 3k and l). Previous studies reported that this gene is expressed exclusively in the CD34+ early progenitor cells and that mutations in this gene were related to acute myelogenous leukemia (AML), B-precursor cell acute lymphoblastic leukemia (ALL), T-cell ALL and chronic myelogenous leukemia (CML) in lymphoid blast crisis (Drexler et al., 1996; Rosnet et al., 1996). From Day 4 to Day 8, during which time differentiating CD34+ cells become fully committed to the erythroid lineage, the transcription of FLT3 is silenced (FPKM expression level reduced from 3.6 to 0.3). Predictably from this transitional deactivated network algorithm, loss of FLT3 expression was strongly correlated with other downregulated genes, many of which are involved in leukocyte activation and lymphocyte activation-related processes.
3.4 Transitional networks predict novel candidate genes important for erythroid differentiation
Novel genes predicted by this new stage-specific transitional network model that execute previously unknown erythroid-specific functions, by definition, potentially are more important and interesting. Genes, whose co-function probabilities with other genes changed dramatically between static network and transitional network, are extremely likely to be erythroid-specific genes (see Supplementary Information S2 for top 100 changed genes). One such candidate is oxysterol binding protein 2 (OSBP2), which is involved in lipid and glucose metabolism (Hynynen et al., 2009) and cancer cell proliferation and survival [reviewed in (Weber-Boyvat et al., 2013)], including CML (Henriques Silva et al., 2003). In CML, OSBP2 maintains the undifferentiated state of the CML blast cells (Henriques Silva et al., 2003). Additionally, OSBP2 is associated with hematopoietic stem cell long-term proliferation and self-renewal as one of the immediate targets of STAT5 (Fatrai et al., 2011). However, the roles that OSBP2 might play in normal erythropoiesis are still largely unknown. From the Day 4 to Day 8 activated network analysis (Fig. 4b), we predict that OSBP2 might play important roles during erythropoiesis, resulting from its strong connection with TAL1, GATA1, GYPB, AHSP and other erythroid-specific genes.
Fig. 4.

Transitional networks predict novel candidates genes driving erythropoiesis. This figure shows the local networks of OSBP2 and PDZK1IP1. The same color legend as Figure 3 applies here. OSBP2 and PDZK1IP1 are novel candidates for the erythropoiesis, suggested by their local connections to many known genes involved in this process (a–d)
Another interesting candidate emerging from this analysis is PDZK1IP1 (PDZK interacting protein 1), which plays essential roles during megakaryocyte differentiation (Tothova et al., 2007) as well as primitive/definitive erythroid differentiation (Tijssen et al., 2011). However, it remains unclear how PDZK1IP1 might differentially regulate stage-specific erythroid differentiation. We discovered that PDZK1IP1 was upregulated by >21-fold from Day 4 to Day 8 and that it is actively involved in this differentiation process based on this transitional network (Fig. 4d), suggesting that PDZK1IP1 might have unknown functions during erythroid lineage commitment. Although we failed to detect a strong network connection between PDZK1IP1 and TAL1, we note that PDZK1IP1 is located immediately 3′ to TAL1. Additionally, an erythroid enhancer, which regulates TAL1 expression, is embedded 3′ to PDZK1IP1 and conserved throughout vertebrate evolution (Delabesse et al., 2005). Because PDZK1IP1 shares transcriptional enhancer elements with TAL1, a co-regulation between PDZK1IP1 and TAL1 was observed in the dorsal aorta (AGM region) and in the fetal liver of mice, as well as during embryonic stem cell differentiation (Tijssen et al., 2011). In the present study, PDZK1IP1 andTAL1 are coordinately induced (co-regulated) during erythroid differentiation, but they formed completely distinct functional networks, suggesting that PDZK1IP1 might play roles that are unrelated to TAL1 during the Day 4 to Day 8 erythroid differentiation transition. These results suggest that transitional networks are able to successfully predict the functional relationships among genes and would serve as a valuable tool for future analysis of erythropoiesis.
4 CONCLUSION
Systematics in developmental biology is an exciting emerging field, which uses large-scale genomic data to understand the complexity of developmental processes. In this study, we developed a new algorithm that models the dynamic functional relationships during a differentiation process through large-scale data integration. Such networks describe the dependency of functional relationships between two time points. This novel model for transitional networks, is an advance over our previous global (Guan et al., 2008), context-specific (Guan et al., 2010) and tissue-specific networks (Guan et al., 2012), as well as other previously established functional networks (Chikina et al., 2009; Lee et al., 2011; Pop et al., 2010), all of which are static in nature. These transitional networks reveal functional relationships and genes important to erythroid cell differentiation and function, which are not shown in the static networks.
Through the application of Bayesian integration, the approach described here managed to combine diverse genomic datasets, while datasets related to the target stage were assigned stronger weights. The key element determining Bayesian classifier, the gold standard pairs, is refined to a group of gene pairs that are either upregulated or downregulated together across the various developmental stages. Hence, data from relevant contexts are highly weighted and trusted, while irrelevant or inaccurate data are weighted more slightly and less regarded. The results demonstrated that the dynamic stage-specific network algorithm could precisely reveal functional relationships that were masked in analysis of the static networks. The genes that changed most were also confirmed to be highly related to the differentiation process. We expect that this same generic algorithm can be readily applied to other developmental or differentiation processes, given appropriate time-course expression data.
For example, when predicting regulatory networks, classical co-expression–based analyses (Emilsson et al., 2008; Ghazalpour et al., 2006; Zhang et al., 2005) take a single time-course dataset as its only input. These approaches are likely to be sensitive to noise and require a considerable number of different time points in a single dataset. Compared with classical approaches, these transitional networks make use of the highly specific time-course dataset together with thousands of public datasets. We expect that combining the transitional network together with classical co-expression networks should improve the performance of these networks in identifying regulatory elements.
Funding: This work is supported by NIH 1R21NS082212-01, NIH University of Michigan O’Brien Kidney Translational Core Center, AHA midwest postdoctoral fellowship N012616, NIH grants R21 HL114368 and U01 HL117658.
Conflict of interest: none declared.
Supplementary Material
REFERENCES
- Alfarano C, et al. The biomolecular interaction network database and related tools 2005 update. Nucleic Acids Res. 2005;33:D418–D424. doi: 10.1093/nar/gki051. [DOI] [PMC free article] [PubMed] [Google Scholar]
- Anders S, Huber W. Differential expression analysis for sequence count data. Genome Biol. 2010;11:R106. doi: 10.1186/gb-2010-11-10-r106. [DOI] [PMC free article] [PubMed] [Google Scholar]
- Ashburner M, et al. Gene ontology: tool for the unification of biology. Nat. Genet. 2000;25:25–29. doi: 10.1038/75556. [DOI] [PMC free article] [PubMed] [Google Scholar]
- Bandyopadhyay S, et al. Rewiring of genetic networks in response to DNA damage. Science. 2010;330:1385–1389. doi: 10.1126/science.1195618. [DOI] [PMC free article] [PubMed] [Google Scholar]
- Bennett V. Purification of an active proteolytic fragment of the membrane attachment site for human erythrocyte spectrin. J. Biol. Chem. 1978;253:2292–2299. [PubMed] [Google Scholar]
- Bethunaickan R, et al. Identification of stage specific genes associated with lupus nephritis and response to remission induction in NZB/W and NZM2410 mice. Arthritis Rheumatol. 2014;66:2246–2258. doi: 10.1002/art.38679. [DOI] [PMC free article] [PubMed] [Google Scholar]
- Cantor AB, Orkin SH. Transcriptional regulation of erythropoiesis: an affair involving multiple partners. Oncogene. 2002;21:3368–3376. doi: 10.1038/sj.onc.1205326. [DOI] [PubMed] [Google Scholar]
- Ceol A, et al. MINT, the molecular interaction database: 2009 update. Nucleic Acids Res. 2010;38(Suppl. 1):D532–D539. doi: 10.1093/nar/gkp983. [DOI] [PMC free article] [PubMed] [Google Scholar]
- Chikina MD, et al. Global prediction of tissue-specific gene expression and context-dependent gene networks in Caenorhabditis elegans. PLoS Comput. Biol. 2009;5:e1000417. doi: 10.1371/journal.pcbi.1000417. [DOI] [PMC free article] [PubMed] [Google Scholar]
- Crispino JD. GATA1 in normal and malignant hematopoiesis. Semin. Cell Dev. Biol. 2005;16:137–147. doi: 10.1016/j.semcdb.2004.11.002. [DOI] [PubMed] [Google Scholar]
- Dang DT, et al. The biology of the mammalian Krüppel-like family of transcription factors. Int. J. Biochem. Cell Biol. 2000;32:1103–1121. doi: 10.1016/s1357-2725(00)00059-5. [DOI] [PMC free article] [PubMed] [Google Scholar]
- Delabesse E, et al. Transcriptional regulation of the SCL locus: identification of an enhancer that targets the primitive erythroid lineage in vivo. Mol. Cell. Biol. 2005;25:5215–5225. doi: 10.1128/MCB.25.12.5215-5225.2005. [DOI] [PMC free article] [PubMed] [Google Scholar]
- Drexler H, et al. Expression of FLT3 receptor and response to FLT3 ligand by leukemic cells. Leukemia. 1996;10:588–599. [PubMed] [Google Scholar]
- Edgar R, et al. Gene Expression Omnibus: NCBI gene expression and hybridization array data repository. Nucleic Acids Res. 2002;30:207–210. doi: 10.1093/nar/30.1.207. [DOI] [PMC free article] [PubMed] [Google Scholar]
- Emilsson V, et al. Genetics of gene expression and its effect on disease. Nature. 2008;452:423–428. doi: 10.1038/nature06758. [DOI] [PubMed] [Google Scholar]
- Faith JJ, et al. Large-scale mapping and validation of Escherichia coli transcriptional regulation from a compendium of expression profiles. PLoS Biol. 2007;5:e8. doi: 10.1371/journal.pbio.0050008. [DOI] [PMC free article] [PubMed] [Google Scholar]
- Fatrai S, et al. Identification of HIF2α as an important STAT5 target gene in human hematopoietic stem cells. Blood. 2011;117:3320–3330. doi: 10.1182/blood-2010-08-303669. [DOI] [PubMed] [Google Scholar]
- Ferreira R, et al. GATA1 function, a paradigm for transcription factors in hematopoiesis. Mol. Cell. Biol. 2005;25:1215–1227. doi: 10.1128/MCB.25.4.1215-1227.2005. [DOI] [PMC free article] [PubMed] [Google Scholar]
- Funnell AP, et al. Erythroid Krüppel-like factor directly activates the basic Krüppel-like factor gene in erythroid cells. Mol. Cell. Biol. 2007;27:2777–2790. doi: 10.1128/MCB.01658-06. [DOI] [PMC free article] [PubMed] [Google Scholar]
- Ghazalpour A, et al. Integrating genetic and network analysis to characterize genes related to mouse weight. PLoS Genet. 2006;2:e130. doi: 10.1371/journal.pgen.0020130. [DOI] [PMC free article] [PubMed] [Google Scholar]
- Giarratana M-C, et al. Ex vivo generation of fully mature human red blood cells from hematopoietic stem cells. Nat. Biotechnol. 2004;23:69–74. doi: 10.1038/nbt1047. [DOI] [PubMed] [Google Scholar]
- Goh S-H, et al. Hembase: browser and genome portal for hematology and erythroid biology. Nucleic Acids Res. 2004;32(Suppl. 1):D572–D574. doi: 10.1093/nar/gkh129. [DOI] [PMC free article] [PubMed] [Google Scholar]
- Guan Y, et al. A genomewide functional network for the laboratory mouse. PLoS Computat. Biol. 2008;4:e1000165. doi: 10.1371/journal.pcbi.1000165. [DOI] [PMC free article] [PubMed] [Google Scholar]
- Guan Y, et al. Functional genomics complements quantitative genetics in identifying disease-gene associations. PLoS Comput. Biol. 2010;6:e1000991. doi: 10.1371/journal.pcbi.1000991. [DOI] [PMC free article] [PubMed] [Google Scholar]
- Guan Y, et al. Tissue-specific functional networks for prioritizing phenotype and disease genes. PLoS Comput. Biol. 2012;8:e1002694. doi: 10.1371/journal.pcbi.1002694. [DOI] [PMC free article] [PubMed] [Google Scholar]
- Güldener U, et al. MPact: the MIPS protein interaction resource on yeast. Nucleic Acids Res. 2006;34(Suppl. 1):D436–D441. doi: 10.1093/nar/gkj003. [DOI] [PMC free article] [PubMed] [Google Scholar]
- Henriques Silva N, et al. HLM/OSBP2 is expressed in chronic myeloid leukemia. Int. J. Mol. Med. 2003;12:663–666. [PubMed] [Google Scholar]
- Huang H, et al. A deep intronic mutation in the Ankyrin-1 gene causes diminished protein expression resulting in hemolytic anemia in mice. G3 (Bethesda) 2013;3:1687–1695. doi: 10.1534/g3.113.007013. [DOI] [PMC free article] [PubMed] [Google Scholar]
- Huttenhower C, et al. A scalable method for integration and functional analysis of multiple microarray datasets. Bioinformatics. 2006;22:2890–2897. doi: 10.1093/bioinformatics/btl492. [DOI] [PubMed] [Google Scholar]
- Huttenhower C, et al. Exploring the human genome with functional maps. Genome Res. 2009;19:1093–1106. doi: 10.1101/gr.082214.108. [DOI] [PMC free article] [PubMed] [Google Scholar]
- Hynynen R, et al. OSBP-related protein 2 is a sterol receptor on lipid droplets that regulates the metabolism of neutral lipids. J. Lipid Res. 2009;50:1305–1315. doi: 10.1194/jlr.M800661-JLR200. [DOI] [PMC free article] [PubMed] [Google Scholar]
- Inouye M, et al. Novel Loci for metabolic networks and multi-tissue expression studies reveal genes for atherosclerosis. PLoS Genet. 2012;8:e1002907. doi: 10.1371/journal.pgen.1002907. [DOI] [PMC free article] [PubMed] [Google Scholar]
- Kanehisa M, et al. The KEGG resource for deciphering the genome. Nucleic Acids Res. 2004;32(Suppl. 1):D277–D280. doi: 10.1093/nar/gkh063. [DOI] [PMC free article] [PubMed] [Google Scholar]
- Karp PD, et al. Expansion of the BioCyc collection of pathway/genome databases to 160 genomes. Nucleic Acids Res. 2005;33:6083–6089. doi: 10.1093/nar/gki892. [DOI] [PMC free article] [PubMed] [Google Scholar]
- Keller MA, et al. Transcriptional regulatory network analysis of developing human erythroid progenitors reveals patterns of coregulation and potential transcriptional regulators. Physiol. Genom. 2007;28:114–128. doi: 10.1152/physiolgenomics.00055.2006. [DOI] [PubMed] [Google Scholar]
- Kerrien S, et al. The IntAct molecular interaction database in 2012. Nucleic Acids Res. 2012;40:D841–D846. doi: 10.1093/nar/gkr1088. [DOI] [PMC free article] [PubMed] [Google Scholar]
- Kim J, et al. Rewiring of PDZ domain-ligand interaction network contributed to eukaryotic evolution. PLoS Genet. 2012;8:e1002510. doi: 10.1371/journal.pgen.1002510. [DOI] [PMC free article] [PubMed] [Google Scholar]
- Kitajima K, et al. Multipotential differentiation ability of GATA-1-null erythroid-committed cells. Genes Dev. 2006;20:654–659. doi: 10.1101/gad.1378206. [DOI] [PMC free article] [PubMed] [Google Scholar]
- Langfelder P, Horvath S. Wgcna: an R package for weighted correlation network analysis. BMC Bioinformatics. 2008;9:559. doi: 10.1186/1471-2105-9-559. [DOI] [PMC free article] [PubMed] [Google Scholar]
- Lee I, et al. A probabilistic functional network of yeast genes. Science. 2004;306:1555–1558. doi: 10.1126/science.1099511. [DOI] [PubMed] [Google Scholar]
- Lee I, et al. A single gene network accurately predicts phenotypic effects of gene perturbation in Caenorhabditis elegans. Nat. Genet. 2008;40:181–188. doi: 10.1038/ng.2007.70. [DOI] [PMC free article] [PubMed] [Google Scholar]
- Lee I, et al. Prioritizing candidate disease genes by network-based boosting of genome-wide association data. Genome Res. 2011;21:1109–1121. doi: 10.1101/gr.118992.110. [DOI] [PMC free article] [PubMed] [Google Scholar]
- Nicolas V, et al. Rh-RhAG/Ankyrin-R, a new interaction site between the membrane bilayer and the red cell skeleton, is impaired by Rhnull-associated mutation. J. Biol. Chem. 2003;278:25526–25533. doi: 10.1074/jbc.M302816200. [DOI] [PubMed] [Google Scholar]
- Ozier O, et al. Global architecture of genetic interactions on the protein network. Nat. Biotechnol. 2003;21:490–491. doi: 10.1038/nbt0503-490. [DOI] [PubMed] [Google Scholar]
- Park CY, et al. Functional knowledge transfer for high-accuracy prediction of under-studied biological processes. PLoS Comput. Biol. 2013;9:e1002957. doi: 10.1371/journal.pcbi.1002957. [DOI] [PMC free article] [PubMed] [Google Scholar]
- Park S-H, et al. Rewiring MAP kinase pathways using alternative scaffold assembly mechanisms. Science. 2003;299:1061–1064. doi: 10.1126/science.1076979. [DOI] [PubMed] [Google Scholar]
- Peña-Castillo L, et al. A critical assessment of mus musculus gene function prediction using integrated genomic evidence. Genome Biol. 2008;9(Suppl. 1):S2. doi: 10.1186/gb-2008-9-s1-s2. [DOI] [PMC free article] [PubMed] [Google Scholar]
- Pevny L, et al. Erythroid differentiation in chimaeric mice blocked by a targeted mutation in the gene for transcription factor GATA-1. Nature. 1991;349:257–260. doi: 10.1038/349257a0. [DOI] [PubMed] [Google Scholar]
- Pop A, et al. Integrated functional networks of process, tissue, and developmental stage specific interactions in Arabidopsis thaliana. BMC Syst. Biol. 2010;4:180. doi: 10.1186/1752-0509-4-180. [DOI] [PMC free article] [PubMed] [Google Scholar]
- Rosnet O, et al. Human FLT3/FLK2 receptor tyrosine kinase is expressed at the surface of normal and malignant hematopoietic cells. Leukemia. 1996;10:238–248. [PubMed] [Google Scholar]
- Shi L, et al. Lysine-specific demethylase 1 is a therapeutic target for fetal hemoglobin induction. Nat. Med. 2013;19:291–294. doi: 10.1038/nm.3101. [DOI] [PMC free article] [PubMed] [Google Scholar]
- Shi L, et al. Biased, non-equivalent gene-proximal and-distal binding motifs of orphan nuclear receptor TR4 in primary human erythroid cells. PLoS Genet. 2014a;10:e1004339. doi: 10.1371/journal.pgen.1004339. [DOI] [PMC free article] [PubMed] [Google Scholar]
- Shi L, et al. Developmental transcriptome analysis of human erythropoiesis. Hum. Mol. Genet. 2014b;23:4528–4542. doi: 10.1093/hmg/ddu167. [DOI] [PMC free article] [PubMed] [Google Scholar]
- Singh-Blom UM, et al. Prediction and validation of gene-disease associations using methods inspired by social network analyses. PLoS One. 2013;8:e58977. doi: 10.1371/journal.pone.0058977. [DOI] [PMC free article] [PubMed] [Google Scholar]
- Stark C, et al. The BioGRID interaction database: 2011 update. Nucleic Acids Res. 2011;39(Suppl. 1):D698–D704. doi: 10.1093/nar/gkq1116. [DOI] [PMC free article] [PubMed] [Google Scholar]
- Tallack MR, et al. A global role for KLF1 in erythropoiesis revealed by ChIP-seq in primary erythroid cells. Genome Res. 2010;20:1052–1063. doi: 10.1101/gr.106575.110. [DOI] [PMC free article] [PubMed] [Google Scholar]
- Tijssen MR, et al. Genome-wide analysis of simultaneous GATA1/2, RUNX1, FLI1, and SCL binding in megakaryocytes identifies hematopoietic regulators. Dev. Cell. 2011;20:597–609. doi: 10.1016/j.devcel.2011.04.008. [DOI] [PMC free article] [PubMed] [Google Scholar]
- Tothova Z, et al. FoxOs are critical mediators of hematopoietic stem cell resistance to physiologic oxidative stress. Cell. 2007;128:325–339. doi: 10.1016/j.cell.2007.01.003. [DOI] [PubMed] [Google Scholar]
- Weber-Boyvat M, et al. Oxysterol-binding proteins: functions in cell regulation beyond lipid metabolism. Biochem. Pharmacol. 2013;86:89–95. doi: 10.1016/j.bcp.2013.02.016. [DOI] [PubMed] [Google Scholar]
- Wong AK, et al. IMP: a multi-species functional genomics portal for integration, visualization and prediction of protein functions and networks. Nucleic Acids Res. 2012;40:W484–W490. doi: 10.1093/nar/gks458. [DOI] [PMC free article] [PubMed] [Google Scholar]
- Zhang B, et al. A general framework for weighted gene co-expression network analysis. Stat. Appl. Genet. Mol. Biol. 2005;4:1128. doi: 10.2202/1544-6115.1128. [DOI] [PubMed] [Google Scholar]
- Zhu F, Guan Y. Predicting dynamic signaling network response under unseen perturbations. Bioinformatics. 2014;30:2772–2778. doi: 10.1093/bioinformatics/btu382. [DOI] [PMC free article] [PubMed] [Google Scholar]
Associated Data
This section collects any data citations, data availability statements, or supplementary materials included in this article.