

Abstract
Resistance to the lethal effects of cellular stressors, including the toxic heavy metal cadmium (Cd), is characteristic of fibroblast cell lines derived from long-lived bird and rodent species, as well as cell lines from several varieties of long-lived mutant mice. To explore the mechanism of resistance to Cd, we used inductively coupled plasma mass spectroscopy to measure the rate of Cd uptake into primary fibroblasts of 15 rodent species. These data indicate that fibroblasts from long-lived rodent species have slower rates of Cd uptake from the extracellular medium than those from short-lived species. In addition, fibroblasts from short-lived species export more zinc after exposure to extracellular Cd than cells from long-lived species. Lastly, fibroblasts from long-lived rodent species have lower baseline concentrations of two redox-active metals, iron and copper. Our results suggest that evolution of longevity among rodents required adjustment of cellular properties to alter metal homeostasis and to reduce the toxic effects of heavy metals that accumulate over the course of a longer life span.
Key Words: Longevity, Rodents, Cadmium, Zinc, Iron.
Identification of single gene mutations that extend life span in worms, flies, and mice has allowed biogerontologists to test hypotheses about factors that control the rate of aging by looking for biochemical differences among young adults of species that age at different rates. The effects of genetic mutations and dietary manipulations on life span in mammals have, so far, been limited to a maximum of a 50% increase beyond the life span of control groups. In contrast, differences in the rate of aging produced by evolution are five to 10-fold within some orders of mammals and 30- to 100-fold within the class of Mammalia as a whole. Analysis of single gene mutations in Caenorhabditis elegans showed that mutations that lead to increased life span often render the mutant worms more resistant to several forms of lethal stress including heavy metals, ultraviolet radiation, heat, and oxidizing agents (1). These results suggest that resistance to a wide variety of lethal stresses may contribute to the antiaging effect of the mutations. Several studies of skin-derived fibroblasts have demonstrated a correlation between cellular resistance to lethal stress and species life span in rodents (2), birds (3), long-lived mutant mice (4), and mammals (5). Association between lethal stress and life span suggests that resistance to injury may be part of the genetic pathways regulating life span across evolutionary lineages.
Cells from long-lived rodent and bird species (2,3), including the very long-lived rodent naked mole rat (6), are more resistant to death induced by exposure to cadmium (Cd). Cd is a naturally occurring toxic transition metal that accumulates in cells and tissues with no effective mechanism for export. In humans, Cd turns over very slowly, with a half-life of about 20 years (7,8). Cellular Cd accumulation affects the function of many different cellular systems, leading to toxicity. Cd disturbs DNA base excision and mismatch repair, particularly by binding to and inactivating an essential eukaryotic mismatch repair protein, Msh2-Msh6 (9). Cd also suppresses DNA repair and apoptosis and induces cell proliferation by inhibiting the tumor suppressor transcription factor p53 (10). Furthermore, Cd induces stimulation of transcription factors including nuclear factor κB and nuclear factor erythroid-2–related factor 2 (7). Finally, Cd accumulation leads to a rapid buildup of reactive oxygen species (11). Cd is not a redox-active metal, but intracellular Cd disrupts transition metal homeostasis of copper (Cu), manganese (Mn), zinc (Zn) (12–15), and possibly iron (Fe), which may induce formation of reactive oxygen species. Cd has high affinity for metalloproteins and may displace Fe, Cu, Mn, and/or Zn bound to proteins, thus inhibiting vital cellular enzymes and transcription factors and contributing to cell toxicity.
Transition metal homeostasis is regulated by a complex system of transmembrane metal importers and exporters, chaperones, storage proteins, and metal-sensing proteins as well as various transcriptional, translational, and posttranslational regulators (16). Although the detailed mechanisms of metal homeostasis vary from metal to metal, metal transport proteins are, in all cases, important for conveying metals in/out of cells and cellular compartments (17,18). Metal-binding proteins and small molecules buffer the free metal concentrations to decrease the toxicity of transition metals and, for some metal ions, protein chaperones deliver the correct metal ion to protein-binding sites (19–21). Finally, metal-sensing proteins help to regulate the expression of proteins involved in maintaining metal homeostasis (22).
The goal of the current investigation was to develop a biochemical explanation for the observation that fibroblasts from long-lived rodent species are resistant to the lethal effects of Cd (2–4). In principle, resistance might involve constraints on Cd influx, augmentation of Cd removal, internal buffering of Cd ions by chelators or compartmentalization, and/or mechanisms that modulate the toxic effects of Cd, such as turnover and replacement of Cd-damaged macromolecules. In this study, we exposed primary fibroblasts established from 15 rodent species and 1 bat species (summarized in Table 1) to Cd and measured the cellular concentration of Cd, Cu, Fe, Mn, and Zn using inductively coupled plasma mass spectroscopy (ICP-MS) to identify possible mechanisms of Cd resistance in cells from long-lived species. Our data demonstrate that a decreased rate of Cd import is a significant contributor to enhanced Cd resistance in long-lived rodents.
Table 1.
Summary of Species Used in the Study
| Species | Common Name | Life Span (y) | Body Mass (g) | Cd Uptake Rate (nmol/mgprotein/h) |
|---|---|---|---|---|
| Mesocricetus auratus | Golden hamster | 3.9 | 105 | 0.6 |
| Mus musculus | House mouse | 4 | 21 | 2.6±0.8 |
| Microtus pennsylvanicus | Meadow vole | 4 | 49 | 0.9 |
| Sigmodon hispidus | Cotton rat | 5.2 | 185 | 1.2 |
| Arvicanthus niloticus | African grass rat | 6.7 | 110 | 0.4 |
| Peromyscus leucopus | White-footed mouse | 7.9 | 23 | 1.8 |
| Peromyscus maniculatus | Deer mouse | 8.3 | 21 | 1.0±0.2 |
| Tamias striatus | Chipmunk | 9.5 | 96 | 0.7 |
| Tamiasciurus hudsonicus | Red squirrel | 9.8 | 200 | 0.4 |
| Cavia porcelus | Guinea pig | 12 | 728 | 0.08 |
| Octogon degus | Degu | 14 | 235 | 0.6 |
| Sciurus niger | Fox squirrel | 16 | 800 | 0.3±0.05 |
| Chinchilla lanigera | Chinchilla | 17.2 | 643 | 0.4 |
| Castor canadensis | American beaver | 23.4 | 20,250 | 0.4±0.1 |
| Erethizon dorsatum | North American porcupine | 23.4 | 8,600 | 0.3 |
| Myotis lucifugus | Little brown bat | 34 | 10 | 0.3 |
Notes: Body mass and life span data were collected from AnAge Database (36). Cd = cadmium.
Methods
Rodent Fibroblast Cell Lines
Fibroblast cultures were established as previously described in references (2,23). Cd accumulation experiments were done using cells grown from cryopreserved aliquots (second passage cells) in 3% O2 and 5% CO2 at 37 °C. Cells were thawed and placed in 10 mL of complete medium (Dulbecco’s modified Eagle’s medium [DMEM], high glucose variant [4.5 mg/mL], with sodium pyruvate [110 mg/mL], supplemented with 10% heat-inactivated fetal bovine serum and antibiotics [100 U/mL penicillin/streptomycin], and fungizone [0.25 μg/mL]) in 75cm2 flasks at 5 × 10⁵ cells/flask (6.7 × 10³ cells/cm2). The cells were fed on Day 3 (75% replacement) and then subcultured on Day 7 into 175cm2 flasks (P3) at 105 cells/cm2. After 1 week of further proliferation, the cells were expanded until the cell number reached 16 × 106. In most cases, cells were harvested at passage four (ie, two passages after thawing), but for some cell lines an additional one to three subculturings were required to generate the needed number of cells.
Cd Exposure
2 × 10⁶ cells in 12 mL of complete medium were seeded into eight 75cm2 flasks and incubated for 24 hours to allow proper attachment. Cells were then exposed to DMEM, lacking serum and sodium pyruvate but containing 2% bovine serum albumin, for 24 hours, followed by a 6-hour exposure to various doses of Cd in DMEM. Generally, we used doses of 0, 0.1, 0.2, 0.5, 1, 2, 4, and 8 μM CdCl2.
Assessment of Fibroblast Resistance to Cd-Induced Cell Death
Resistance to the lethal effects of Cd was assessed according to the protocol described in references (4,23). A total of 30,000 cells per well were plated onto a 96-well collagen-coated plate in complete medium. After 24 hours, cells were exposed to DMEM, lacking serum and sodium pyruvate but containing 2% bovine serum albumin, for 24 hours, followed by a 6-hour exposure to various doses of Cd in DMEM. Cell survival was determined 18 hours later using WST-1 (Roche Applied Science, Indianapolis, IN). Two cell lines from two different animals were tested for each species except white-footed mouse where one cell line was assayed. Each cell line was assayed in triplicate.
Sample Preparation for ICP-MS
After exposure to Cd, cells were detached from the flask using trypsin at 0.05% with 0.48mM ethylenediaminetetraacetic acid (EDTA; Gibco-Invitrogen, Carlsbad, CA). To verify that EDTA treatment does not remove metals from the cells we detached the cells with 0.25% trypsin (Gibco-Invitrogen) containing no EDTA as well (Supplementary Figure 3A). Cells detached with trypsin at 0.25% containing no EDTA are shown in red and green. Blue symbols show cells detached with trypsin at 0.05% with 0.48mM EDTA. Trypsinized cells were collected by centrifugation at 200g for 5 minutes. Cells were washed with 1.5 mL of 150mM ammonium bicarbonate (Sigma-Aldrich, St. Louis, MO) and collected by centrifugation at 200g for 5 minutes. A 1.5M solution of ammonium bicarbonate was treated with Chelex resin (Biorad, Hercules, CA) to remove metal contamination prior to use. The cell pellet was suspended in 125 μL of 1% Tween 20 (Sigma-Aldrich) and flash frozen in liquid nitrogen within 45 minutes. This procedure was done with four samples in parallel. In the next step, samples were thawed at room temperature and protein concentration was measured using a BCA assay kit (Pierce-Thermo Fisher, Rockford, IL). The cell survival was calculated from the ratio of protein in the cell culture lysate of cells treated with Cd to those not exposed to Cd (data not shown). Finally, 85 μL of concentrated nitric acid was added to the remaining sample and the sample was incubated at 65 °C for 2 hours followed by measurement of nucleic acid absorption at 264nm using a Cary 100 Bio spectrophotometer (Varian, Palo Alto, CA).
Inductively coupled plasma mass spectroscopy
Concentrations of Cd, Mn, nickel, cobalt, Cu, Fe, and Zn were analyzed in primary fibroblast lysates using an ICP-MS instrument, Element 2 (Thermo Fisher, West Palm Beach, FL). Prior to analysis, indium was added to the nitric acid solution as an internal standard. Cd, Mn, nickel, cobalt, Cu, Fe, and Zn calibration standards were prepared at a concentration of 100 ppb.
Data Processing and Statistical Analysis
Kinetic parameters for Cd uptake were determined from the linear increase in intracellular Cd upon incubation with Cd in the medium (0–4 μM CdCl2). Data above 4 μM CdCl2 in the medium were measured only in few species. The concentration of Cd needed to kill 50% of the cells (LD50) was calculated using the Excel function FORECAST that predicts values based on known values using linear regression. Two Cd concentrations closest to LD50 were used to calculate the Cd LD50.
To compare interspecies metal analysis, samples were normalized to the protein concentration in cell lysates. To identify an outlier in protein concentration within a single cell line, the nucleic acid absorption was estimated as well. We observed that the ratio between the protein concentration and nucleic acid absorption was constant within a single cell line. Outliers were identified and removed from analysis if the ratio between protein concentration and nucleic acid absorption significantly deviated (>50%) from a constant value.
Standard linear regression was used to analyze the association between life span, Cd uptake rate, LD50, and cellular metal concentration using GraphPad (GraphPad Software, Inc., La Jolla, CA). The CORR procedure in SAS (SAS Institute Inc., Cary, NC) was used to analyze the association between Cd uptake rate, cellular metal concentration, and LD50 adjusted for maximal life span.
To evaluate the potential relationship between body mass and Cd uptake rate, LD50, and cellular metal concentrations we used two methods. First, we plotted residuals of standard linear regression of species body mass versus maximal life span against residuals of standard linear regression of Cd uptake rate, LD50, and cellular metal concentrations versus species body mass. Then, we calculated the associations using standard linear regression. The associations between Cd uptake rate, cellular metal concentration, and life span were adjusted for body mass using the CORR procedure in SAS. In a separate analysis, we used a standardized contrast analysis (24). The phylogenetic tree used for this standardized contrast procedure was built using information in references (25–32).
Results
To identify possible mechanisms of Cd resistance in long-lived species, we measured intracellular metal concentrations after exposure to Cd. We first measured Cd uptake into fibroblasts over the course of a 10-hour period to evaluate the linearity of uptake. Fibroblast cultures from two Cd-sensitive, short-lived rodent species (mouse and white-footed mouse) and two Cd-resistant long-lived species (beaver and fox squirrel) were exposed to 2 μM Cd for 0, 1, 2, 4, 6, 8, and 10 hours. Concentrations of cellular Cd were measured using ICP-MS. The data in Supplementary Figure 1 show that: (i) cellular uptake of Cd is linear over time, in all four rodent species, for at least 6 hours; (ii) Cd accumulates indicating that import rates are higher than export rates; (iii) regulation of Cd import and export is minimal within the first 6 hours of incubation in Cd-containing medium since the increase is linear; and (iv) loosely bound extracellular Cd has been removed from the cell pellet prior to lysate preparation and analysis since Cd extrapolates to zero at the start of the incubation. Assuming that the intracellular protein concentration is ~200mg/mL (33), a Cd concentration of 10 nmol/mg protein, as measured for the mouse cell line at 6 hours, would correspond to a cellular Cd concentration of 2mM which is almost 10-fold higher than the baseline cellular concentration of Zn of 0.3mM (Supplementary Figure 5). The linearity of import also indicates that the cellular Cd capacity is not depleted in the 6-hour time period. Primary fibroblasts from mouse and white-footed mouse accumulate four to sixfold more Cd than cells from beaver and fox squirrel, suggesting an association between species life span and cellular Cd uptake, explored more fully below.
Cd is not essential for cell growth, and there is no evidence for plasma membrane transport mechanisms that are specific for Cd uptake. Fujishiro and colleagues (34) have shown that cellular Cd export is minimal in cultures of SV40-transformed mouse embryonic cells, at least partly due to the high affinity of Cd for cellular protein thiols (35). To test whether the differences in Cd accumulation among cell lines (shown in Supplementary Figure 1) reflect variation in Cd export, we measured cellular export of Cd from fox squirrel fibroblasts, which had the least Cd accumulation of the four species tested. If Cd accumulation is influenced by Cd export, we would expect to see reduced levels of cellular Cd in fibroblasts upon removal of Cd from medium. Fox squirrel cells were incubated in 2 μM Cd in DMEM for 6 hours followed by incubation in DMEM (Supplementary Figure 2). The cellular Cd concentration does not decrease in the 4 hours after removal from Cd-containing medium, indicating that Cd export is negligible and suggesting that differences among cell lines in Cd accumulation represent variation in Cd import.
Rate of Cd Uptake Correlates With Rodent Life Span
To provide a general test of the association between species life span and the rate of Cd import into fibroblasts, we measured the metal content of primary fibroblast cell lines from 11 additional rodent species exposed to 2 μM Cd for 6 hours. Table 1 lists the 15 rodent species tested, with life span, body mass measurements, and Cd uptake rates, along with the one bat species evaluated in parallel. Maximal life span and species weight were excerpted from the AnAge Database of Animal Ageing and Longevity (36). Figure 1 illustrates the correlation between the rate of cellular Cd uptake and rodent species life span (p value = .037). The data show that cells from short-lived rodent species accumulate more cellular Cd than cells from long-lived species. Bat fibroblasts resembled cells from long-lived rodents with a rate of Cd uptake of 0.34 nmol/mg protein/hour (data not shown), consistent with their long life span and cellular resistance to Cd toxicity (2). Cellular Cd was normalized to cellular protein concentration as is standard in the literature (37,38).
Figure 1.

Rate of cadmium uptake correlates with species longevity. Cells were incubated for 6h at 2 μM CdCl2 in Dulbecco’s modified Eagle’s medium prior to cadmium estimation. Error bars indicate the standard error of the mean from different animals of the same species: N = 2 for mouse, deer mouse and beaver, and N = 3 for fox squirrel. The regression line, and R 2 and p values represent results of standard linear regression. For clarity, the symbol for porcupine is displaced by 1 y (22.4 instead 23.4) to discriminate it from the symbol for the beaver. The symbols for meadow vole and golden hamster are, for the same reason, displayed with life span of 4.5 and 3.5 y instead of 4 and 3.9 y, respectively. The identical adjustment to displayed species life span is used in all of the following figures.
Reproducibility of the Data
To evaluate the sensitivity of these results to replication and culture history, we measured the metal content of fibroblasts from three species (white-footed mouse, mouse, and fox squirrel, shown respectively in Supplementary Figure 3A–C) under various conditions. Each panel shows the cellular concentration of Fe, Cu, Mn, Zn, and Cd, measured after a 6-hour exposure to Cd. Cells from the white-footed mouse were derived from replicate cryopreserved aliquots from the same donor, collected for metal analysis on two consecutive days (red and green symbols), as well as in cells subjected to one additional subculture (blue symbols). Cells from the mouse were derived from four different cryopreserved aliquots from the same donor analyzed within 15 months. Cells from the fox squirrel were derived from three different cryopreserved aliquots from different donors analyzed within 8 months. The data for all three species show good internal agreement, demonstrating that variation among species is much greater than variations due to technical factors and passage history.
Decrease of Cellular Zn Concentration in Primary Rodent Fibroblasts After Cd Exposure Is Associated With Rodent Species Life Span
Exposure of primary fibroblasts to Cd leads to export of 10%–80% of the total cellular Zn over the 6-hour incubation period with little change in other cellular transition metals (ie, Fe, Cu, Supplementary Figure 3). Figure 2 illustrates the association of Cd-induced Zn export with species life span. Figure 2A shows that the difference (ΔZn) between the initial cellular Zn concentration ([Zn]i) and the cellular Zn concentration measured after exposure to Cd ([Zn]Cd) is a function of maximal life span (p value = .036). Because [Zn]i concentrations vary substantially among rodent species (see Supplementary Figure 5), we also plotted the fraction of exported cellular Zn (([Zn]i − [Zn]Cd)/[Zn]i) against maximal rodent life span in Figure 2B (p value = .010). The latter approach, based on the fraction of exported cellular Zn, has a significant advantage over the ΔZn value because it is independent of the amount of cellular protein and, therefore, cell volume. Linear regression analysis of Figure 2 indicates that both ΔZn and the fraction of Zn exported upon Cd exposure correlate with rodent longevity. Cells from short-lived rodent species export more Zn than long-lived species, consistent with the higher levels of Cd imported into the cells from short-lived rodents. Figure 3 illustrates this relationship directly, showing the strong negative correlation between the rate of Cd uptake and the fraction of retained Zn in this set of cell lines.
Figure 2.
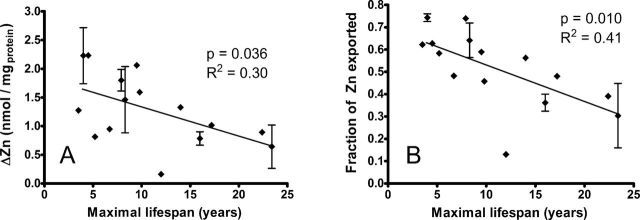
Cadmium-induced decline in cellular zinc (Zn) concentration correlates with rodent life span. (A) Change in Zn calculated as [Zn] after 6h in cadmium ([Zn]Cd) minus [Zn] prior to cadmium exposure ([Zn]i). (B) The fraction of Zn exported from the cell during 6-h exposure to 2 μM CdCl2, calculated as: ([Zn]i − [Zn]Cd)/[Zn]Cd. Error bars indicate standard error of the mean for cell lines established from different animals of the same species. Pearson R 2 and p values reflect linear regression of maximum life span against mean ΔZn (A) and exported Zn (B).
Figure 3.

Rate of cadmium uptake correlates with zinc export. Each symbol represents a different rodent species, and error bars represent standard error of the mean for tests performed on multiple animals of the same species. Open diamonds show species with life span up to 6 y; stars show species with life span 6–12 y, and closed diamonds indicate species with life span over 12 y.
Assessment of Transporter Kinetic Parameters
The association of high Cd uptake with shorter life span might, in principle, involve changes in the number of transporters or the kinetic properties of the transporters. To investigate the transporter kinetics, we measured the amount of Cd imported into rodent primary fibroblasts after a 6-hour incubation as a function of the Cd concentration (0–4 μM). Since Cd import is linear during this time period (Supplementary Figure 1), these data reflect the rate of Cd import. A hyperbolic dependence of the Cd import rate on the Cd concentration was observed (Supplementary Figure 3) and the Michealis–Menten equation was fit to these data, providing values for maximal rate (V max), V max/K M, and K M. Although the K M values vary over a range of ~10-fold among the tested species (Figure 4A), there is no linear correlation between the K M value and the maximal species life span (p = .5). We conclude that the differences in the rates of Cd uptake among primary fibroblasts from different rodent species are not simply attributable to differences in the apparent affinity (K M) for Cd of the plasma membrane Cd importers. For two species, K M is above 0.8 μM Cd concentration. This means that the Cd uptake rates measured at 2 μM Cd (Figure 1) do not reflect the maximum Cd uptake rate for cells from all of the species. The V max value, reflecting the uptake rate at saturating Cd, corrects for the observed differences in K M. Linear regression analysis of the dependence of V max on species maximal life span shows a modest correlation with a p value of .054 (Figure 4B).
Figure 4.
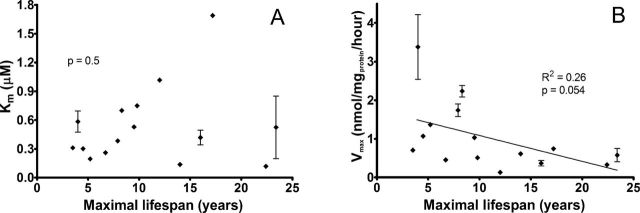
Apparent binding affinity for cadmium transporters is not related to maximal life span in rodents. Each plot shows the calculated values of the Michaelis–Menten coefficient K M (A) and maximum rate of cadmium uptake V max (B) plotted against maximal life span. Both K M and V max values were calculated from the fit of the Michaelis–Menten equation to the dependence of the rate of cellular cadmium uptake on the cadmium concentration in the medium for each species and cell line. Error bars indicate standard error of the mean calculated from average K M and V max values of primary cell lines established from different animals of the same species. Plots also show the results of linear regression.
Fe and Cu Concentrations Correlate With Life Span
The ICP-MS analysis also provides the concentration of other transition metals, including Fe, Mn, and Cu. Nickel and cobalt concentrations are below the detection limit for most of the rodent species examined and are therefore not reported. The data shown in Supplementary Figure 3 suggest that cellular Fe and Cu concentrations show little or no change after Cd exposure. Supplementary Figure 4 summarizes the changes in Cu and Fe concentrations in primary fibroblasts after a 6-hour exposure to Cd, calculated as the slopes obtained from a linear regression of the cellular Fe (top) and Cu (bottom) concentration as a function of extracellular Cd. Despite some variability, the slopes cluster near zero, suggesting that neither the total cellular Fe nor Cu concentration is sensitive to Cd influx over the time interval studied. The cellular concentration of Mn is reduced after Cd exposure by up to 50% and 30% in short- and long-lived rodents, respectively, but there is no significant linear correlation (p = .081) between the fraction of Mn retained and the maximal species life span (data not shown).
To evaluate whether there is a systematic association between cellular Cu or Fe levels and life span, we measured these metal concentrations in cells exposed to serum-free medium in the absence of added Cd. Although the associations do not reach the traditional significance criterion of p value = .05, there is in each case a suggestion (Figure 5) that cells from long-lived species tend to have lower levels of both Cu and Fe, with p values of .067 and .056, respectively. In contrast, there was no relationship between longevity and baseline concentrations of cellular Mn or Zn (Supplementary Figure 5; p values = .7 and .4, respectively).
Figure 5.
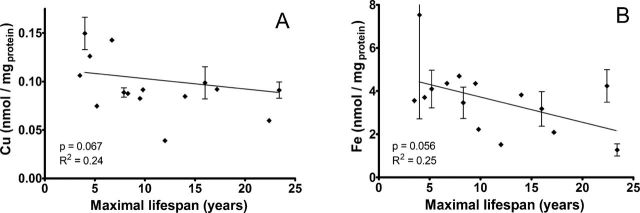
Baseline cellular copper and iron concentrations correlate with maximal life span of rodent species. Symbols represent cellular copper (A) and iron (B) concentrations measured in primary rodent fibroblasts not exposed to Cd. Error bars indicate the standard error of the mean calculated from average copper or iron concentrations in primary cell lines established from different animals of the same rodent species. Each plot also shows the least squares regression line, and Pearson R 2 and p values.
Furthermore, these metal measurements provide insight into the determinants of resistance to Cd toxicity. The concentration of Cd that leads to the death of 50% of the cells in defined conditions (23), that is, the LD50, was taken as an index of resistance to Cd toxicity. We measured the Cd LD50 for all 15 species listed in Table 1, and compared the results to the rate of Cd uptake, fraction of Zn exported upon Cd exposure, and cellular Fe and Cu concentrations prior to Cd exposure. The rate of Cd uptake, the fraction of Zn exported, and the baseline cellular Fe concentration (but not Cu concentration) all correlate with Cd LD50 (Figure 6; p values ≤ .004). These associations do not reflect merely a confounding effect of joint association with species life span, in that the partial correlations of each of these biochemical indices with LD50 remain significant (p values of .02, .006, and .03, respectively) even after adjustment for life span. These data thus suggest that slower Cd uptake, decreased Zn export, and lower baseline Fe concentration each contribute to resistance to Cd toxicity.
Figure 6.

Sensitivity to the lethal effect of cadmium (Cd; LD50) correlates with rate of Cd uptake, fraction of zinc exported, and cellular iron concentration prior to Cd exposure. The LD50 values were calculated as the average of two different fibroblast cell lines from two different animals of the same species and are plotted against average rate of Cd uptake (A), fraction of zinc exported (B) and cellular iron (C) and copper (D) concentration prior to Cd exposure. Each plot also shows the least squares regression line, and Pearson R 2 and p values. Short-lived species with life span up to 6 y are displayed by open diamonds. Long-lived species with life span between 12 and 23.4 y are shown by closed diamonds and species with intermediate life span of 6–12 y are indicated by stars.
Discussion
We have examined the Cd resistance of primary dermal fibroblast cell lines from 15 rodent species, and one species of bat, and analyzed transition metal homeostasis with respect to species longevity. Long-lived mutants of the nematode C. elegans and primary fibroblasts established from several varieties of long-lived mutant mice are significantly more resistant to Cd toxicity than wild-type controls (4,23,39). In addition, fibroblasts from short-lived bird and rodent species are more sensitive to Cd toxicity than those from longer-lived species, including the very long-lived naked mole rat (2,3,6). Although dermal fibroblasts are unlikely to play an important role in the control of life span in these species, previous studies suggest that fibroblasts can provide a convenient system for exploration of cellular properties that might also affect a wide range of cell types in multiple tissues. These studies thus can provide insight into the way evolutionary forces mold stress-resistant mechanisms to affect life span and aging rate.
Cellular resistance to Cd could involve constraints on Cd influx, augmentation of Cd removal, internal buffering of Cd ions by chelators or compartmentalization, or mechanisms that modulate the toxic effects of Cd, such as turnover and replacement of Cd-damaged macromolecules. Our data suggest that interspecies differences in Cd resistance mainly reflect differences in Cd import. When cells from long-lived rodent species are exposed to Cd for 6 hours they accumulate significantly lower amounts of Cd than cells from short-lived species. Cd is not an essential metal and is imported by transporters specific for other metals that are essential for cell function. Several transporters have been shown to catalyze Cd import. The Zn and Mn importers Zip8 (Slc39a8) and Zip14 (Slc39a14) as well as the primarily Fe importer, divalent metal transporter 1 (DMT1), were shown to import Cd with high affinity (40–43). Additionally, several reports suggest that some calcium transporters might be involved in Cd import (34,44–47), but no direct evidence has been presented so far. In most cells, DMT1 is primarily expressed in the endosomal membrane to transport Fe from the endosome to cytosol (20,48). Therefore, it seems unlikely that DMT1 is a major Cd importer in fibroblasts. Fujishiro and colleagues (49) have shown that both Zip8 and Zip14 transporters are downregulated in Cd-resistant metallothionein-null cells developed from embryonic mouse fibroblasts. Moreover, Cd-resistant cells developed from rat basophilic leukemia cells show significantly reduced expression of Zip8 as well (50). These data suggest that Zip8 and/or Zip14 play a major role in Cd import in rodent fibroblasts.
In this work, Cd uptake rates were calculated from exposure of cells to 2 μM Cd for 6 hours (Figure 1). These experimental conditions were carefully selected and deserve explicit justification. First, the majority of the cells (>90%) from each of the tested rodent species survive exposure to 2 μM Cd in the culture medium for 6 hours. The most sensitive rodent species show a decline in cell number for exposure lasting longer than 6 hours (Supplementary Figure 1). Second, these conditions allow accumulation of cellular Cd that can be easily detected by ICP-MS. Third, the 6-hour exposure is short enough to avoid significant changes in the cellular expression of Cd importers or exporters (Supplementary Figure 1). Fourth, 2 μM Cd concentration is significantly above K M for the majority of species (Figure 4) so that the measured rate nearly reflects the maximal Cd uptake rate. Fifth, Cd uptake rate is constant over at least the first 6 hours of experiment (Supplementary Figure 1).
The data in Figure 1 are normalized to the amount of protein within the cell. If cells differ in size, normalization to cell size could in principle have led to somewhat different values. There is no evidence that the average rodent fibroblast cell size correlates with species life span, and we did not routinely measure volumes of the fibroblasts used in the study. As one test of the possible influence of differences in cell volume, we compared cells from mice to those of the little brown bat, whose fibroblasts are similar in size when examined microscopically. Bat cells were approximately 100-fold more Cd resistant than mouse fibroblasts (2) and show a Cd uptake rate that is eightfold lower than mouse fibroblasts (Table 1), consistent with the exceptional longevity of the organism, despite similarity in volume per cell.
Cd accumulates in cells and tissues, and no effective mechanism exists for its export. In humans, Cd turns over very slowly, with a half-life of about 20 years (7). Our data show that (i) Cd accumulates within the cells reaching intracellular Cd concentrations on the order of several 100 μM upon exposure to 2 μM extracellular Cd for 6 hours (Figure 1) and (ii) Cd-loaded fibroblasts retain Cd for several hours (Supplementary Figure 2) upon incubation in the absence of Cd, consistent with the results of other groups (34). Previous work has established that Cd disrupts metal homeostasis of transition metals Zn, Fe, Cu, and Mn (reviewed in reference (12)). Our data indicate that cellular Cd accumulation results in Zn export in rodent fibroblasts (Figure 2). One possible mechanism for this observation is that Cd binds with higher affinity than Zn to binding sites containing multiple thiol ligands, such as metallothioneins and Zn finger proteins (12,51). Thus, Cd could displace protein-bound Zn ions, leading to an increase in cellular Zn and enhanced Zn export, consistent with the correlation between cellular Cd concentration and Zn loss (Figure 3). Similarly, Cd may also compete for sites that bind Fe and Cu leading to a disruption of cellular Fe and Cu homeostasis and potentially contributing to the reactive oxygen species production accompanying Cd exposure (7,8). Indeed, Figure 6 demonstrates that the cellular Fe concentration prior to Cd exposure correlates with Cd sensitivity (p value = .004).
It is important to consider possible relationships between maximal life span and species-specific differences in body weight to avoid reporting associations that merely depend on body size and are associated with metabolic demands. We have evaluated the relationships of Cd uptake rate, baseline cellular Fe and Cu concentrations, and fraction of exported Zn to species body mass. We used regression of residuals and partial correlations adjusted for species body mass. Neither method yielded a significant relationship. This is not surprising, because species life span is strongly correlated to body mass, and thus statistical adjustment for mass dramatically reduces the statistical power for the regression or correlation. We thus cannot rule out the idea that the relationships we report between metal ion mobility and species life span might, in theory, reflect shared influences of mass or some other confounder (eg, metabolic rate), although it is difficult to see how changes in mass or metabolic rate per se might lead to changes in influx or efflux of heavy metals into skin-derived fibroblasts. Similarly, we found no significant relationship between the cellular endpoints and life span using a standardized contrasts analysis (24). The use of rodent species and the relatively small number of species evaluated limit the statistical power of this approach.
In summary, this report is the first study that directly compares cellular metal concentrations in primary fibroblasts from 15 different rodent species before and after exposure to Cd. These data demonstrate that fibroblasts from long-lived rodent species import less Cd and consequently export less Zn then cells from short-lived species upon exposure to Cd. We hypothesize that fibroblasts from long-lived rodents express fewer Cd transporters than fibroblasts from short-lived species, or perhaps have transporters with higher specificity for the essential transition metal ions compared with Cd and therefore do a better job of excluding Cd from the cell.
Supplementary Material
Supplementary material can be found at: http://biomedgerontology.oxfordjournals.org/
Funding
This work was supported by National Institute of Health grants ES018993 to C.A.F. and J.E.P., GM40602 to C.A.F., and AG013283 and AG023122 to R.A.M. L.D. was supported by National Institutes of Health Training Grant AG000114.
Author Contributions
L.D. designed and performed experiments, analyzed data, and wrote the article. W.M.K. performed experiments. J.E.P. helped to design experiments. R.A.M. and C.A.F. supervised the project, helped to design experiments, and edited the article.
Supplementary Material
Acknowledgments
We thank Melissa Han for assistance with cell culture, Dr. Andrew Pickering for help with phylogenic statistical analysis, Dr. Ted Huston for help with measurement and analysis of ICP-MS data, and Fierke and Miller laboratory members for helpful discussions.
References
- 1. Zhou KI, Pincus Z, Slack FJ. Longevity and stress in Caenorhabditis elegans. Aging (Albany NY). 2011;3:733–753. :100367 [pii] [DOI] [PMC free article] [PubMed] [Google Scholar]
- 2. Harper JM, Salmon AB, Leiser SF, Galecki AT, Miller RA. Skin-derived fibroblasts from long-lived species are resistant to some, but not all, lethal stresses and to the mitochondrial inhibitor rotenone. Aging Cell. 2007;6:1–13. :10.1111/j.1474-9726.2006.00255.x [DOI] [PMC free article] [PubMed] [Google Scholar]
- 3. Harper JM, Wang M, Galecki AT, Ro J, Williams JB, Miller RA. Fibroblasts from long-lived bird species are resistant to multiple forms of stress. J Exp Biol. 2011;214(Pt 11):1902–1910. :10.1242/jeb.054643 [DOI] [PMC free article] [PubMed] [Google Scholar]
- 4. Salmon AB, Murakami S, Bartke A, Kopchick J, Yasumura K, Miller RA. Fibroblast cell lines from young adult mice of long-lived mutant strains are resistant to multiple forms of stress. Am J Physiol Endocrinol Metab. 2005;289:E23–E29. :10.1152/ajpendo.00575.2004 [DOI] [PubMed] [Google Scholar]
- 5. Kapahi P, Boulton ME, Kirkwood TB. Positive correlation between mammalian life span and cellular resistance to stress. Free Radic Biol Med. 1999;26:495–500. :S0891-5849(98)00323-2 [pii] [DOI] [PubMed] [Google Scholar]
- 6. Salmon AB, Sadighi Akha AA, Buffenstein R, Miller RA. Fibroblasts from naked mole-rats are resistant to multiple forms of cell injury, but sensitive to peroxide, ultraviolet light, and endoplasmic reticulum stress. J Gerontol A Biol Sci Med Sci. 2008;63:232–241. :63/3/232 [pii] [DOI] [PMC free article] [PubMed] [Google Scholar]
- 7. Joseph P. Mechanisms of cadmium carcinogenesis. Toxicol Appl Pharmacol. 2009;238:272–279. :10.1016/j.taap.2009.01.011 [DOI] [PubMed] [Google Scholar]
- 8. Hartwig A. Mechanisms in cadmium-induced carcinogenicity: recent insights. Biometals. 2010;23:951–960. :10.1007/s10534-010-9330-4 [DOI] [PubMed] [Google Scholar]
- 9. Wieland M, Levin MK, Hingorani KS, Biro FN, Hingorani MM. Mechanism of cadmium-mediated inhibition of Msh2-Msh6 function in DNA mismatch repair. Biochemistry. 2009;48:9492–9502. :10.1021/bi9001248 [DOI] [PMC free article] [PubMed] [Google Scholar]
- 10. Méplan C, Mann K, Hainaut P. Cadmium induces conformational modifications of wild-type p53 and suppresses p53 response to DNA damage in cultured cells. J Biol Chem. 1999;274:31663–31670. [DOI] [PubMed] [Google Scholar]
- 11. Nzengue Y, Candéias SM, Sauvaigo S, et al. The toxicity redox mechanisms of cadmium alone or together with copper and zinc homeostasis alteration: its redox biomarkers. J Trace Elem Med Biol. 2011;25:171–180. :10.1016/j.jtemb.2011.06.002 [DOI] [PubMed] [Google Scholar]
- 12. Moulis JM. Cellular mechanisms of cadmium toxicity related to the homeostasis of essential metals. Biometals. 2010;23:877–896. :10.1007/s10534-010-9336-y [DOI] [PubMed] [Google Scholar]
- 13. Heo DH, Baek IJ, Kang HJ, et al. Cadmium regulates copper homoeostasis by inhibiting the activity of Mac1, a transcriptional activator of the copper regulon, in Saccharomyces cerevisiae. Biochem J. 2010;431:257–265. :10.1042/BJ20100638 [DOI] [PubMed] [Google Scholar]
- 14. Nzengue Y, Steiman R, Rachidi W, Favier A, Guiraud P. Oxidative stress induced by cadmium in the C6 cell line: role of copper and zinc. Biol Trace Elem Res. 2012;146:410–419. :10.1007/s12011-011-9265-9 [DOI] [PubMed] [Google Scholar]
- 15. Noël L, Huynh-Delerme C, Guérin T, Huet H, Frémy JM, Kolf-Clauw M. Cadmium accumulation and interactions with zinc, copper, and manganese, analysed by ICP-MS in a long-term Caco-2 TC7 cell model. Biometals. 2006;19:473–481. :10.1007/s10534-005-5147-y [DOI] [PubMed] [Google Scholar]
- 16. Waldron KJ, Rutherford JC, Ford D, Robinson NJ. Metalloproteins and metal sensing. Nature. 2009;460:823–830. :10.1038/nature08300 [DOI] [PubMed] [Google Scholar]
- 17. Dempski RE. The cation selectivity of the ZIP transporters. Curr Top Membr. 2012;69:221–245. :10.1016/B978-0-12-394390-3.00009-4 [DOI] [PubMed] [Google Scholar]
- 18. Kambe T. Molecular architecture and function of ZnT transporters. Curr Top Membr. 2012;69:199–220. :10.1016/B978-0-12-394390-3.00008-2 [DOI] [PubMed] [Google Scholar]
- 19. Nevitt T, Ohrvik H, Thiele DJ. Charting the travels of copper in eukaryotes from yeast to mammals. Biochim Biophys Acta. 2012;1823:1580–1593. :10.1016/j.bbamcr.2012.02.011 [DOI] [PMC free article] [PubMed] [Google Scholar]
- 20. Wang J, Pantopoulos K. Regulation of cellular iron metabolism. Biochem J. 2011;434:365–381. :10.1042/BJ20101825 [DOI] [PMC free article] [PubMed] [Google Scholar]
- 21. Sutherland DE, Stillman MJ. The “magic numbers” of metallothionein. Metallomics. 2011;3:444–463. :10.1039/c0mt00102c [DOI] [PubMed] [Google Scholar]
- 22. Ehrensberger KM, Bird AJ. Hammering out details: regulating metal levels in eukaryotes. Trends Biochem Sci. 2011;36:524–531. :10.1016/j.tibs.2011.07.002 [DOI] [PubMed] [Google Scholar]
- 23. Murakami S, Salmon A, Miller RA. Multiplex stress resistance in cells from long-lived dwarf mice. FASEB J. 2003;17:1565–1566. :10.1096/fj.02-1092fje [DOI] [PubMed] [Google Scholar]
- 24. Garland T, Adolph SC. Why not to do 2-Species Comparative-Studies - limitations on inferring adaptation. Physiol Zool. 1994;67:797–828. [Google Scholar]
- 25. Bradley RD, Durish ND, Rogers DS, Miller JR, Engstrom MD, Kilpatrick CW. Toward a molecular phylogeny for peromyscus: evidence from mitochondrial cytochrome-b sequences. J Mammal. 2007;88:1146–1159. :10.1644/06-MAMM-A-342R.1 [DOI] [PMC free article] [PubMed] [Google Scholar]
- 26. Blanga-Kanfi S, Miranda H, Penn O, Pupko T, DeBry RW, Huchon D. Rodent phylogeny revised: analysis of six nuclear genes from all major rodent clades. BMC Evol Biol. 2009;9:71. :10.1186/1471-2148-9-71 [DOI] [PMC free article] [PubMed] [Google Scholar]
- 27. Meredith RW, Janečka JE, Gatesy J, et al. Impacts of the cretaceous terrestrial revolution and KPg extinction on mammal diversification. Science. 2011;334:521–524. :10.1126/science.1211028 [DOI] [PubMed] [Google Scholar]
- 28. Ducroz JF, Volobouev V, Granjon L. A molecular perspective on the systematics and evolution of the genus Arvicanthis (Rodentia, Muridae): inferences from complete cytochrome b gene sequences. Mol Phylogenet Evol. 1998;10:104–117. :10.1006/mpev.1997.0477 [DOI] [PubMed] [Google Scholar]
- 29. Riddle BR, Hafner DJ, Alexander LF. Phylogeography and systematics of the Peromyscus eremicus species group and the historical biogeography of North American warm regional deserts. Mol Phylogenet Evol. 2000;17:145–160. :10.1006/mpev.2000.0841 [DOI] [PubMed] [Google Scholar]
- 30. Neumann K, Michaux J, Lebedev V, et al. Molecular phylogeny of the Cricetinae subfamily based on the mitochondrial cytochrome b and 12S rRNA genes and the nuclear vWF gene. Mol Phylogenet Evol. 2006;39:135–148. :10.1016/j.ympev.2006.01.010 [DOI] [PubMed] [Google Scholar]
- 31. Oshida T, Masuda R. Phylogeny and zoogeography of six squirrel species of the genus sciurus (mammalia, rodentia), inferred from cytochrome B gene sequences. Zoolog Sci. 2000;17:405–409. :10.2108/jsz.17.405 [DOI] [PubMed] [Google Scholar]
- 32. Steppan S, Adkins R, Anderson J. Phylogeny and divergence-date estimates of rapid radiations in muroid rodents based on multiple nuclear genes. Syst Biol. 2004;53:533–553. :10.1080/10635150490468701 [DOI] [PubMed] [Google Scholar]
- 33. Ellis RJ. Macromolecular crowding: obvious but underappreciated. Trends Biochem Sci. 2001;26:597–604. :S0968-0004(01)01938-7 [pii] [DOI] [PubMed] [Google Scholar]
- 34. Fujishiro H, Kubota K, Inoue D, et al. Cross-resistance of cadmium-resistant cells to manganese is associated with reduced accumulation of both cadmium and manganese. Toxicology. 2011;280:118–125. :10.1016/j.tox.2010.12.002 [DOI] [PubMed] [Google Scholar]
- 35. Foster AW, Robinson NJ. Promiscuity and preferences of metallothioneins: the cell rules. BMC Biol. 2011;9:25. :10.1186/1741-7007-9-25 [DOI] [PMC free article] [PubMed] [Google Scholar]
- 36. de Magalhães JP, Costa J. A database of vertebrate longevity records and their relation to other life-history traits. J Evol Biol. 2009;22:1770–1774. :10.1111/j.1420-9101.2009.01783.x [DOI] [PubMed] [Google Scholar]
- 37. Pérez VI, Buffenstein R, Masamsetti V, et al. Protein stability and resistance to oxidative stress are determinants of longevity in the longest-living rodent, the naked mole-rat. Proc Natl Acad Sci USA. 2009;106:3059–3064. :10.1073/pnas.0809620106 [DOI] [PMC free article] [PubMed] [Google Scholar]
- 38. Salmon AB, Leonard S, Masamsetti V, et al. The long lifespan of two bat species is correlated with resistance to protein oxidation and enhanced protein homeostasis. FASEB J. 2009;23:2317–2326. :10.1096/fj.08-122523 [DOI] [PMC free article] [PubMed] [Google Scholar]
- 39. Barsyte D, Lovejoy DA, Lithgow GJ. Longevity and heavy metal resistance in daf-2 and age-1 long-lived mutants of Caenorhabditis elegans. FASEB J. 2001;15:627–634. :10.1096/fj.99-0966com [DOI] [PubMed] [Google Scholar]
- 40. Wang CY, Jenkitkasemwong S, Duarte S, et al. ZIP8 is an iron and zinc transporter whose cell-surface expression is up-regulated by cellular iron loading. J Biol Chem. 2012;287:34032–34043. :10.1074/jbc.M112.367284 [DOI] [PMC free article] [PubMed] [Google Scholar]
- 41. Jenkitkasemwong S, Wang CY, Mackenzie B, Knutson MD. Physiologic implications of metal-ion transport by ZIP14 and ZIP8. Biometals. 2012;25:643–655. :10.1007/s10534-012-9526-x [DOI] [PMC free article] [PubMed] [Google Scholar]
- 42. Girijashanker K, He L, Soleimani M, et al. Slc39a14 gene encodes ZIP14, a metal/bicarbonate symporter: similarities to the ZIP8 transporter. Mol Pharmacol. 2008;73:1413–1423. :10.1124/mol.107.043588 [DOI] [PMC free article] [PubMed] [Google Scholar]
- 43. Illing AC, Shawki A, Cunningham CL, Mackenzie B. Substrate profile and metal-ion selectivity of human divalent metal-ion transporter-1. J Biol Chem. 2012;287:30485–30496. :10.1074/jbc.M112.364208 [DOI] [PMC free article] [PubMed] [Google Scholar]
- 44. Min KS, Ueda H, Tanaka K. Involvement of intestinal calcium transporter 1 and metallothionein in cadmium accumulation in the liver and kidney of mice fed a low-calcium diet. Toxicol Lett. 2008;176:85–92. :10.1016/j.toxlet.2007.10.011 [DOI] [PubMed] [Google Scholar]
- 45. Vesey DA. Transport pathways for cadmium in the intestine and kidney proximal tubule: focus on the interaction with essential metals. Toxicol Lett. 2010;198:13–19. :10.1016/j.toxlet.2010.05.004 [DOI] [PubMed] [Google Scholar]
- 46. Thévenod F. Catch me if you can! Novel aspects of cadmium transport in mammalian cells. Biometals. 2010;23:857–875. :10.1007/s10534-010-9309-1 [DOI] [PubMed] [Google Scholar]
- 47. Bergeron PM, Jumarie C. Reciprocal inhibition of Cd(2+) and Ca(2+) uptake in human intestinal crypt cells for voltage-independent Zn-activated pathways. Biochim Biophys Acta. 2006;1758:702–712. :10.1016/j.bbamem.2006.04.019 [DOI] [PubMed] [Google Scholar]
- 48. Hentze MW, Muckenthaler MU, Galy B, Camaschella C. Two to tango: regulation of Mammalian iron metabolism. Cell. 2010;142:24–38. :10.1016/j.cell.2010.06.028 [DOI] [PubMed] [Google Scholar]
- 49. Fujishiro H, Okugaki S, Kubota K, Fujiyama T, Miyataka H, Himeno S. The role of ZIP8 down-regulation in cadmium-resistant metallothionein-null cells. J Appl Toxicol. 2009;29:367–373. :10.1002/jat.1419 [DOI] [PubMed] [Google Scholar]
- 50. Fujishiro H, Ohashi T, Takuma M, Himeno S. Suppression of ZIP8 expression is a common feature of cadmium-resistant and manganese-resistant RBL-2H3 cells. Metallomics. 2013;5:437–444. :10.1039/c3mt00003f [DOI] [PubMed] [Google Scholar]
- 51. Berg JM, Godwin HA. Lessons from zinc-binding peptides. Annu Rev Biophys Biomol Struct. 1997;26:357–371. :10.1146/annurev.biophys.26.1.357 [DOI] [PubMed] [Google Scholar]
Associated Data
This section collects any data citations, data availability statements, or supplementary materials included in this article.