

Abstract
Background.
A frailty index (FI) based on the accumulation of deficits typically has a submaximal limit at about 0.70. The objectives of this study were to examine how population characteristics of the FI change in the Honolulu-Asia Aging Study cohort, which has been followed to near-complete mortality. In particular, we were interested to see if the limit was exceeded.
Methods.
Secondary analysis of six waves of the Honolulu-Asia Aging Study. Men (n = 3,801) aged 71–93 years at baseline (1991) were followed until death (N = 3,455; 90.9%) or July 2012. FIs were calculated across six waves and the distribution at each wave was evaluated. Kaplan–Meier analyses and Cox proportional hazard models were performed to examine the relationship of frailty with mortality.
Results.
At each wave, frailty was nonlinearly associated with age, with acceleration in later years. The distributions of the FIs were skewed with long right tails. Despite the increasing mortality in each successive wave, the 99% submaximal limit never exceeded 0.65. The risk of death increased with increasing values of the FI (eg, the hazard rate increased by 1.44 [95% CI = 1.39–1.49] with each increment in the baseline FI grouping). Depending on the wave, the median survival of people with FI more than 0.5 ranged 0.84–2.04 years.
Conclusions.
Even in a study population followed to almost complete mortality, the limit to deficit accumulation did not exceed 0.65, confirming a quantifiable, maximum number of health deficits that older men can tolerate.
Key Words: Frailty, Epidemiology, Deficit accumulation, Frailty index, Mortality.
Negligible senescence occurs in nature only in a select few vertebrates and plants. Usually, physiological systems accumulate health deficits, although, notably not all systems do so to the same extent, even in the same organism (1). The rate of accumulation and the patterns of deficits differ within and across populations. From mice (2,3) to humans (4), this age-associated accumulation of deficits has been shown to be related to increased vulnerability to adverse outcomes commonly referred to as frailty. In human samples, frailty as defined by deficit accumulation increases the risk of institutionalization (5,6), worsening health (7), mortality (8–10), and common late-onset illnesses, such as dementia (11,12), osteoporotic fracture (13), and heart disease (14).
The frailty index (FI) was introduced in 2001 (15) and has been independently validated in many population and clinical studies (8,16–20). The FI was designed to be a state variable that integrates multiple sources of health information, and thereby reflects the extent of vulnerability, illness, and the organism’s proximity to death (21). It has reliably predicted adverse outcomes in a variety of large health databases from around the world [eg, Canada (22), United States (8), China (16,23), Sweden (24), and the European Union (20,25)]. An FI can be created in most secondary data sources related to health by utilizing the routinely collected clinical information such as symptoms, signs, disabilities, and diseases.
For example, an individual who has accumulated 20 out of 40 deficits would have an FI score of 20/40 = 0.5, whereas someone with 10 deficits would have an FI score of 10/40 = 0.25.
Using this accumulation of deficits approach to quantify frailty has allowed insights into how frailty operates within aging populations. In addition to being associated with adverse outcomes, the FI is associated with age, increasing with acceleration as individuals age into late life. Of some interest, the FI has consistently shown a skewed distribution with a fixed submaximal limit (26). Each distribution is characteristic of successive waves from the same samples (23,26). This submaximal limit is approximately 0.7. Therefore, if 40 items are examined, the maximum number of deficits that people demonstrate typically is around 28, not 40 as one might expect were there not to be a limit. This quantifiable limit to deficit accumulation has potentially important public health and clinical implications, and therefore merits careful evaluation. An important question is whether the limit is seen with later, as well as earlier deaths, as suggested in a very elderly Chinese sample followed for 12 years (23).
The Honolulu-Asia Aging Study (HAAS) is a longitudinal epidemiological study focused on cognitive decline and dementia in aged Japanese-American men. Comprehensive clinical assessments at each wave of the project and time of death for the majority of participants (only a few of the men remain living; 9.9% at last data collection in July 2012) provide the opportunity to examine frailty in relation to mortality across six time points over 20 years. The objectives of this study were to examine how population characteristics of the FI change in the HAAS. In particular, we were interested to see if the limit was exceeded.
Methods
Study Population
Data for this project came from the HAAS. Originally members of the Honolulu Heart Program, 3,845 Japanese-American men from the island of Oahu, Hawaii, have been followed since 1965. All participants of Honolulu Heart Program were men of Japanese decent and born between 1900 and 1919 inclusive. Although the original focus of Honolulu Heart Program was on cardiovascular disease in men, HAAS was developed to examine conditions of aging, in particular dementia and age-related neurological disorders. Beginning at the fourth clinical evaluation of the Honolulu Heart Program in 1991, participants were screened for dementia in addition to a standard clinical evaluation. Follow-up evaluations occurred approximately every 2–3 years (1994–1996, 1997–1999, 1999–2000, 2001–2003, 2004–2005, and 2008–2009). At each evaluation, a wide variety of information was collected including medical history, functional disabilities, diagnoses, and cognitive testing. For the HAAS cohort, date of death has been collected for 90.9% of individuals. A detailed overview of the methods for HAAS and Honolulu Heart Program is provided elsewhere (27).
Frailty Index
A FI was created in six of the seven waves of data following a standard procedure (28). Deficits were included in the FI if they could be found across the majority of waves of the HAAS (Table 1). Each variable was dichotomized as 0 being absent and 1 being present. For each individual at each wave, FI scores were calculated as previously mentioned, by summing the individual’s deficits present and dividing that total by the number of deficits considered. Study participants with more than 20% missing deficit data did not have an FI calculated. Compared to those with complete data, those with missing FIs were not significantly different in age or time to death (n with no FI calculated: Wave 1 = 44; Wave 2 = 23; Wave 3 = 5; Wave 5 = 4; Wave 6 = 3; Wave 7 = 0). In Wave 4 of the HAAS, the study did not collect a number of the health deficits and thus no Wave 4 FI was created. To simplify interpretation of the results, FIs were arbitrarily transformed into six groupings for illustrative purposes (FI ≤ 0.05; 0.05 < FI ≤ 0.15; 0.15 < FI ≤ .25; 0.25 < FI ≤ 0.35; 0.35 < FI ≤ 0.5; FI > 0.5).
Table 1.
Items From the Honolulu-Asia Aging Study Used to Create the FI and Their Prevalence Rates (%) at Each Wave
| Waves | ||||||
|---|---|---|---|---|---|---|
| 1 | 2 | 3 | 5 | 6 | 7 | |
| Functional impairment items | ||||||
| Difficulty walking 1/2 mile | 19.5 | 25.8 | 34.3 | 39.3 | 39.0 | 58.7 |
| Difficulty walking up 10 steps | 14.6 | 20.1 | 24.9 | 28.7 | 28.0 | 48.7 |
| Unable to do heavy work | 19.0 | 23.9 | 29.1 | 30.7 | 35.5 | 63.3 |
| Difficulty shopping | 7.9 | 10.3 | 12.7 | 13.9 | 18.6 | 34.7 |
| Difficulty preparing own meals | 6.0 | 7.7 | 9.3 | 11.6 | 15.0 | 31.0 |
| Difficulty paying bills | 6.2 | 10.0 | 13.0 | 15.4 | 18.3 | 35.6 |
| Difficulty using phone | 15.9 | 23.2 | 24.9 | 20.4 | 22.5 | 38.7 |
| Difficulty eating | 1.9 | 3.1 | 5.0 | 3.6 | 3.2 | 9.5 |
| Difficulty dressing | 5.0 | 6.6 | 9.6 | 7.0 | 7.7 | 22.9 |
| Difficulty bathing | 4.9 | 6.6 | 9.3 | 7.6 | 10.2 | 23.5 |
| Difficulty getting to toilet | 3.1 | 4.7 | 6.9 | 5.5 | 6.4 | 15.8 |
| Difficulty lifting | 7.6 | 10.0 | 13.1 | 15.6 | 16.5 | 32.1 |
| Difficulty reaching out | 6.0 | 8.7 | 10.8 | 8.5 | 8.7 | 15.7 |
| Difficulty gripping with hands | 4.4 | 7.8 | 10.3 | 10.6 | 10.4 | 20.6 |
| Disease diagnosis items | ||||||
| Heart attack | 6.9 | 2.2 | 3.4 | 4.4 | 4.5 | 4.4 |
| Stroke, cerebral hemorrhage | 10.7 | 4.2 | 7.5 | 13.9 | 2.1 | 11.9 |
| Parkinson’s disease | 1.9 | 2.3 | 3.1 | 3.7 | 3.0 | 3.5 |
| Fracture (hip, spine, forearm) | 8.6 | 1.4 | 2.3 | 2.5 | 2.0 | N/A |
| Speech impairment | 3.9 | 2.4 | 3.6 | 3.0 | 2.0 | 5.5 |
| Arthritis | 16.7 | N/A | N/A | 26.4 | 31.7 | N/A |
| Diabetes | 17.2 | 16.0 | 17.7 | 17.9 | 17.2 | 16.4 |
| Angina | 6.8 | N/A | N/A | 3.3 | 4.8 | 3.6 |
| Coronary heart failure | 1.5 | N/A | N/A | 1.2 | 2.4 | 3.5 |
| Cancer | 9.3 | N/A | N/A | 18.3 | 18.4 | N/A |
| Emphysema | 3.0 | N/A | N/A | 2.8 | 4.5 | N/A |
| Arrhythmia | N/A | N/A | N/A | 8.2 | 10.8 | 11.5 |
| Other items | ||||||
| Systolic BP reading >140 | 61.6 | 49.1 | 48.5 | 42.0 | 39.6 | 31.0 |
| Diastolic BP reading > 80 | 44.5 | 29.3 | 21.7 | 10.6 | 9.1 | 6.3 |
| Sleepy most of the day | 8.8 | 11.3 | 10.5 | N/A | N/A | 27.2 |
| Disorder related to blood clotting | 2.3 | N/A | 2.4 | 3.4 | 4.5 | N/A |
| Hearing problems | 22.6 | 22.0 | 27.5 | 38.7 | 50.7 | 24.7 |
| Vision problems | 7.9 | 4.1 | 4.6 | 12.4 | 12.3 | 4.0 |
| Depression | 1.6 | 1.8 | 2.3 | 3.5 | 4.1 | 4.6 |
| Bleed or bruise easily | 41.4 | N/A | 39.3 | 47.1 | 48.3 | N/A |
| Impaired cognition (CASI < 74) | 15.3 | 21.7 | 26.8 | 34.0 | 35.5 | 48.3 |
| Memory problems | 15.4 | 2.8 | 5.2 | 7.5 | 9.3 | 15.1 |
| Abnormal gait | 10.6 | 7.1 | 14.3 | 28.4 | 21.1 | N/A |
Note: BP = blood pressure; CASI = Cognitive Abilities Screening Instrument; N/A = not applicable.
Statistical Analysis
Standard descriptive statistics were calculated for the FIs at each wave. To examine the relationship between FI and age, the average FI for each year of age was graphed and a line of best fit was generated using robust regression. The distributions of the FI at each wave were graphed and the 99% quantiles were identified. Years to death were examined by calculating the mean and median survival times for the overall population and the frailest individuals. The distributions of years to death by FI groups were graphed using a Kaplan–Meier analysis. To investigate the impact of frailty and age on mortality, Cox proportional hazard regression models were developed. Frailty was entered into the models organized into the six groups and age was measured in years. All analyses were performed using SPSS 18.0 (29) and Matlab R2012b (30).
Results
Across all the waves, the FI demonstrated a nonlinear relationship with age (Figure 1A). The mean slope was 0.037 (95% CI = 0.033–0.041) and the intercept was −4.87 (95% CI = −5.21 to −4.54). The density distribution of the frailty indices was skewed with long right tails at every wave (Figure 1B). The mean FI value increased slightly over each wave after baseline, consistent with worsening health with increasing age (Table 2). Even after the mean FI increased from 0.14 at baseline to 0.22 at the final wave, the submaximal upper limit to the FI increased from 0.56 at Wave 1, stabilized at 0.59–0.60 from Waves 2 to 6, and increased to 0.65 in Wave 7. This was the case even though the mean age of the sample at Wave 7 was 90.9 years and the cumulative mortality at 90.9% of the sample.
Figure 1.
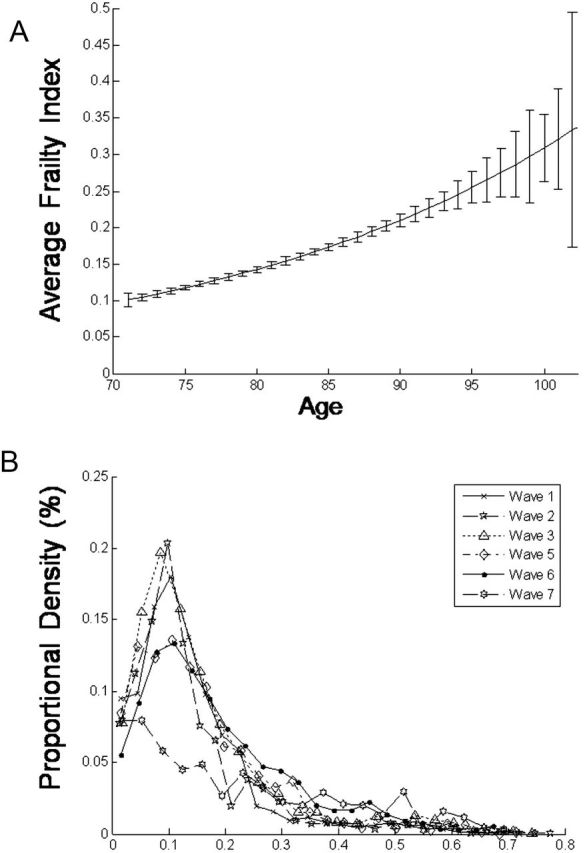
(A) Average frailty index by age pooling across six waves of the Honolulu-Asia Aging Study with standard error bars. (B) Proportional distributions of the frailty index for each of the six waves.
Table 2.
Number of Participants, Average Age, Characteristics of the Frailty Index, and Survival Times Across the Six Waves of the Honolulu-Asia Aging Study
| Wave 1 | Wave 2 | Wave 3 | Wave 5 | Wave 6 | Wave 7 | |
|---|---|---|---|---|---|---|
| N | 3,801 | 2,682 | 1,986 | 1,178 | 906 | 550 |
| Average age (y) | 77.9 | 80.0 | 82.7 | 86.4 | 87.9 | 90.9 |
| FI mean | 0.14 | 0.14 | 0.16 | 0.16 | 0.18 | 0.22 |
| FI standard deviation | 0.11 | 0.12 | 0.12 | 0.12 | 0.12 | 0.17 |
| 99% submaximal limit | 0.56 | 0.59 | 0.60 | 0.60 | 0.60 | 0.65 |
| Median survival times (y) | ||||||
| Overall sample | 9.12 | 7.69 | 6.07 | 4.30 | 3.64 | 1.81 |
| Most frail (FI > 0.50) | 1.92 | 2.04 | 2.04 | 0.94 | 1.52 | 0.84 |
Note: FI = frailty index.
The overall median survival time was 9.1 years at baseline (95% CI = 8.87–9.38), which was 4.75 times as long as the median survival time for the most frail individuals (FI > 0.50; median survival time from baseline = 1.92 years, 95% CI = 1.20–2.63). Kaplan–Meier analyses illustrated the decreasing cumulative survival probabilities with increasing frailty at baseline (Figure 2). Examining only frailty at baseline, the risk ratio for 5-year mortality increased substantially from the fittest group to the frailest group (Table 3). For the frailest individuals, the risk ratio for 5-year mortality was 6.38 (95% CI = 5.29–7.69) compared with the fittest group (FI < 0.05). Multivariate Cox proportional hazard models containing both age and the grouped FI (six groups, entered into the model as a continuous variable) demonstrated that both age and the FI were significant predictors of time to death (HR [age] = 1.11, 95% CI = 1.10–1.12; HR [FI] = 1.44, 95% CI = 1.39–1.49). For example, compared with a 75 year old at baseline, in the lowest FI group, an 80 year old at baseline with FI in the 0.35–0.50 group would have a three times increased risk of death, with 40% of the hazard coming from age and 60% from frailty.
Figure 2.

Kaplan–Meier survival curves at varying levels of baseline frailty index in the Honolulu-Asia Aging Study. From top line to bottom: FI ≤ 0.05; 0.05 < FI ≤0.15; 0.15 < FI ≤ 0.25; 0.25 < FI ≤ 0.35; 0.35 < FI ≤ 0.50; FI > 0.50. FI = frailty index.
Table 3.
Five-Year Risk of Death and Risk Ratios in Relation to Baseline Frailty Status and Wave 5 Frailty Status for the Honolulu-Asia Aging Study Cohort of Men, Aged 72–93 at Baseline
| FI Groupings | Baseline | Wave 5 | ||||
|---|---|---|---|---|---|---|
| N | 5-Year Risk of Death | Risk Ratio (95% CI) | N | 5-Year Risk of Death | Risk Ratio (95% CI) | |
| FI ≤ 0.05 | 1,343 | 0.12 | 1.00* | 99 | 0.30 | 1.00* |
| 0.05 < FI ≤0.15 | 1,799 | 0.20 | 1.61 (1.36–1.91) | 594 | 0.35 | 1.17 (0.85–1.60) |
| 0.15 < FI ≤ 0.25 | 389 | 0.40 | 3.24 (2.69–3.91) | 304 | 0.48 | 1.59 (1.15–2.18) |
| 0.25 < FI ≤ 0.35 | 121 | 0.58 | 4.68 (3.80–5.76) | 90 | 0.66 | 2.16 (1.55–3.02) |
| 0.35 < FI ≤ 0.50 | 78 | 0.72 | 5.81 (4.76–7.09) | 58 | 0.88 | 2.90 (2.12–3.97) |
| FI > 0.50 | 71 | 0.79 | 6.38 (5.29–7.69) | 30 | 1.00 | 3.30 (2.45–4.45) |
Notes: CI = confidence interval; FI = frailty index.
*FI grouping with lowest scores utilized as the reference category.
Discussion
In a large sample of older men aged 72–93 years at baseline, we quantified frailty using an accumulation of deficits approach. The distribution of the FI was very similar across waves, consistent with increasing mortality in relation to frailty. Even in a sample followed to almost complete mortality, the limit to deficit accumulation did not exceed 0.65.
Our data must be interpreted with caution. Some items were not collected at each wave. In consequence, Wave 4 of the HAAS did not contain enough similar data items to calculate an FI, leaving a wider gap between measurements in the middle of the study. Additionally, the items that make up the FI are not perfectly consistent across each of the waves. The analyses also focused on frailty in a wave by wave basis, but frailty is dynamic by nature and future analyses will need to closely examine transitions in frailty status, and how changes and rates of change are related to adverse outcomes in the HAAS study population. We note too that the HAAS only consisted of older Japanese-American men on an isolated island in the Pacific Ocean, making generalization of these results uncertain. Although the common characteristics of the FI held true (increase with age, highly associated with mortality, limit <0.7) with an all male sample, we cannot examine sex differences. This is important: recently, our group has reported that, in the Beijing Longitudinal Study of Aging (n = 3,257), women had a higher FI limit (0.69) than did men (0.61) (31). Even so, in both groups, values near the limit were associated with complete mortality by 5 years.
Although the FI largely was distributed as expected, this was not true of the final wave. In that wave (Wave 7), the mean FI increased sharply (to 0.22 [±0.17] from 0.16 ± 0.12 in Waves 3 and 5). By examining the deficits measured (Table 1), it is clear that this increase was chiefly due to increases in the proportion of Wave 7 survivors with disabilities. This may be due to the advancing age of the cohort (age range at Wave 7 was 87–106 years). Contrastingly, we also found in Wave 7 that a number of individuals had excellent health with FI scores of 0 (n = 29). How these individuals reached their late eighties and early nineties without developing chronic or acute health issues is remarkable and of interest. Likewise, in contrast to other reports with near-complete mortality at FI > 0.5 (23,32), a small number of men (n = 15) survived extended periods despite a high baseline frailty state (FI > 0.50). Of these unexpectedly long-lived very frail individuals, almost half did not have any further assessments in the HAAS, so that misclassification at the initial evaluation cannot be ruled out. Of the remaining eight, four remained frail (FI > 0.50) and four had improved (to FI ≤ 0.50) by Wave 2. Survival in a high frailty state represents either a favorable environment (with lower ambient deficit accumulation) or greater opportunity for repair. The small numbers involved does not allow firm conclusions to be drawn. Interestingly, a recent report on exceptional longevity in Okinawa noted a high level of poor health amongst the longest lived (33).
Even with long-surviving very frail individuals, a limit to the FI was demonstrated across each wave of the HAAS. The value of the 99% maximal limit never exceeded 0.65. This is consistent with earlier analyses within Chinese (23), Australian/Canadian/United States (26), and Canadian (5,32) populations, but here we saw no changes over the survival period of most of the cohort. Together with clinical cohorts having shown a similar limit (34,35), this reinforces the notion that the limit to deficit accumulation suggests that once individuals reach a highly frail state, they are unable to handle any additional stressors and additional deficits result in death. Although the mortality risk greatly increases with higher levels of frailty (eg, >0.35), it seems that survival remains possible up until the maximal limit is reached. Viewed in this way, the limit of 0.65 for the FI can be roughly considered as a critical threshold at which any additional deficits can cause the system to transition from a state of living to a state where the system collapses. This has important implications for understanding the health and health care of older adults and potentially for younger ones. Although in a large population sample (Canadian National Population Health Survey), we did not observe FI values more than 0.5 in younger people (unpublished), values more than 0.6 have been observed in two disease cohorts in patients in their fifties (36,37). Further study is needed on whether and how the limit varies with age. Clinical interpretation of how the limit might impact decisions about intensive or toxic interventions, which might be expected, at least transiently, to add deficits and thereby increase the value of the FI also requires additional study.
Related to the limit, the FI in the HAAS data illustrated the characteristic skewed distribution that is often present in community-dwelling samples. With the exception of the final wave, the distributions of the FIs over the longitudinal study remained remarkably constant despite significant decreases in the number of people at each wave. This too supports the notion of a limit, without which, the distribution of the FI would shift drastically to the right, significantly modifying the shape of the distribution across each of the waves of a longitudinal study. Instead, as people approach the limit, the probability of their survival until the next wave decreases, keeping the shape of the distribution relatively stable with most individuals remaining in a low state of frailty. Although some work has been done on transitions and trajectories of the FI (7,38,39), more work is needed to develop understanding of how the dynamics of frailty relate to health outcomes in aging populations. Recent epidemiological research has indicated that an individual’s level of frailty can significantly impact cognition and brain health in late life (40). Therefore, it will be important to study the interplay of the dynamics of frailty in relation to cognitive decline associated with aging.
That the maximal limit of the FI remained relatively constant across the six waves after an initial increase, even though the mean value of the FI increased for the sample, contrasts with the experience of a recent large Chinese cohort (n = 6,668; 80 years and older at baseline) (23). There the median remained constant over 12 years of follow-up, by which time only about 15% of subjects remained alive. As much of the increase in the mean value of the FI came only in Wave 7, driven by the surviving 15%, this may reflect period or cohort effects. The observation is motivating further inquiries by our group. As most health care systems typically focus on single illnesses, the FI allows for the development of understanding that fits with a systems perspective, in which the complexity of health and aging can be more fully appreciated. Many of the items utilized to create an FI can be extracted in electronic medical records and can potentially be applied to improve health care for older complex patients (41). The possibility to extend the FI approach to routinely collected clinical data is motivating further inquiry by our group.
In conclusion, frailty, as measured by an accumulation of deficits approach, is closely associated with mortality. In the HAAS cohort of older men, we confirm a quantifiable maximum limit to the number of health deficits that individuals can tolerate.
Funding
This work was supported by the Dalhousie Medical Research Foundation, which provides Kenneth Rockwood with career funding as the Kathryn Allen Weldon Professor of Alzheimer Research; Kenneth Rockwood and Arnold Mitnitski are supported by operating grants from the Canadian Institutes of Health Research (MOP-102544; MOP-115006); and Joshua Armstrong is supported by a postdoctoral fellowship award from the Alzheimer Society of Canada (#1207).
Acknowledgment
HAAS was partially supported by the Intramural Research Program, National Institute on Aging.
References
- 1. Finch CE, Foster JR, Mirsky AE. Ageing and the regulation of cell activities during exposure to cold. J Gen Physiol. 1969;54:690–712. :10.1085/jgp.54.6.690 [DOI] [PMC free article] [PubMed] [Google Scholar]
- 2. Parks RJ, Fares E, Macdonald JK, et al. A procedure for creating a frailty index based on deficit accumulation in aging mice. J Gerontol A Biol Sci Med Sci. 2012;67:217–227. :10.1093/gerona/glr193 [DOI] [PubMed] [Google Scholar]
- 3. Whitehead JC, Hildebrand BA, Sun M, et al. A clinical frailty index in aging mice: comparisons with frailty index data in humans. J Gerontol A Biol Sci Med Sci. 2014;69:621–632. :10.1093/gerona/glt136 [DOI] [PMC free article] [PubMed] [Google Scholar]
- 4. Clegg A, Young J, Iliffe S, Rikkert MO, Rockwood K. Frailty in elderly people. Lancet. 2013;381:752–762. :10.1016/S0140-6736(12)62167-9 [DOI] [PMC free article] [PubMed] [Google Scholar]
- 5. Armstrong JJ, Stolee P, Hirdes JP, Poss JW. Examining three frailty conceptualizations in their ability to predict negative outcomes for home-care clients. Age Ageing. 2010;39:755–758. :10.1093/ageing/afq121 [DOI] [PubMed] [Google Scholar]
- 6. Rockwood K, Mitnitski A. Frailty in relation to the accumulation of deficits. J Gerontol A Biol Sci Med Sci. 2007;62:722–727. [DOI] [PubMed] [Google Scholar]
- 7. Fallah N, Mitnitski A, Searle SD, Gahbauer EA, Gill TM, Rockwood K. Transitions in frailty status in older adults in relation to mobility: a multistate modeling approach employing a deficit count. J Am Geriatr Soc. 2011;59:524–529. :10.1111/j.1532-5415.2011.03300.x [DOI] [PMC free article] [PubMed] [Google Scholar]
- 8. Kulminski AM, Ukraintseva SV, Kulminskaya IV, Arbeev KG, Land K, Yashin AI. Cumulative deficits better characterize susceptibility to death in elderly people than phenotypic frailty: lessons from the Cardiovascular Health Study. J Am Geriatr Soc. 2008;56:898–903. :10.1111/j.1532-5415.2008.01656.x [DOI] [PMC free article] [PubMed] [Google Scholar]
- 9. Mitnitski A, Song X, Skoog I, et al. Relative fitness and frailty of elderly men and women in developed countries and their relationship with mortality. J Am Geriatr Soc. 2005;53:2184–2189. :10.1111/j.1532-5415.2005.00506.x [DOI] [PubMed] [Google Scholar]
- 10. Yashin AI, Arbeev KG, Kulminski A, Akushevich I, Akushevich L, Ukraintseva SV. Cumulative index of elderly disorders and its dynamic contribution to mortality and longevity. Rejuvenation Res. 2007;10:75–86. :10.1089/rej.2006.0500 [DOI] [PubMed] [Google Scholar]
- 11. Song X, Mitnitski A, Rockwood K. Nontraditional risk factors combine to predict Alzheimer disease and dementia. Neurology. 2011;77:227–234. [DOI] [PMC free article] [PubMed] [Google Scholar]
- 12. Sterniczuk R, Theou O, Rusak B, Rockwood K. Sleep disturbance is associated with incident dementia and mortality. Curr Alzheimer Res. 2013;10:767–775. [DOI] [PubMed] [Google Scholar]
- 13. Kennedy C, Ioannidis G, Thabane L, et al. A frailty index predicts 10-year fracture risk: longitudinal data from the Canadian Multicentre Osteoporosis Study (CaMos). J Bone Miner Res. 2013;28:S1–S1. :10.1002/jbmr.2201 [DOI] [PMC free article] [PubMed] [Google Scholar]
- 14. Wallace L, Theou O, Rockwood M, et al. Considering both non-traditional and traditional improves the prediction of coronary heart disease events. Can Geri J. 2013;16:102–103. [Google Scholar]
- 15. Mitnitski AB, Mogilner AJ, Rockwood K. Accumulation of deficits as a proxy measure of aging. ScientificWorldJournal. 2001;1:323–336. :10.1100/tsw.2001.58 [DOI] [PMC free article] [PubMed] [Google Scholar]
- 16. Goggins WW, Jean S, Sham A, et al. Frailty index as a measure of biological age in a Chinese population. J Gerontol A Biol Sci Med Sci. 2005;60:1046–1051. [DOI] [PubMed] [Google Scholar]
- 17. Kulminski AM, Ukraintseva SV, Culminskaya IV, et al. Cumulative deficits and physiological indices as predictors of mortality and long life. J Gerontol A Biol Sci Med Sci. 2008;63:1053–1059. [DOI] [PMC free article] [PubMed] [Google Scholar]
- 18. Kulminski A, Yashin A, Arbeev K, et al. Cumulative index of health disorders as an indicator of aging-associated processes in the elderly: results from analyses of the National Long Term Care Survey. Mech Ageing Dev. 2007;128:250–258. :10.1016/j.mad.2006.12.004 [DOI] [PMC free article] [PubMed] [Google Scholar]
- 19. Gu D, Dupre ME, Sautter J, Zhu H, Liu Y, Yi Z. Frailty and mortality among Chinese at advanced ages. J Gerontol B Psychol Sci Soc Sci. 2009;64:279–289. :10.1093/geronb/gbn009 [DOI] [PMC free article] [PubMed] [Google Scholar]
- 20. Romero-Ortuno R, Kenny RA. The frailty index in Europeans: association with age and mortality. Age Ageing. 2012;41:684–689. :10.1093/ageing/afs051 [DOI] [PMC free article] [PubMed] [Google Scholar]
- 21. Rockwood K, Mitnitski A. Frailty defined by deficit accumulation and geriatric medicine defined by frailty. Clin Geriatr Med. 2011;27:17–26. :10.1016/j.cger.2010.08.008 [DOI] [PubMed] [Google Scholar]
- 22. Rockwood K, Song X, Mitnitski A. Changes in relative fitness and frailty across the adult lifespan: evidence from the Canadian National Population Health Survey. Can Med Assoc J. 2011;183:E487–E494. :10.1503/cmaj.101271 [DOI] [PMC free article] [PubMed] [Google Scholar]
- 23. Bennett S, Song X, Mitnitski A, Rockwood K. A limit to frailty in very old, community-dwelling people: a secondary analysis of the Chinese longitudinal health and longevity study. Age Ageing. 2013;42:372–377. :10.1093/ageing/afs180 [DOI] [PubMed] [Google Scholar]
- 24. Mitnitski A, Bao L, Skoog I, Rockwood K. A cross-national study of transitions in deficit counts in two birth cohorts: implications for modeling ageing. Exp Gerontol. 2007;42:241–246. :10.1016/j.exger.2006.10.001 [DOI] [PubMed] [Google Scholar]
- 25. Theou O, Brothers TD, Rockwood MR, Haardt D, Mitnitski A, Rockwood K. Exploring the relationship between national economic indicators and relative fitness and frailty in middle-aged and older Europeans. Age Ageing. 2013;42:614–619. :10.1093/ageing/aft010 [DOI] [PMC free article] [PubMed] [Google Scholar]
- 26. Rockwood K, Mitnitski A. Limits to deficit accumulation in elderly people. Mech Ageing Dev. 2006;127:494–496. [DOI] [PubMed] [Google Scholar]
- 27. White L, Petrovitch H, Ross GW, et al. Prevalence of dementia in older Japanese-American men in Hawaii: the Honolulu-Asia Aging Study. J Am Med Assoc. 1996;276:955–960. :10.1001/jama.276.12.955 [PubMed] [Google Scholar]
- 28. Searle SD, Mitnitski A, Gahbauer EA, Gill TM, Rockwood K. A standard procedure for creating a frailty index. BMC Geriatr. 2008;8:24. :10.1186/1471-2318-8-24 [DOI] [PMC free article] [PubMed] [Google Scholar]
- 29. PASW Statistics for Windows (Version 18.0) (2009). Chicago, IL: SPSS Inc. [Google Scholar]
- 30. MATLAB and Statistics Toolbox Release 2012b (2010). Natick, MA: Matlab. [Google Scholar]
- 31. Wang C, Song X, Mitnitski A, et al. Gender differences in the relationship between smoking and frailty: results from the Beijing Longitudinal Study of Aging. J Gerontol A Biol Sci Med Sci. 2013;68:338–346. :10.1093/gerona/gls166 [DOI] [PubMed] [Google Scholar]
- 32. Rockwood K, Rockwood MR, Mitnitski A. Physiological redundancy in older adults in relation to the change with age in the slope of a frailty index. J Am Geriatr Soc. 2010;58:318–323. :10.1111/j.1532-5415.2009.02667.x [DOI] [PubMed] [Google Scholar]
- 33. Gavrilova NS, Gavrilov LA. Comments on dietary restriction, Okinawa diet and longevity. Gerontology. 2012;58:221–223. :10.1159/000329894 [DOI] [PMC free article] [PubMed] [Google Scholar]
- 34. Krishnan M, Beck S, Havelock W, Eeles E, Hubbard RE, Johansen A. Predicting outcome after hip fracture: using a frailty index to integrate comprehensive geriatric assessment results. Age Ageing. 2014;43:122–126. :10.1093/ageing/aft084 [DOI] [PubMed] [Google Scholar]
- 35. Evans SJ, Sayers M, Mitnitski A, Rockwood K. The risk of adverse outcomes in hospitalized older patients in relation to a frailty index based on a comprehensive geriatric assessment. Age Ageing. 2014;43:127–132. :10.1093/ageing/aft156 [DOI] [PubMed] [Google Scholar]
- 36. Schoufour JD, Mitnitski A, Rockwood K, Evenhuis HM, Echteld MA. Development of a frailty index for older people with intellectual disabilities: results from the HA-ID study. Res Dev Disabil. 2013;34:1541–1555. :10.1016/j.ridd.2013.01.029 [DOI] [PubMed] [Google Scholar]
- 37. Rockwood MR, MacDonald E, Sutton E, Rockwood K, Baron M. Frailty index to measure health status in people with systemic sclerosis. J Rheumatol. 2014;41:698–705. :10.3899/jrheum.130182 [DOI] [PubMed] [Google Scholar]
- 38. Mitnitski A, Bao L, Rockwood K. Going from bad to worse: a stochastic model of transitions in deficit accumulation, in relation to mortality. Mech Ageing Dev. 2006;127:490–493. :10.1016/j.mad.2006.01.007 [DOI] [PubMed] [Google Scholar]
- 39. Mitnitski A, Song X, Rockwood K. Trajectories of changes over twelve years in the health status of Canadians from late middle age. Exp Gerontol. 2012;47:893–899. :10.1016/j.exger2012.06.015 [DOI] [PubMed] [Google Scholar]
- 40. Robertson DA, Savva GM, Kenny RA. Frailty and cognitive impairment-A review of the evidence and causal mechanisms. Ageing Res Rev. 2013;12:840–851. :10.1016/j.arr.2013.06.004 [DOI] [PubMed] [Google Scholar]
- 41. Drubbel I, de Wit NJ, Bleijenberg N, Eijkemans RJ, Schuurmans MJ, Numans ME. Prediction of adverse health outcomes in older people using a frailty index based on routine primary care data. J Gerontol A Biol Sci Med Sci. 2013;68:301–308. :10.1093/gerona/gls161 [DOI] [PubMed] [Google Scholar]