

Abstract
Purpose
There is currently no adequate method of mapping physiologic and pathophysiologic tissue albumin concentrations in human subjects. The objective of this study was to devise and evaluate a biomarker of regional albumin concentration using gadofosveset-enhanced MRI.
Theory and Methods
A binding and relaxation model was devised and evaluated in vitro in solutions of albumin at 3.0 Tesla (T) and 4.7T. The method was evaluated in the heart in seven volunteers at 3.0T.
Results
MRI-derived estimates of albumin concentration were in good agreement with true values over the range 0.1–1.0 mM (Pearson correlation coefficients of 0.85 and 0.88 for 3.0T and 4.7T, respectively). The mean calculated albumin concentration in the myocardium for the volunteers was 0.02 mM (range, 0.01–0.03 mM).
Conclusion
Accurate estimates of albumin concentration in vitro suggest this may be a viable noninvasive alternative to existing techniques. In the myocardium the MRI-derived estimates of albumin concentration indicate the practical feasibility of the technique but were below expected values. Gadofosveset-enhanced MR relaxometry has potential in providing biomarkers of regional albumin concentration; further evaluation is required before it can be used reliably in vivo. Magn Reson Med 73:244–253, 2015. © 2014 Wiley Periodicals, Inc.
Keywords: gadofosveset, albumin, biomarker, binding, relaxivity
INTRODUCTION
Albumin is the most abundant protein in human plasma, accounting for half of all serum proteins (1). It transports, by means of its numerous binding sites, endogenous compounds (2) and drugs (3), and is essential in regulating the flow of water between blood and tissue (1). Around 33% of albumin in the body is intravascular, with 49% in exchangeable extravascular locations and the remainder in remote extravascular compartments such as the skin (4). An imbalance in intra–extravascular albumin may potentially result in edema. Albumin concentrations may be accurately measured in urine or blood samples, with altered levels caused by changes in rates of synthesis, catabolism or extravascular leakage. Low levels of albumin have been linked to critical illness (5) and may be a risk factor for myocardial infarction (6). The body’s natural transcapillary exchange rate of around 5% of intravascular albumin per hour (7) may increase in damaged or angiogenic vessels. Localized increases in extravascular macromolecular content may be symptomatic of, for example, reperfused myocardial infarction (8) or tumor angiogenesis (9).
Although albumin concentrations in blood and urine are valuable indicators of albumin imbalance, they do not fully describe its biodistribution. Direct measurement of interstitial albumin concentration is not straightforward, with varying results found using invasive techniques such as wick implantation (10), blister suction (11) or double lumen catheterization (12). It is suggested that a noninvasive biomarker (13) of localized extravascular albumin may facilitate quantitative assessment of extravascular leakage. This may have prognostic and/or diagnostic value in assessment of tumor angiogenesis or myocardial infarction, for example, and may also be used for prospective assessment of response to treatment. Although conventional small-molecule gadolinium (Gd) contrast agents are frequently used in MRI to assess microvascular permeability, macromolecular Gd agents have shown increased sensitivity to malignancy (14), response to anti-angiogenic treatment (15) and ischemic microvascular damage (16).
Gadofosveset trisodium (Ablavar, Lantheus Medical Imaging, N Billerica, MA, previously marketed as Vasovist, Schering AG, Germany) is a Gd-containing contrast agent, with a stable gadopentetate core and phosphodiester linkage to a lipophilic albumin-binding group (17). In humans, over 90% of injected gadofosveset is reported to bind reversibly to serum albumin (18), increasing the effective molecular weight of the contrast agent from 957 Da to 68 kDa (19). Binding alters the pharmacokinetics of the molecule, reducing its extravasation and excretion rates; consequently the agent is well suited to angiography (20). Beyond angiography, recent studies have utilized gadofosveset in assessment of human brain tumors (21), liver lesions (22), chronic myocardial infarction (23), atherosclerosis (24), and liver fibrosis (25), and in combination with spin locking in vitro (26).
Substantially higher longitudinal and transverse relaxivities are observed for gadofosveset at low magnetic field strengths upon binding (27), due to the lower tumbling rate and longer correlation time of the bound molecule (28). The longitudinal and transverse relaxivities of the free (unbound) molecule are slightly higher than those of a conventional (nonbinding) small-molecule Gd-based agent such as gadopentetate (29). At physiologically applicable concentrations, it may be assumed that one gadofosveset molecule binds to a single albumin molecule (18,30). In this case, the bound fraction of gadofosveset is at a maximum where albumin exceeds gadofosveset concentration and declines where gadofosveset exceeds albumin concentration. This relationship suggests that, under certain conditions, it may be possible to use gadofosveset binding fraction as a biomarker for albumin concentration. However, signal intensity changes induced by the bound and free gadofosveset molecules cannot be directly separated in vivo and therefore binding fraction must be acquired through mathematical modeling.
This study aims to assess the viability of utilizing measured gadofosveset-enhanced longitudinal (R1, 1/T1) and transverse (R2, 1/T2) relaxation rates to develop a biomarker of albumin concentration in vitro. This method could be applied to generate a spatially located measure of tissue albumin which could be used as an alternative to current invasive techniques. Model feasibility is assessed using R1 and R2 measurements in vitro and in left ventricular blood and myocardial tissue of healthy human volunteers at 3.0 Tesla (T). Identification of abnormal extravascular albumin distribution correlating to increased capillary leakage may have several applications, including early indication of disease progression or treatment response in tumor angiogenesis, or assessment of reperfused myocardial infarction.
THEORY
Measuring Albumin Binding Fraction
For conventional Gd-based contrast agents, a single longitudinal relaxivity (r1) is usually sufficient to describe the relationship between the contrast-agent induced change in R1 (ΔR1) and gadofosveset concentration (Cg); likewise a single transverse relaxivity (r2) describes the relationship between ΔR2 and Cg:
| [1] |
where i = 1,2.
For albumin-binding gadofosveset, composite relaxivities are observed, comprising contributions from both the bound and free molecule. For the B0 field strengths used in this study, relaxivity of the bound molecule exceeds that of the free molecule. For the free molecule, the relationship in Eq. [1] may be assumed. For the bound molecule, there is a nonlinear relationship between Cg and R1,2 (although at high field r1bound approaches r1free and the relationship between Cg and R1 tends to linearity). The overall gadofosveset and serum albumin (Csa) concentrations may be defined as the sum of their bound and free components:
| [2] |
| [3] |
At low B0 field strengths, the distinct relaxivities of the bound and free gadofosveset molecules must be considered:
| [4] |
| [5] |
Assuming ΔR1 and ΔR2 can be measured and r1bound, r1free, r2bound, and r2free are known, it is possible to rearrange Eqs. [4] and [5] to give expressions for bound and free gadofosveset concentration:
| [6] |
| [7] |
Combining Eqs. [6] and [7] according to Eq. [2] gives:
| [8] |
Bound, free, and overall gadofosveset concentrations can therefore be derived from measurement of ΔR1 and ΔR2.
Measuring Albumin Concentration
In a second step, gadofosveset concentration is related to albumin concentration by assuming a chemical equilibrium between free and bound substances. The noncovalent binding equilibrium between a paramagnetic substrate and a protein is defined as (31):
The association constant, or binding affinity (Ka), involving a single equivalent binding site may be expressed as (31):
Expressing this binding affinity in terms of gadofosveset and albumin concentrations:
| [11] |
Assuming a single bound gadofosveset molecule per serum albumin molecule:
| [12] |
Eq. [9] becomes:
| [13] |
Rearranging for Csa:
| [14] |
Inserting Eqs. [6] and [7] into Eq. [12] gives:
 |
[15] |
Eq. [13], therefore, provides a method for deriving albumin concentration through measurement of ΔR1 and ΔR2, assuming fixed relaxivity and binding affinity values.
Measuring Bound Relaxivity
It remains to derive a method for measuring the relaxivity values from in vitro samples with known gadofosveset concentrations. Free relaxivity is derived using Eq. [1], applied to a solution without albumin. To derive a formula for bound relaxivity, Cgfree is first eliminated from Eq. [11] using Eq. [2], and the quadratic equation solved for Cgbound. Inserting the result into Eq. [4] or Eq. [5] gives an expression for ΔR1 or ΔR2 where only bound relaxivity is unknown:
 |
[16] |
where i = 1,2.
Only the negative form of the quadratic solution is applicable as the positive form would give a nonzero solution for Cgbound at Cg = 0. Eq. [14] has been represented in a similar form in several papers (for example, (30,32,33)). The model describes a gradual transition of binding fraction, from a maximum at low Cg, where observed relaxivity is dominated by r1,2bound, toward a minimum at high Cg, where r1,2free has the greater influence (Fig. 1). As the model assumes a single binding site, the shift in emphasis from r1,2bound to r1,2free occurs at around Cg = Csa.
Figure 1.

Modeled variation of ΔR2 with gadofosveset concentration for three serum albumin concentrations, based on Eq. [14], assuming values of Ka = 11.0 mM−1, r2bound = 60.0 s−1 mM−1, r2free = 6.1 s−1 mM−1 (29)
Accepting that r2bound > r2free, it follows from Eq. [2] and Eq. [5] that, in all cases:
| [17] |
It should be noted that experimental imprecision in R2 measurement (and R1 measurement, as Cg is calculated using Eq. [8]) may violate this inequality, and may lead to calculated values of Csa ≤ 0 mM. For transverse relaxivity, r2bound is much higher than r2free at all B0 values; for longitudinal relaxivity, r1bound is much higher than r1free at low B0 but both are effectively equivalent at very high B0 (34). This variation with field strength means that at low B0 any imprecision in R2 measurement has a much greater influence on calculated Cg (Eq. [8]), therefore, it is expected that the model may not be applicable at low B0 values.
METHODS
In Vitro Validation
Model validation was carried out by calculating Csa (using Eq. [13]) for a range of in vitro solutions. This requires values of Ka, ΔR1, ΔR2, r2bound, r2free, r1bound, and r1free. ΔR1 and ΔR2 were measured within the study, a fixed Ka value of 11.0 mM−1 was assumed in calculations (27,28,32), and relaxivity values were derived from the data presented in this study (as values for matching experimental conditions could not be found in the literature).
In vitro solutions of gadofosveset (Vasovist) were prepared for use at 3.0T with phosphate-buffered saline (PBS, dry powder reconstituted with deionized water, pH 7.4, Sigma Aldrich, St Louis, MO) and human serum albumin (HSA, Cohn fraction V lyophilized powder, Sigma Aldrich, in PBS). Solutions were created at Csa and Cg concentrations between 0 and 1.0 mM; a total of 26 combinations of gadofosveset and HSA were prepared. A set of solutions containing the nonbinding contrast agent gadopentetate dimeglumine (Magnevist, Bayer Healthcare Pharmaceuticals, Germany) in HSA at Csa = 0.7 mM were created to act as a control. The solutions measured at 4.7T used bovine serum albumin (BSA, Cohn fraction V lyophilized powder, Sigma Aldrich, in PBS) in place of HSA, within the same range of concentrations.
r1free and r2free were calculated by applying the linear model in Eq. [1] to the ΔR1 and ΔR2 values for the gadofosveset–PBS samples (Csa = 0 mM), where no binding was assumed. To prevent the relaxation rates for any given gadofosveset–albumin sample(Csa > 0 mM) influencing the relaxivity values subsequently used to calculate Csa for that sample, bound relaxivity was calculated by setting aside one sample and applying a one-parameter model fit to the remaining subset of ΔR1 and ΔR2 values (using Eq. [14]). This process was repeated for each sample until a set of individual r1bound and r2bound values was created. The calculated relaxivities associated with each excluded sample (and its measured ΔR1 and ΔR2 values) were used in the subsequent Csa calculation for that sample using Eq. [13].
In Vitro Data Acquisition: 3.0T
Tubes were placed vertically within a cardiac coil in a 3.0T Philips Achieva TX system. Solutions were maintained at a temperature of 34–37°C with warm air flow, verified with a fiber optic temperature probe in an adjacent water tube. T1 values were measured using a spin echo inversion recovery sequence with 5 inversion times (TI = 50, 225, 371, 1665, 4875 ms), repetition time (TR) = 5000 ms, echo time (TE) = 6.2 ms. T2 values were measured using a multi-echo sequence with eight echo times (TE = 50, 100, 150, 200, 250, 300, 350, 400 ms), TR = 1000 ms. Additional parameters common to both T1 and T2 measurement: field of view = 231 × 231 mm; matrix size = 240 × 240 pixels; single coronal (horizontal) slice; slice thickness = 10 mm.
In Vitro Data Acquisition: 4.7T
Tubes were placed vertically in a cylindrical cradle of diameter 60 mm and inserted into a 63-mm quad coil in a horizontal bore 4.7T magnet with Bruker console running ParaVision 5.1 software (Bruker BioSpin MRI GmbH, Ettlingen, Germany). Solutions were maintained at a temperature of 37°C with warm air flow, verified with a fiber optic temperature probe in an adjacent water tube. R1 values were measured using a RARE saturation recovery imaging sequence (35), with nine recovery times (57.2, 68.5, 78.5, 88.5, 103.5, 183.5, 283.5, 383.5, 983.5 ms) and a TE of 11 ms. R2 values were measured using a multi-slice multi-echo (MSME) sequence, with 20 equally spaced TE values from 11 to 220 ms and a TR of 1000 ms. Additional parameters common to both T1 and T2 measurement: field of view = 60 × 60 mm; matrix size = 256 × 256 pixels; RARE factor = 2; averages = 1; centric encoding; single coronal (horizontal) slice; slice thickness = 1 mm.
Relaxation Rates
A circular region of interest (ROI) was drawn within each tube and the mean signal intensity (SI) of each ROI measured using ImageJ software (v1.42q, Rasband, W.S., ImageJ, U. S. National Institutes of Health, Bethesda, MD, http://imagej.nih.gov/ij/, 1997–2011). SI values at 4.7T were adjusted for noise bias using a simple Rician correction (36), based on mean standard deviations of four background regions in each image. R1 values at 4.7T and R2 values at 3.0T and 4.7T, along with 95% confidence intervals, were determined from two-parameter nonlinear fits to Eqs. [16] and [17], respectively, using MATLAB (v 7.9, MathWorks, Natick, MA). R1 calculation at 3.0T included an extra term for TR (Eq. 18).
| [18] |
| [19] |
| [20] |
where S0 represents the fully recovered SI value and b is a factor accounting for imprecision in the 180° inversion pulse, applied to each ROI.
Contrast agent-induced changes in relaxation rate (ΔR1,2) were calculated by subtracting R1,2 values for each non-Gd Csa solution (Cg = 0) from equivalent Gd-containing Csa solutions (Cg > 0).
In Vivo Feasibility Assessment: 3.0T
A total of seven healthy volunteers (five male, mean age 36 ± 10 years, mean weight 81 ± 15 kg) underwent pre- and postcontrast short-axis cardiac scans on a 3.0T Siemens Skyra system at Northwestern Memorial Hospital, Chicago. The study was approved by the Institutional Review Board (IRB) at Northwestern University, with informed consent obtained from all participants. IRB approval did not include provision for taking blood samples, therefore per-volunteer measures of hematocrit and blood albumin were not available.
Images were acquired as part of a larger study mapping flow patterns in thoracic aortic aneurisms (TAA) in different progression stages. Myocardial T1 and T2 values with administration of an MR contrast agent were also acquired to study changes of these parameters associated with inflammatory and connective tissue diseases that are in turn associated with the progression of TAA. A small timing bolus of 1.0–2.0 ml of gadofosveset (Ablavar) was used to establish arrival time and was followed by a main bolus of 6.2–8.8 mL, giving a total dose of 0.12 mL/kg (0.03 mmol/kg). A modified Look-Locker inversion recovery (MOLLI) sequence (37) with motion correction (38) (field of view = 270 × 360 mm, matrix size = 144 × 256 pixels, flip angle = 35°, TR = 313.45 ms, TE = 1.13 ms, bandwidth/pixel = 975 Hz) was used for T1, with T1 maps created inline by the system software. This version of the MOLLI sequence consisted of two inversions, with three images acquired after the first inversion (initial effective TI of 120 ms, and RR interval added to the other two acquisitions), and five images acquired after the second inversion (first effective TI of 200 ms; 200 ms + RR for subsequent acquisitions). Images were acquired with a specific trigger delay to select for end diastole. MOLLI acquisition was followed by a T2 mapping sequence using a single-shot T2-prepared steady-state free precession (SSFP) acquisition with three T2-preparation echo times: 0, 24, and 55 ms (39) (field of view = 337 × 450 mm, matrix size = 144 × 192 pixels, TR = 201.88 ms, TE = 1.07 ms, flip angle = 40°, bandwidth/pixel = 930 Hz). For all sequences, 8 mm slices were acquired at cardiac short axis base, mid and apex locations. Postcontrast images were acquired at up to three time points for each volunteer, with T2 image acquisition occurring 1–2 min after T1 acquisition (Table 1). The mid-point between T1 and T2 image acquisitions was used as the postcontrast reference time for each data point when plotting the results.
Table 1.
Main Bolus and Image Acquisition Times for Volunteersa
| Volunteer no. | Main bolus | Measurement | |||||
|---|---|---|---|---|---|---|---|
| T1 [1] | T2 [1] | T1 [2] | T2 [2] | T1 [3] | T2 [3] | ||
| 1 | 07:08 | 14:31 | 16:47 | – | – | – | – |
| 2 | 03:52 | 08:57 | 11:19 | 38:34 | 39:35 | 54:06 | 55:53 |
| 3 | 02:35 | 07:10 | 08:10 | 29:12 | 30:15 | – | – |
| 4 | 04:15 | 29:17 | 31:44 | – | – | – | – |
| 5 | 08:24 | 41:43 | 43:25 | – | – | – | – |
| 6 | 03:24 | 23:45 | 25:02 | 28:09 | 29:29 | 39:23 | 40:38 |
| 7 | 03:06 | 05:34 | 07:21 | 18:34 | 20:16 | 27:02 | 28:36 |
Time from first administration of contrast agent (timing bolus), MM:SS.
ROIs were drawn within the left ventricle and within the myocardium on each pre- and postcontrast T1 and T2 map at the middle of the short axis view, and median and standard deviation values derived using MATLAB. For albumin calculation, each ROI is considered as a single well-mixed compartment, which is a valid assumption for the left ventricle, where gadofosveset is entirely intravascular, but is a simplification of conditions in the myocardium, where ΔR1 and ΔR2 are influenced by gadofosveset in vascular and extravascular spaces.
As the described T2 acquisition protocol is optimized for myocardial T2 measurement it is likely to underestimate the longer T2 of native blood, which may lead to an underestimation in ΔR2 calculation. To investigate this influence, an underestimation in ΔR2 was simulated and the effect on calculated albumin values observed. Expected ΔR2 values were obtained using Eq. [14] across a range of Csa and Cg values, based on derived in vitro 3.0T relaxivities; these ΔR2 values were then reduced by an arbitrary 10% and Csa values calculated according to Eq. [13].
RESULTS
In Vitro Data at 3.0T and 4.7T
Mean individual gadofosveset relaxivity values measured at 3.0T and 4.7T for the range of Csa–Cg combinations are given in Table2; standard deviations indicate the variance in calculated relaxivity.
Table 2.
Mean Individual Gadofosveset Relaxivity Values (and SDs)
| 3.0T | 4.7T | |||
|---|---|---|---|---|
| Relaxivity (s−1 mM−1) | This study (PBS/HSA) | Literaturea | This study (PBS/BSA) | Literaturea |
| r1bound | 10.0 (0.1) | 9.9 | 6.5 (0.0) | 6.9 |
| r1free | 6.1 (0.3) | 5.3 | 4.5 (0.1) | 5.5 |
| r2bound | 100.9 (0.7) | 60.0 | 60.0 (0.2) | 60.0 |
| r2free | 7.5 (0.2) | 6.1 | 10.7 (0.2) | 6.9 |
Literature values from (29), where r1,2free are measured in water at 37°C and r1,2bound are observed relaxivities in bovine plasma at 37°C.
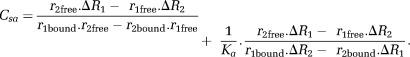
Figure 2 shows model fits (Eq. [14]) plotted against actual ΔR1 and ΔR2 gadofosveset data points at 3.0T and 4.7T, using the mean individual relaxivities in Table 2. A linear fit to the gadopentetate data is also shown.
Figure 2.
ΔR1 (left column) and ΔR2 (right column) values for gadofosveset at a range of albumin concentrations and for gadopentetate at 0.7 mM, at 3.0T (upper row) and 4.7T (lower row). Points represent measured values (with 95% confidence intervals); gadofosveset lines represent model fit based on relaxivities in Table 2; gadopentetate lines represent linear fit.
In Figure 3 calculated Csa values (using Eq. [13]) are compared with actual values for each solution using individually derived relaxivity values at 3.0T and 4.7T. Four data points violated the inequality described in Eq. [15], and were therefore excluded from the 4.7T calculations. The model-derived Csa values correlate with actual Csa at a statistically significant level at both field strengths (Pearson correlation coefficients of 0.85 and 0.88 for 3.0T and 4.7T, respectively).
Figure 3.

Bland–Altman plots of actual versus difference (calculated – actual) Csa at 3.0T (26 plotted points) (a) and 4.7T (24 plotted points) (b). Dashed lines indicate standard deviation of difference
Volunteer Data at 3.0T
Precontrast T1 values in the left ventricle and myocardium were in the range 1493–1818 ms and 1099–1124 ms, respectively. Precontrast T2 values in the left ventricle and myocardium were in the range 117–158 ms and 43–47 ms, respectively. Calculated gadofosveset and albumin concentrations in the left ventricle and myocardium are shown in Figure 4, with data for all seven volunteers plotted against time from first bolus administration. The models for calculating gadofosveset (Eq. [8]) and albumin (Eq. [13]) concentrations used the 3.0T (PBS/HSA) relaxivity values shown in Table 2.
Figure 4.
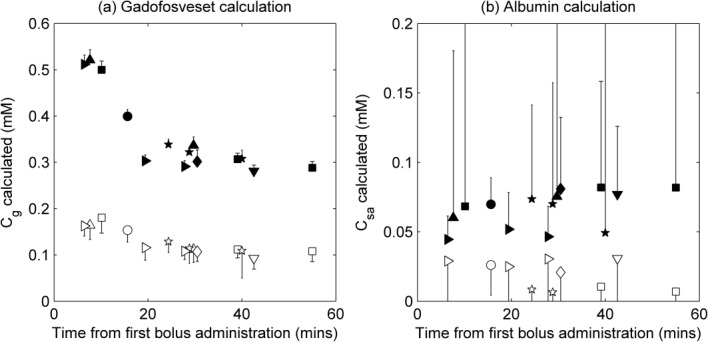
Calculated gadofosveset (a) and albumin (b) concentrations in myocardium (open symbols) and left ventricle (filled symbols) in healthy volunteers at 3.0T. Each symbol shape represents a different volunteer; values are plotted against time from first administration of contrast agent (to mid-point between T1 and T2 image acquisition times); error bars indicate uncertainty in calculations, calculated by propagation of errors using standard deviation of initial R1 and R2 ROI measurements (errors are symmetrical about data point, but only one side shown to aid clarity)
The effect of an underestimation in ΔR2 on calculated Csa was simulated at a range of Cg values, using the 3.0T relaxivity values from Table 2. Simulations showed that a 10% underestimation in ΔR2 led to an underestimation in calculated Csa. This model underestimation increases as actual Csa increases, and is more pronounced at lower Cg. For example, at Csa = 1.0 mM calculated Csa is 0.6 mM lower than actual Csa for Cg =0.1 mM, but calculated Csa is only 0.2 mM lower than actual Csa for Cg = 1.0 mM.
DISCUSSION
Increased capillary leakage is symptomatic of a range of pathologies and healthy processes, resulting in rapid wash-in and wash-out of small molecule contrast agents and an increased transfer of macromolecules, including intravascular albumin, to the interstitial space. In vivo measurement of extravascular albumin content is not straightforward, although a range of invasive techniques are currently available. This study has explored the possibility of utilizing the albumin-binding properties of the Gd-based contrast agent gadofosveset to generate a novel and location-specific noninvasive method for measuring levels of albumin at moderate to high magnetic field strengths. Pre- and postcontrast R1 and R2 measurements are regularly carried out in MRI; the models presented here combine these changes in relaxation rate with calculated relaxivity values and a literature binding affinity value to produce a basic measure of tissue albumin concentration.
In Vitro Model Validation
Calculated r1 and r2 relaxivity values at both 3.0T and 4.7T are in general agreement with previously published values (Table 2), although it is difficult to find directly equivalent experimental conditions for comparison. Using mean calculated relaxivity values, the model represents a good fit to gadofosveset ΔR1 and ΔR2 data points at low and high Csa values (Fig. 2), suggesting that the assumption of a single binding site on the albumin molecule is adequate at these concentration levels. The primary binding site is known to provide the greatest contribution to relaxivity (28), and it is unlikely that Cg levels would be sufficiently high in vivo during the postbolus phase to necessitate inclusion of additional binding sites in this model (32). An attempt to model the data with second and third binding sites filled sequentially according to relative Cg and Csa concentrations, using binding affinity values of 0.84 and 0.26 mM−1 (28), did not noticeably alter the model fits to measured data points (data not shown).
Excluding negative calculated Csa values resulting from measurement imprecision and comparing the remaining calculated and actual Csa values (Fig. 3), the model-derived Csa values correlate with actual Csa at a statistically significant level at both 3.0T and 4.7T.
The albumin-calculation model presented here is expected to work well at higher B0 field strengths (3.0T and above), where there is a large difference between r2bound and r2free but a small difference between r1bound and r1free. At low fields, r1bound is close to r2bound and the difference between ΔR1 and ΔR2 is small. In this case, the precision of the model input parameters would be insufficient to overcome the sensitivity of the model to the variability in those parameters, leading to a breakdown of the model. At very high B0 field strengths, r1bound and r1free values for gadofosveset may be considered equivalent and the model may be simplified to incorporate a linear relationship between ΔR1 and Cg. The Cg calculation described in Eq. [8] may then be represented as Cg = ΔR1/r1.
An underlying correlation between relaxivity and protein content has been shown in previous studies for Gd-based contrast agents not conventionally described as albumin binding (40,41). In vitro gadopentetate ΔR2 data points are well represented here by a linear fit (Fig. 2), suggesting no observable influence of weak binding on contrast agent relaxivity at the albumin levels used in this study. Without separate bound and free transverse relaxivities, gadopentetate provides no means of estimating Csa through application of the model presented here. The high binding affinity of gadofosveset makes it a much more sensitive biomarker of albumin.
In Vivo Feasibility
Gadofosveset-enhanced cardiovascular imaging is an area of active research (42–46), and likely to remain so in North America where the agent is available under the trade name Ablavar. One potential clinical application of the technique for calculating albumin concentration relates to myocardial infarction, therefore a feasibility assessment using human cardiac images was considered relevant. Cardiac imaging has the advantage of enabling direct comparison of calculated albumin values from blood in the left ventricle and from highly perfused myocardial tissue. However, before the model can be assessed, motion correction and other technical challenges must be overcome.
Precontrast T1 and T2 values generally correlate well with literature values (47–49), although longer T2 values in blood have been quoted elsewhere (50). Combining data from seven volunteers with images acquired at a range of time points gave remarkably consistent values of the two model input variables ΔR1 and ΔR2, and supported calculation of appropriate Cg values in both the left ventricle and the myocardium (Fig. 4a). As expected, gadofosveset concentration peaks at the earliest time points postbolus and decreases toward an equilibrium value, although this was not a dynamic acquisition therefore the temporal resolution is such that the bolus peak is not fully described.
At a dose of 0.03 mmol per kg, the average blood concentration of gadofosveset for an 81 kg adult with a total blood volume of 6.4 L would be 0.4 mM; allowing for some extravasation and excretion, the gadofosveset values calculated here in the left ventricle appear reasonable. For a small molecule agent such as gadopentetate, approximately 50% may diffuse to the extravascular space from the blood on the first pass through the capillary bed (51). Although, as a “blood pool” agent, gadofosveset may be expected to remain predominantly within the intravascular space, at high concentrations (immediately after bolus injection, for example) the bound fraction will be low and the extravasation rate may be similar to that of a conventional agent (52). A study in rabbits showed that 61% of injected gadofosveset was still in the blood at 1 min postinjection (32). Certainly, a reduction in Cg between the left ventricle and myocardium is expected, as noted in the relative values here.
Unlike gadofosveset, albumin concentration is expected to remain consistent within an individual for the image acquisition duration. Although there is some within-subject variability (Fig. 4b), this is a representation of the imprecision in data acquisition and does not correlate with time postbolus. The mean calculated albumin concentration in the left ventricle of the seven volunteers was 0.07 mM (range, 0.04–0.08 mM); in the myocardium the mean calculated Csa was 0.02 mM (range, 0.01–0.03 mM).
A reference measure of albumin concentration was not available for comparison. Serum albumin levels in plasma (Csa_plasma) are expected to be approximately 3.5–5.0 g/dL (0.52–0.74 mM) (53). Assuming a hematocrit (Hct) of 0.42, this equates to albumin levels in whole blood of 0.30–0.43 mM (where blood concentration = Csa_plasma (1 − Hct)). Previous studies quote interstitial fluid albumin concentrations (Csa_interstitial) of 0.2–0.4 mM (10,11,54). However, the myocardium ROI contains intravascular, extravascular extracellular and intracellular spaces. Neglecting the intracellular space, as gadofosveset cannot directly access it, and assuming an extracellular volume fraction (EVF) of 0.25 (55), a myocardial blood volume (MBV) of 8% (56) and a hematocrit in capillaries (Hctcap) of 0.25, tissue albumin (Csa_tissue, measurable using gadofosveset) may be expected to be in the range 0.07–0.11 mM (where Csa_tissue = MBV. (Csa_plasma.(1 − Hctcap)) + Csa_interstitial. (EVF − MBV)). This range of expected values assumes that all blood vessels in the myocardium are capillaries; in reality, a proportion would be larger than capillaries and would, therefore, have a higher Hct, leading to a slightly lower range of expected Csa_tissue values.
Calculated Csa values were lower than might be expected in healthy volunteers. Factors contributing to an underestimation could include the relative timings of the T1 and T2 measurements, the separation of gadofosveset delivery into a timing bolus and a main bolus, and the potential incompatibility of translated in vitro relaxivities (for example, due to fundamental differences between in vitro and in vivo measurement of relaxivity (57), although the inclusion of albumin in the in vitro samples used for relaxivity calculation will moderate this issue). The selected scanning parameters were optimized for myocardial tissue and are likely to lead to an underestimation in ΔR2 in the left ventricle. The large error bars on the Csa calculations in the left ventricle (Fig. 4b) confirm the difficulty in applying the model to left ventricular data acquired under conditions optimized for myocardial measurement. Simulated data suggest that underestimation in ΔR2 may result in a substantial underestimation in calculated Csa. However, it should be noted that the described method may not be appropriate or necessary in the left ventricle as albumin levels in blood can be readily measured from blood samples. The primary utility of the method may be in providing measurement of albumin concentration in tissue, where Cg is lower and Csa is conventionally difficult to acquire.
A previous study using the contrast agent gadobenate (58), which has a much lower albumin binding affinity than gadofosveset (59), suggested that renal protein leakage could be identified by analyzing tubular flow differences following injection of two contrast agents, one binding and one nonbinding. Attempts have also been made to map protein levels by utilizing the distinct field dependency of the bound and free gadofosveset molecule (termed delta relaxation enhanced MR, DREMR) (60,61), although this approach requires the use of additional hardware to modulate B0 field strength. The advantage of the method described in this study over either of these approaches is that it only requires a single contrast agent injection and may be readily derived from routinely acquired R1 and R2 measurements using conventional equipment.
CONCLUSIONS
The model presented here demonstrates the feasibility of determining in vitro serum albumin concentration using pre- and postgadofosveset measurements of R1 and R2 at high B0 fields. The method was successfully validated using in vitro samples at 3.0T and 4.7T. Feasibility assessment in a small number of human volunteers was performed using cardiac images, and consistent ΔR1, ΔR2 and Cg values were determined. Underestimation of Csa may be the result of several contributing factors, including the timing of the image acquisitions and translation of in vitro relaxivities. A more effective application of this method may be in tumor angiogenesis, where increased extravascular macromolecular leakage rates are observed and imaging is less restricted by cardiac or respiratory motion. Further in vivo assessment is suggested, to include: simultaneous T1 and T2 measurement; additionally acquiring images between the timing bolus and the main bolus; and blood sampling to establish hematocrit and reference blood albumin levels.
This novel approach may enable noninvasive assessment of extravascular leakage of albumin, utilizing parameters acquired during routine imaging, in regions where implementation of invasive techniques for measurement of interstitial albumin is conventionally challenging. A range of potential clinical applications are envisaged, including assessment of myocardial infarction, tumor angiogenesis, and response to treatment.
Acknowledgments
This study was part-funded by a BBSRC industrial CASE award, in partnership with AstraZeneca (BB/G017220/1). The authors thank all volunteers taking part in this study, and acknowledge the assistance of staff at Northwestern Memorial Hospital, Chicago, Leeds Teaching Hospitals NHS Trust and AstraZeneca, Alderley Park, Cheshire. The authors are also grateful to Azhar Maqbool, Richard Gillot, and David Broadbent for assistance with 3.0T in vitro data acquisition, Michael Markl at Northwestern University, Chicago, for facilitating the volunteer studies, and the National Institutes of Health Research Project Grant (R01) for providing in vivo scan time and salary support.
REFERENCES
- 1.Doweiko JP, Nompleggi DJ. Role of albumin in human physiology and pathophysiology. J Parenter Enteral Nutr. 1991;15:207–211. doi: 10.1177/0148607191015002207. [DOI] [PubMed] [Google Scholar]
- 2.Bhattacharya AA, Grune T, Curry S. Crystallographic analysis reveals common modes of binding of medium and long-chain fatty acids to human serum albumin. J Mol Biol. 2000;303:721–732. doi: 10.1006/jmbi.2000.4158. [DOI] [PubMed] [Google Scholar]
- 3.Kratochwil NA, Huber W, Muller F, Kansy M, Gerber PR. Predicting plasma protein binding of drugs: a new approach. Biochem Pharmacol. 2002;64:1355–1374. doi: 10.1016/s0006-2952(02)01074-2. [DOI] [PubMed] [Google Scholar]
- 4.Nicholson JP, Wolmarans MR, Park GR. The role of albumin in critical illness. Br J Anaesth. 2000;85:599–610. doi: 10.1093/bja/85.4.599. [DOI] [PubMed] [Google Scholar]
- 5.Bradley J, Cunningham K, Jackson V. Serum protein levels in critically ill surgical patients. Intensive Care. 1981;7:291–295. doi: 10.1007/BF01709724. [DOI] [PubMed] [Google Scholar]
- 6.Djousse L, Rothman KJ, Cupples LA, Levy D, Ellison RC. Serum albumin and risk of myocardial infarction and all-cause mortality in the Framingham offspring study. Circulation. 2002;106:2919–2924. doi: 10.1161/01.cir.0000042673.07632.76. [DOI] [PubMed] [Google Scholar]
- 7.Ballmer PE. Causes and mechanisms of hypoalbuminaemia. Clin Nutr. 2001;20:271–273. doi: 10.1054/clnu.2001.0439. [DOI] [PubMed] [Google Scholar]
- 8.Saeed M, Van Dijke CF, Mann JS, Wendland MF, Rosenau W, Higgins CB, Brasch RC. Histologic confirmation of microvascular hyperpermeability to macromolecular MR contrast medium in reperfused myocardial infarction. J Magn Reson Imaging. 1998;8:561–567. doi: 10.1002/jmri.1880080308. [DOI] [PubMed] [Google Scholar]
- 9.Seitz RJ, Wechsler W. Immunohistochemical demonstration of serum proteins in human cerebral gliomas. Acta Neuropathol. 1987;73:145–152. doi: 10.1007/BF00693780. [DOI] [PubMed] [Google Scholar]
- 10.Poulsen HL. Subcutaneous interstitial fluid albumin concentration in long-term diabetes-mellitus. Scand J Clin Lab Invest. 1973;32:167–173. doi: 10.3109/00365517309084345. [DOI] [PubMed] [Google Scholar]
- 11.Haaverstad R, Romslo I, Larsen S. Protein concentration of subcutaneous interstitial fluid in the human leg. J Vasc Res. 1996;16:111–117. doi: 10.1159/000179159. [DOI] [PubMed] [Google Scholar]
- 12.Ellmerer M, Schaupp L, Brunner GA, Sendlhofer G, Wutte A, Wach P, Pieber TR. Measurement of interstitial albumin in human skeletal muscle and adipose tissue by open-flow microperfusion. Am J Physiol Endocrinol Metab. 2000;278:E352–E356. doi: 10.1152/ajpendo.2000.278.2.E352. [DOI] [PubMed] [Google Scholar]
- 13.Waterton JC. Translational magnetic resonance imaging and spectroscopy: opportunities and challenges. In: Garrido L, Beckmann N, editors. New applications of NMR in drug discovery and development. Cambridge, UK: RSC press; 2013. pp. 333–360. . In:, editors.. [Google Scholar]
- 14.Daldrup H, Shames DM, Wendland M, Okuhata Y, Link TM, Rosenau W, Lu Y, Brasch RC. Correlation of dynamic contrast-enhanced MR imaging with histologic tumor grade: comparison of macromolecular and small-molecular contrast media. AJR Am J Roentgenol. 1998;171:941–949. doi: 10.2214/ajr.171.4.9762973. [DOI] [PubMed] [Google Scholar]
- 15.Roberts TPL, Turetschek K, Preda A, Novikov V, Moeglich M, Shames DM, Brasch RC, Weinmann HJ. Tumor microvascular changes to anti-angiogenic treatment assessed by MR contrast media of different molecular weights. Acad Radiol. 2002;9(Suppl. 2):S511–S513. doi: 10.1016/s1076-6332(03)80279-9. [DOI] [PubMed] [Google Scholar]
- 16.Schwitter J, Saeed M, Wendland MF, Derugin N, Canet E, Brasch RC, Higgins CB. Influence of severity of myocardial injury on distribution of macromolecules: extravascular versus intravascular gadolinium-based magnetic resonance contrast agents. J Am Coll Cardiol. 1997;30:1086–1094. doi: 10.1016/s0735-1097(97)00245-3. [DOI] [PubMed] [Google Scholar]
- 17.Aime S, Caravan P. Biodistribution of gadolinium-based contrast agents, including gadolinium deposition. J Magn Reson Imaging. 2009;30:1259–1267. doi: 10.1002/jmri.21969. [DOI] [PMC free article] [PubMed] [Google Scholar]
- 18.Lauffer RB, Parmelee DJ, Dunham SU, Ouellet HS, Dolan RP, Witte S, McMurry TJ, Walovitch RC. MS-325: albumin-targeted contrast agent for MR angiography. Radiology. 1998;207:529–538. doi: 10.1148/radiology.207.2.9577506. [DOI] [PubMed] [Google Scholar]
- 19.Barrett T, Kobayashi H, Brechbiel M, Choyke PL. Macromolecular MRI contrast agents for imaging tumor angiogenesis. Eur J Radiol. 2006;60:353–366. doi: 10.1016/j.ejrad.2006.06.025. [DOI] [PubMed] [Google Scholar]
- 20.Bremerich J, Bilecen D, Reimer P. MR angiography with blood pool contrast agents. Eur Radiol. 2007;17:3017–3024. doi: 10.1007/s00330-007-0712-0. [DOI] [PubMed] [Google Scholar]
- 21.Puig J, Blasco G, Essig M, et al. Albumin-binding MR blood pool contrast agent improves diagnostic performance in human brain tumour: comparison of two contrast agents for glioblastoma. Eur Radiol. 2012:1–9. doi: 10.1007/s00330-012-2678-9. [DOI] [PubMed] [Google Scholar]
- 22.Milot L, Haider M, Foster L, McGregor C, Law C. Gadofosveset trisodium in the investigation of focal liver lesions in noncirrhotic liver: early experience. J Magn Reson Imaging. 2012;36:738–742. doi: 10.1002/jmri.23650. [DOI] [PubMed] [Google Scholar]
- 23.Thouet T, Schnackenburg B, Kokocinski T, Fleck E, Nagel E, Kelle S. Visualization of chronic myocardial infarction using the intravascular contrast agent MS-325 (Gadofosveset) in patients. Sci World J. 2012:1–6. doi: 10.1100/2012/236401. [DOI] [PMC free article] [PubMed] [Google Scholar]
- 24.Phinikaridou A, Andia ME, Protti A, Indermuchle A, Shah A, Smith A, Warley A, Botnar RM. Noninvasive magnetic resonance imaging evaluation of endothelial permeability in murine atherosclerosis using an albumin-binding contrast agent. Circulation. 2012;126:707–719. doi: 10.1161/CIRCULATIONAHA.112.092098. [DOI] [PubMed] [Google Scholar]
- 25.Leporq B, Dumortier J, Pilleul F, Beuf O. 3D-liver perfusion MRI with the MS-325 blood pool agent: A noninvasive protocol to asses liver fibrosis. J Magn Reson Imaging. 2012;35:1380–1387. doi: 10.1002/jmri.23594. [DOI] [PubMed] [Google Scholar]
- 26.Richardson OC, Scott MLJ, Tanner SF, Waterton JC, Buckley DL. Overcoming the low relaxivity of gadofosveset at high field with spin locking. Magn Reson Med. 2012;68:1234–1238. doi: 10.1002/mrm.23316. [DOI] [PMC free article] [PubMed] [Google Scholar]
- 27.Eldredge HB, Spiller M, Chasse JM, Greenwood MT, Caravan P. Species dependence on plasma protein binding and relaxivity of the gadolinium-based MRI contrast agent MS-325. Invest Radiol. 2006;41:229–243. doi: 10.1097/01.rli.0000199293.86956.48. [DOI] [PubMed] [Google Scholar]
- 28.Caravan P, Cloutier NJ, Greenfield MT, et al. The interaction of MS-325 with human serum albumin and its effect on proton relaxation rates. J Am Chem Soc. 2002;124:3152–3162. doi: 10.1021/ja017168k. [DOI] [PubMed] [Google Scholar]
- 29.Rohrer M, Bauer H, Mintorovitch J, Requardt M, Weinmann H-J. Comparison of magnetic properties of MRI contrast media solutions at different magnetic field strengths. Invest Radiol. 2005;40:715–724. doi: 10.1097/01.rli.0000184756.66360.d3. [DOI] [PubMed] [Google Scholar]
- 30.Muller RN, Raduchel B, Laurent S, Platzek J, Pierart C, Mareski P, Vander Elst L. Physicochemical characterization of MS-325, a new gadolinium complex, by multinuclear relaxometry. Eur J Inorg Chem. 1999;(999):1949–1955. ;1. [Google Scholar]
- 31.Aime S, Fasano M, Terreno E, Botta M. Protein-bound metal chelates. In: Merbach AE, Toth E, editors. The chemistry of contrast agents in medical magnetic resonance imaging. Chichester: John Wiley & Sons; 2001. pp. 193–242. . In:, editors.. [Google Scholar]
- 32.Port M, Corot C, Violas X, Robert P, Raynal I, Gagneur G. How to compare the efficiency of albumin-bound and nonalbumin-bound contrast agents in vivo. Invest Radiol. 2005;40:565–573. doi: 10.1097/01.rli.0000175388.98721.9b. [DOI] [PubMed] [Google Scholar]
- 33.Aime S, Chiaussa M, Digilio G, Gianolio E, Terreno E. Contrast agents for magnetic resonance angiographic applications: 1H and 17O NMR relaxometric investigations on two gadolinium(III) DTPA-like chelates endowed with high binding affinity to human serum albumin. J Biol Inorg Chem. 1999;4:766–774. doi: 10.1007/s007750050349. [DOI] [PubMed] [Google Scholar]
- 34.Caravan P, Farrar CT, Frullano L, Uppal R. Influence of molecular parameters and increasing magnetic field strength on relaxivity of gadolinium- and manganese-based T1 contrast agents. Contrast Media Mol Imaging. 2009;4:89–100. doi: 10.1002/cmmi.267. [DOI] [PMC free article] [PubMed] [Google Scholar]
- 35.Hennig J, Nauerth A, Friedburg H. RARE imaging: a fast imaging method for clinical MR. Magn Reson Med. 1986;3:823–833. doi: 10.1002/mrm.1910030602. [DOI] [PubMed] [Google Scholar]
- 36.Henkelman RM. Measurement of signal intensities in the presence of noise in MR images. Med Phys. 1985;12:232–233. doi: 10.1118/1.595711. [DOI] [PubMed] [Google Scholar]
- 37.Messroghli DR, Radjenovic A, Kozerke S, Higgins DM, Sivananthan MU, Ridgway JP. Modified Look-Locker inversion recovery (MOLLI) for high-resolution T1 mapping of the heart. Magn Reson Med. 2004;52:141–146. doi: 10.1002/mrm.20110. [DOI] [PubMed] [Google Scholar]
- 38.Xue H, Shah S, Greiser A, Guetter C, Littmann A, Jolly M-P, Arai AE, Zuehlsdorff S, Guehring J, Kellman P. Motion correction for myocardial T1 mapping using image registration with synthetic image estimation. Magn Reson Med. 2012;67:1644–1655. doi: 10.1002/mrm.23153. [DOI] [PMC free article] [PubMed] [Google Scholar]
- 39.Giri S, Chung YC, Merchant A, Mihai G, Rajagopalan S, Raman SV, Simonetti OP. T2 quantification for improved detection of myocardial edema. J Cardiovasc Magn Reson. 2009;11:56. doi: 10.1186/1532-429X-11-56. [DOI] [PMC free article] [PubMed] [Google Scholar]
- 40.Wang Y, Spiller M, Caravan P. Evidence for weak protein binding of commercial extracellular gadolinium contrast agents. Magn Reson Med. 2010;63:609–616. doi: 10.1002/mrm.22214. [DOI] [PubMed] [Google Scholar]
- 41.Bagher-Ebadian H, Paudyal R, Nagaraja TN, Croxen RL, Fenstermacher JD, Ewing JR. MRI estimation of gadolinium and albumin effects on water proton. Neuroimage. 2011;54(Suppl. 1):S176–S179. doi: 10.1016/j.neuroimage.2010.05.032. [DOI] [PMC free article] [PubMed] [Google Scholar]
- 42.Pedersen SF, Thrysoe SA, Paaske WP, Thim T, Falk E, Ringgaard S, Kim WY. CMR Assessment of endothelial damage and angiogenesis in porcine coronary arteries using gadofosveset. J Cardiovasc Magn Reson. 2011;13:10. doi: 10.1186/1532-429X-13-10. [DOI] [PMC free article] [PubMed] [Google Scholar]
- 43.Biris O, Benefield B, Harris KR, Lee DC. A steady-state method for computation of myocardial blood volume with the intravascular contrast agent Ablavar. J Cardiovasc Magn Reson. 2012;14(Suppl. 1):P49. [Google Scholar]
- 44.Makowski MR, Wiethoff AJ, Uribe S, et al. Congenital heart disease: Cardiovascular MR imaging by using an intravascular blood pool contrast agent. Radiology. 2011;260:680–688. doi: 10.1148/radiol.11102327. [DOI] [PubMed] [Google Scholar]
- 45.Ritter CO, Wilke A, Wichmann T, Beer M, Hahn D, Kostler H. Comparison of intravascular and extracellular contrast media for absolute quantification of myocardial rest-perfusion using high-resolution MRI. J Magn Reson Imaging. 2011;33:1047–1051. doi: 10.1002/jmri.22557. [DOI] [PubMed] [Google Scholar]
- 46.Wagner M, Rosler R, Lembcke A, et al. Whole-heart coronary magnetic resonance angiography at 1.5 tesla: Does a blood-pool contrast agent improve diagnostic accuracy? Invest Radiol. 2011;46:152–159. doi: 10.1097/RLI.0b013e3181fac6ef. [DOI] [PubMed] [Google Scholar]
- 47.Noeske R, Seifert F, Rhein KH, Rinneberg H. Human cardiac imaging at 3 T using phased array coils. Magn Reson Med. 2000;44:978–982. doi: 10.1002/1522-2594(200012)44:6<978::aid-mrm22>3.0.co;2-9. [DOI] [PubMed] [Google Scholar]
- 48.Zhao J, Clingman C, Narvainen M, Kauppinen R, van Zijl P. Oxygenation and hematocrit dependence of transverse relaxation rates of blood at 3T. Magn Reson Med. 2007;58:592–597. doi: 10.1002/mrm.21342. [DOI] [PubMed] [Google Scholar]
- 49.Zaman A, Higgins DM, Kouwenhoven M, Kidambi A, Greenwood JP, Plein S. Robust myocardial T2 and T2* mapping at 3T. J Cardiovasc Magn Reson. 2012;14(Suppl. 1):P306. doi: 10.1002/jmri.24636. [DOI] [PubMed] [Google Scholar]
- 50.Stanisz GJ, Odrobina EE, Pun J, Escaravage M, Graham SJ, Bronskill MJ, Henkelman RM. T1, T2 relaxation and magnetization transfer in tissue at 3T. Magn Reson Med. 2005;54:507–512. doi: 10.1002/mrm.20605. [DOI] [PubMed] [Google Scholar]
- 51.Brasch RC. Rationale and applications for macromolecular Gd-based contrast agents. Magn Reson Med. 1991;22:282–287. doi: 10.1002/mrm.1910220225. [DOI] [PubMed] [Google Scholar]
- 52.Bane O, Lee DC, Benefield B, Markl M, Carr J, Carroll TJ. A pilot study of leakage and compartmentalization of the contrast agent Ablavar. J Cardiovasc Magn Reson. 2013;15(Suppl. 1):E7. [Google Scholar]
- 53.Rothschild M, Oratz M, Schreiber S. Albumin synthesis. N Engl J Med. 1972;286:748–757. doi: 10.1056/NEJM197204062861404. [DOI] [PubMed] [Google Scholar]
- 54.Fogh-Andersen N, Altura BM, Altura BT, Siggaardandersen O. Composition of interstitial fluid. Clin Chem. 1995;41:1522–1525. [PubMed] [Google Scholar]
- 55.Kellman P, Wilson JR, Xue H, Bandettini WP, Shanbhag SM, Druey KM, Ugander M, Arai AE. Extracellular volume fraction mapping in the myocardium, part 2: Initial clinical experience. J Cardiovasc Magn Reson. 2012;14:64. doi: 10.1186/1532-429X-14-64. [DOI] [PMC free article] [PubMed] [Google Scholar]
- 56.Broadbent DA, Biglands JD, Larghat A, Sourbron SP, Radjenovic A, Greenwood JP, Plein S, Buckley DL. Myocardial blood flow at rest and stress measured with dynamic contrast-enhanced MRI: Comparison of a distributed parameter model with a Fermi function model. Magn Reson Med. 2013;70:1591–1597. doi: 10.1002/mrm.24611. [DOI] [PubMed] [Google Scholar]
- 57.Pickup S, Wood AK, Kundel HL. Gadodiamide T1 relaxivity in brain tissue in vivo is lower than in saline. Magn Reson Med. 2005;53:35–40. doi: 10.1002/mrm.20336. [DOI] [PubMed] [Google Scholar]
- 58.Notohamiprodjo M, Pedersen M, Glaser C, Helck AD, Lodemann K-P, Jespersen B, Fischereder M, Reiser MF, Sourbron SP. Comparison of Gd-DTPA and Gd-BOPTA for studying renal perfusion and filtration. J Magn Reson Imaging. 2011;34:595–607. doi: 10.1002/jmri.22640. [DOI] [PubMed] [Google Scholar]
- 59.Henrotte V, Vander Elst L, Laurent S, Muller RN. Comprehensive investigation of the non-covalent binding of MRI contrast agents with human serum albumin. J Biol Inorg Chem. 2007;12:929–937. doi: 10.1007/s00775-007-0247-5. [DOI] [PubMed] [Google Scholar]
- 60.Alford JK, Rutt BK, Scholl TJ, Handler WB, Chronik BA. Delta relaxation enhanced MR: Improving activation - specificity of molecular probes through R1 dispersion imaging. Magn Reson Med. 2009;61:796–802. doi: 10.1002/mrm.21933. [DOI] [PubMed] [Google Scholar]
- 61.Alford JK, Sorensen AG, Benner T, Chronik AB, Handler BW, Scholl JT, Madan G, Caravan P. Direct protein imaging of inflammation in the human hand. Canada: 19th Annual Meeting of ISMRM, Montreal; 2011. In Proceedings of the. Abstract 452. [Google Scholar]