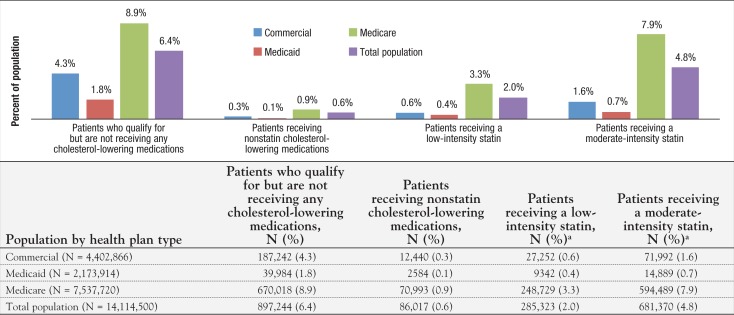
In the article “Impact of the New ACC/AHA Guidelines on the Treatment of High Blood Cholesterol in a Managed Care Setting” published in November 2014 (Vol 7, No 8, pages 430–443), the study period was January 1, 2013, to December 31, 2013, rather than November 1, 2012, to October 31, 2013. In addition, the total study population was 14,114,500, rather than 25,705,722; the commercial population was 4,402,866, rather than 14,661,302; the Medicaid population was 2,173,914, rather than 3,313,910; and the Medicare population was 7,537,720, rather than 7,730,510. These population data affect the percentages cited in the body of the article and are also appearing in Table 3, Table 4, and Figure 2, which are corrected below. The overall results and conclusion of the study have not been affected. The article is corrected at www.AHDBonline.com.
Table 3.
Baseline Cholesterol-Lowering Medication Utilization
| Patients receiving cholesterol-lowering medications | Patients in a commercial plan, N (%) (N = 4,402,866) | Patients in a Medicaid plan, N (%) (N = 2,173,914) | Patients in a Medicare plan, N (%) (N = 7,537,720) | Total population, N (%) (N = 14,114,500) | |
|---|---|---|---|---|---|
| Statin users, by dosing intensitya | Low-intensity statin | 54,503 (13.20) | 18,684 (21.90) | 497,458 (14.60) | 570,645 (14.60) |
| Moderate-intensity statin | 287,968 (69.80) | 59,556 (69.70) | 2,377,955 (69.70) | 2,725,480 (69.70) | |
| High-intensity statin | 70,329 (17.00) | 7196 (8.40) | 535,758 (15.70) | 613,283 (15.70) | |
| Total | 412,800 (9.380) | 85,436 (3.93) | 3,411,171 (45.25) | 3,909,407 (27.70) | |
| Statin and nonstatin cholesterol-lowering medication usersb | Total | 45,327 (1.030) | 10,159 (0.47) | 364,656 (4.84) | 420,142 (2.98) |
| Nonstatin cholesterol-lowering medication users | Bile acid–binding resins | 10,285 (12.39) | 1629 (9.06) | 92,151 (15.89) | 104,065 (15.29) |
| Cholesterol absorption inhibitors | 13,800 (16.62) | 1573 (8.74) | 141,624 (24.43) | 156,997 (23.06) | |
| Fibrates | 42,835 (51.59) | 12,430 (69.09) | 279,033 (48.13) | 334,298 (49.10) | |
| Niacin | 10,300 (12.41) | 2120 (11.78) | 64,621 (11.15) | 77,041 (11.32) | |
| Omega-3 fatty acids | 15,204 (18.31) | 1899 (10.56) | 62,893 (10.85) | 79,996 (11.75) | |
| Total | 83,024 (1.89) | 17,990 (0.83) | 579,786 (7.69) | 680,800 (4.82) | |
| All cholesterol-lowering medication usersc | Total | 450,497 (10.23) | 93,267 (4.29) | 3,626,301 (48.11) | 4,170,065 (29.54) |
| Patients aged 40–75 years not receiving cholesterol-lowering medications | |||||
| With diabetes | 48,796 (3.00) | 15,211 (5.10) | 213,098 (8.70) | 277,105 (6.40) | |
| With hypertension claims but no diabetes | 230,743 (14.40) | 41,289 (13.90) | 761,533 (31.20) | 1,033,565 (23.80) | |
| Overall total | 1,605,973 (36.48) | 297,051 (13.66) | 2,442,821 (32.41) | 4,345,845 (30.79) | |
See Table 1 for statin dosing intensity definitions.
These patients are receiving a statin and a nonstatin cholesterol-lowering medication, and these counts are not mutually exclusive of the patients counted under the statin and the nonstatin cholesterol-lowering medication user groups.
Unique members who are receiving any cholesterol-lowering medications.
Table 4.
Projected Cholesterol-Lowering Medications Utilization
| Patients receiving cholesterol-lowering medications | Patients in a commercial plan, N (%) (N = 4,402,866) | Patients in a Medicaid plan, N (%) (N = 2,173,914) | Patients in a Medicare plan, N (%) (N = 7,537,720) | Total population, N (%) (N = 14,114,500) | |
|---|---|---|---|---|---|
| Statin users, by dosing intensitya | Low-intensity statin | 27,252 (4.4) | 9342 (7.3) | 248,729 (6.0) | 285,323 (5.8) |
| Moderate-intensity statin | 392,928 (64.2) | 90,642 (70.8) | 2,566,826 (61.8) | 3,050,396 (62.3) | |
| High-intensity statin | 192,302 (31.4) | 28,021 (21.9) | 1,336,627 (32.2) | 1,556,950 (31.8) | |
| Total | 612,482 (13.91) | 128,005 (5.89) | 4,152,182 (55.09) | 4,892,668 (34.66) | |
| Statin and nonstatin cholesterol-lowering medication usersb | Total | 0 (0) | 0 (0) | 0 (0) | 0 (0) |
| Nonstatin cholesterol-lowering medication users | Bile acid–binding resins | 5667 (22.4) | 1000 (19.1) | 48,163 (33.4) | 54,831 (31.4) |
| Cholesterol absorption inhibitors | 4801 (19.0) | 378 (7.2) | 41,549 (28.8) | 46,728 (26.8) | |
| Fibrates | 13,270 (52.5) | 4204 (80.1) | 77,550 (53.8) | 95,024 (54.4) | |
| Niacin | 3901 (15.4) | 790 (15.1) | 21,231 (14.7) | 25,922 (14.8) | |
| Omega-3 fatty acids | 7018 (27.8) | 535 (10.2) | 16,180 (11.2) | 23,733 (13.6) | |
| Total | 25,257 (0.57) | 5247 (0.24) | 144,137 (1.91) | 174,641 (1.24) | |
| All cholesterol-lowering medication usersc | Total | 637,739 (14.48) | 133,252 (6.13) | 4,296,319 (57.00) | 5,067,309 (35.90) |
| Patients aged 40–75 years not receiving cholesterol-lowering medications | |||||
| With diabetes claims | 0 (0) | 0 (0) | 0 (0) | 0 (0) | |
| With hypertension claims, but no diabetes medication claim | 92,297 (6.51) | 16,516 (6.42) | 304,613 (17.18) | 413,426 (11.99) | |
| Overall total | 1,418,731 (32.22) | 257,067 (11.83) | 1,772,803 (23.52) | 3,448,601 (24.43) | |
See Table 1 for statin dosing intensity definitions.
These patients are receiving a statin and a nonstatin cholesterol-lowering medication, and these counts are not mutually exclusive of the patients counted under the statin and the nonstatin cholesterol-lowering medication user groups.
Unique members who are receiving any cholesterol-lowering medications.
Figure 2. Projected Percentage of the Population Starting Statin Therapy or Switching to Higher-Intensity Statin Therapy.
See Table 1 for statin dosing intensity information.


