Abstract
Despite recent advances, the structures of many proteins cannot be determined by electron cryomicroscopy because the individual proteins move during irradiation. This blurs the images so they cannot be aligned with each other to calculate a 3D density. Much of this movement stems from instabilities in the carbon substrates used to support frozen samples in the microscope. Here we demonstrate a new gold specimen support that nearly eliminates substrate motion during irradiation. This increases the sub-nanometer image contrast such that α-helices of individual proteins are resolved. With this improvement we determine the structure of apoferritin, a smooth, octahedral shell of α–helical subunits that is particularly difficult to solve by electron microscopy. This advance in substrate design will enable the solution of currently intractable protein structures.
Recent developments in electron cryomicroscopy (cryo-EM) have allowed structure determination to near-atomic resolution for some macromolecular complexes (1–3). Still, many small and challenging structures cannot be determined by current cryo-EM methods to the resolutions required for accurate modeling of atomic structure. This is because electron micrograph quality still falls short of the physical limits imposed by radiation damage to the macromolecules (4–6). Reduced image quality likely has two primary origins: Inefficient detection of imaging electrons (6, 7), and motion and blurring of the particles during irradiation (6,8–11). Recent developments in electron detectors have addressed the first constraint (12,13), and have enabled the development of motion correction algorithms to ameliorate the effects of the second (14–16). Direct electron detectors can acquire images using fractions of the electron dose previously required, thus allowing the measurement of single molecule positions in time. This allows accurate tracking of large ensembles of particles, and offers a way to determine the physical origins of radiation-induced particle movement (14–17).
Conventional amorphous carbon (am-C) substrates undergo bending and deformation during irradiation (9,11), which includes movement both parallel and perpendicular to the substrate plane. Incorporation of titanium-silicon, doped silicon carbide or graphene into substrate designs reduced radiation-induced specimen motion (17–19). Still these designs did not stop substrate movement and are challenging to manufacture and use. Here, we demonstrate a new cryo-EM support that nearly eliminates the radiation-induced deformation of thin, ice-embedded specimens at cryogenic temperatures. This curtails the perpendicular and in-plane components of motion during imaging, and thus improves image quality for all radiation-sensitive cryogenic specimens.
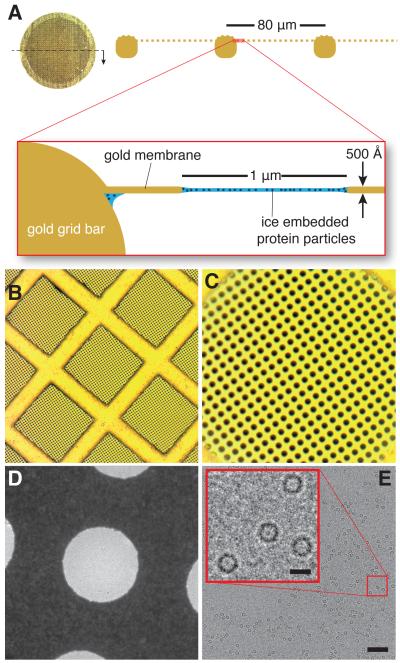
The support comprises a regular array of micron sized holes in a ≃500 Å thick foil of gold (Fig. 1 and fig. S1). The foil is suspended across a mesh grid, also composed of gold, with square holes about 80 μm wide. It differs from standard amorphous carbon (am-C) supports only in the choice of materials and the thickness of the perforated foil. We chose gold because it is a highly conductive, non-oxidizing, radiation hard material whose surface is chemically inert and bio-compatible. Furthermore, making the foil and grid entirely out of the same metal ensures uniform electrical conductivity and prevents differential thermal contraction during cooling from 300 to 80 K, thus maintaining the geometry and tension of the support foil during use.
Fig. 1. Ultra-stable substrate design.
The ultra-stable gold support comprises a 3 mm diameter disc of gold mesh (A) where a ≃500 Å thick layer of gold foil with a regular array of micron sized holes is suspended across the square openings in the mesh (diagramed along the section indicated). After application of an aqueous protein sample and plunge freezing at ≃80K, each hole contains a thin film of protein particles embedded in vitrified ice. Panels A, B and C show optical micrographs of the gold grid at low, medium and high magnification respectively; each hole is 1.2 μm in diameter and sets the scale for B-D. Panel D is a transmission electron micrograph of an individual 1.2 μm hole containing vitrified ice. Panel E is a typical high-resolution electron micrograph of apoferritin suspended in ice on a gold grid. Scale bars for the micrograph and magnified inset are 1200 Å and 120 Å respectively.
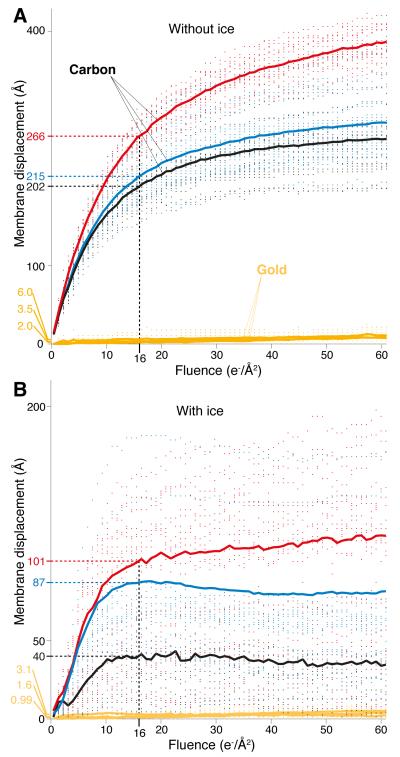
To characterize performance, we first measured the vertical motion of tilted gold substrates, without ice, under irradiation using standard cryogenic conditions (Fig. 2A and Movie S1). Compared to commercial am-C supports with nearly identical geometry, there was a 60-fold reduction in substrate displacement (228 Å vs. 3.8 Å) in a typical fluence used for high-resolution cryo-EM (16 e−/Å2). Next, we compared the vertical motion of the gold and am-C substrates when supporting a typical layer of thin ice used to image proteins (Fig. 2B). Adding the layer of ice stabilized both the am-C and gold supports but there was still a 40-fold reduction in movement on gold compared to am-C (76 Å vs. 1.9 Å).
Fig. 2. Reduced motion of gold substrates under high-energy electron irradiation.
Panel A shows measurements of the vertical motion of am-C and gold supports under typical cryo-EM illumination conditions (300 keV, 16 e−/Å2/s and 80K). Each point is the magnitude of vertical displacement of the edge of a particular hole in the foil relative to its initial position before electron irradiation. Each solid line is the root mean square displacement for multiple holes in multiple squares of one grid. When a typical thin layer of vitreous ice is present (B), the vertical motion of both substrates is reduced about two-fold and the motion on am-C becomes more complicated in nature.
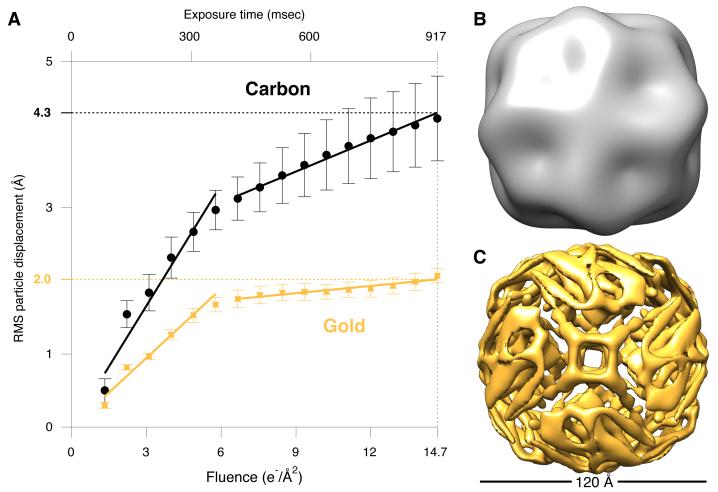
To characterize the in-plane motion (parallel to the plane of the support) of proteins suspended in ice on gold substrates, we made test samples using 80S ribosomes and tracked them under standard imaging conditions. We analyzed a large ensemble of particle trajectories and compared these to previously published data on other substrates (Fig. 3A and fig. S2) (17). Particles generally exhibit two phases of motion during irradiation – a faster phase during the first ~ 4e−/Å2 followed by a slower phase; both are significantly reduced using gold (by ≃40% and ≃80% respectively). This shows that much of the first phase and most of the second phase of particle motion is due to the support. On the gold substrate, the signal in the second part of the exposure approaches the physical limits imposed by damage and detector efficiency (fig. S3). Based on these experiments, we posit that reducing the vertical motion of the support by 50-fold reduces the total in-plane motion of the particles by 2-fold, where the coupling between the vertical and in-plane motion is due to bending of the irradiated region. We include a model of substrate deformation accounting for this in the supplement (fig. S4).
Fig. 3. Reduced particle motion and improved resolution on ultra-stable grids.
(A) 80S ribosomes were tracked during electron irradiation, using the same imaging conditions, for particles supported on three different am-C grids (black circles (17)) and three different gold grids (gold crosses). Each point is the in-plane ensemble average displacement of a particle from its initial position, and the error bars are the s.e.m. for the multiple grids tested. Solid lines are linear fits to the two phases of motion, where the slopes are the average speeds of the particles. There was a 43% reduction in the speed of the first phase (8.8 Å/s to 5.0 Å/s) and a 77% reduction in the speed of the second phase (2.3 Å/s to 0.53 Å/s) on gold relative to am-C. Density maps of apoferritin processed identically from data collected using identical conditions for am-C (B) and gold (C) substrates. Map (B) has a resolution of 25 Å (gold-std. FSC) and contains no discernible information beyond that present in the initial model. Compare to (C) with a resolution of 8.0 Å which resolves the entire molecular chain.
A reduction in motion directly improves the quality of the images. We quantify this using statistical analysis of tilt-pair images of ribosomes (20) collected on the different supports (fig. S5). These data demonstrate a 140% improvement in κ, which is a direct measure of the quality of the images. This corresponds to a 35% improvement in the accuracy of the angles assigned to the individual images during 3D reconstruction (fig. S5C), which is crucial for solving macromolecular structures. Given a high-quality protein preparation, angular accuracy and the isotropic coverage of the information content in Fourier space are the primary factors that determine whether and how accurately a structure can be determined by cryo-EM.
To further assess the performance of gold supports, we determined the structure of apoferritin, a small protein (18 kDa) that assembles into a smooth, spherical complex (440 kDa). The ferritins are a class of iron storage proteins that are conserved throughout evolution, and whose characteristic structural motif is a bundle of four α-helices (21,22). Apoferritin has remained intractable to structure determination by cryo-EM – even using the new generation of electron detectors – because the contrast in individual particle images was insufficient to resolve α–helices, which is required to align the images with each other (6, 23). We collected data on gold and am-C supports prepared identically, with identical geometry and imaging conditions, on the same day on the same microscope equipped with a back-thinned direct electron detector, and processed the resulting four thousand particles from each support type identically (Fig. 3B-C). The images of apoferritin on am-C are still too blurred for correct alignment, resulting in a 3D density map which is no better than the initial model (resolution ≃25 Å); the reduced motion of the proteins on the gold grids improves the images enough that the orientations are correctly assigned, yielding a map which resolves the entire molecular chain (≃8 Å).
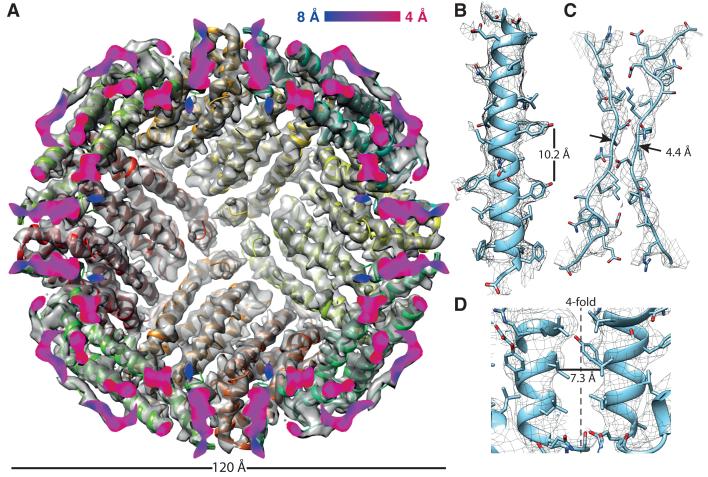
We collected a larger dataset of about six thousand particles using the gold support. This yielded a reconstruction with a resolution of ~7Å (fig. S6). We suspected that conformational heterogeneity was limiting the resolution of the reconstruction. Using 3D classification (24), we were able to isolate a subset of 483 particles (11 592 asymmetric units) where a flexible loop on the exterior of the complex was positioned along the dimer interface, although we cannot exclude the possibility that the classification process may also have selected for particles which happened to move less during imaging. This improved the map (Fig. 4) and brought the resolution of the reconstruction to 4.7 Å (fig. S7).
Fig. 4. The structure of apoferritin from 483 single particle images.
(A) The previously published X-ray crystal structure is fit to the cryo-EM density map, and the density is cut in half along the plane defined by two of the four-fold symmetry axes to reveal the interior of the complex. The cut surface shows the local resolution of the density using the color scale as indicated. (B) View of one of the α–helices showing clear side chain density. (C) View along the twofold symmetry axis showing clear separation between the β–strands. (D) Section parallel to the fourfold pore axis showing the corrugated density of the residues in the interior of the pore.
The final map shows clearly identifiable density for the larger side chains, distinct separation of the β-strands along the dimerization interface, and the molecular surface within the pore along the fourfold axis (Fig. 4B-D). We found a region of extra density at the C-terminus (fig. S8) corresponding to three amino acids in the protein sequence which were not modeled in the crystal structure (25). Refinement of an atomic model against the map also suggests an alternate conformation of the molecule relative to the crystal structure (fig. S7A).
The improved stability and image quality of gold substrates is not due to the mechanical strength of the suspended foil (fig. S9), but instead is likely due to preservation of the tension in the membrane during the cooling process, combined with the radiation hardness and high conductivity of the gold film at cryogenic temperatures. Substrates which reduce radiation-induced motion will improve the images from every microscope, not just those equipped with a direct electron detector or high-speed frame capture hardware and processing algorithms. We expect that the fifty-fold reduction in the vertical motion of the gold substrates will also enable electron tomography at increased resolutions, as images of tilted specimens are more severely impacted by the vertical motion of the substrate. The methods herein will allow one to solve the structures of many proteins previously refractory to structural analysis, including other ferritins which could not be solved by x-ray crystallography.
There remains one to two angstroms of in-plane motion during the first 4 e−/Å2 on gold substrates. These first few electrons are critical as they potentially contain the most high-resolution information (26, 27). Future work will focus on substrate design and image acquisition conditions to reduce the initial motion even more. This, along with further improvements in electron detector efficiency will bring cryo-EM to the physical limits imposed by the homogeneity of the protein preparation, the electron scattering cross-sections of the biological specimen (4) and the counting statistics of detecting individual electrons. We anticipate that high-efficiency, stationary particle imaging will allow: 1. measurement and modeling of the progressive damage to the primary and secondary structure of the molecules, 2. improved refinements using dose-fractionation that includes the use of tilt and 3. direct modeling and refinement of molecular structure from particle images. This will enable routine structure determination for many molecules and complexes that are currently too difficult to be practical.
Supplementary Material
ACKNOWLEDGMENTS
We are grateful to R. Henderson for guidance and advice throughout this project. We thank D. Mills and W. Kühlbrandt for the use of the Polara electron microscope at the MPI Frankfurt and I. Sanchez Fernandez and the V. Ramakrishnan lab for the gift of ribosomes. We are grateful for technical assistance from G. McMullan, S. Chen, C. Savva, J. Grimmett, T. Darling and M. Skehel, thank our colleagues at the LMB, especially S. Scheres, G. Murshudov and R.A. Crowther, for many helpful discussions, and thank R.A. Crowther, V. Ramakrishnan and E. Rajendra for a critical reading of the manuscript. This work was supported by the European Research Council under the European Union’s Seventh Framework Programme (FP7/2007-2013)/ERC grant agreement no. 261151 and Medical Research Council grant U105192715. CJR and LAP are inventors on a patent application on the gold substrates. The coordinates of the refined apoferritin model are deposited in the Protein Data Bank under accession code 4v1w and the EM density map is deposited in the Electron Microscopy Database under accession code 2788.
References and Notes
- 1.Amunts A, et al. Structure of the yeast mitochondrial large ribosomal subunit. Science. 2014;343:1485–1489. doi: 10.1126/science.1249410. [DOI] [PMC free article] [PubMed] [Google Scholar]
- 2.Liao M, Cao E, Julius D, Cheng Y. Structure of the TRPV1 ion channel determined by electron cryo-microscopy. Nature. 2014;504:107–112. doi: 10.1038/nature12822. [DOI] [PMC free article] [PubMed] [Google Scholar]
- 3.Allegretti M, Mills DJ, McMullan G, Kuhlbrandt W, Vonck J. Atomic model of the F420-reducing [NiFe] hydrogenase by electron cryo-microscopy using a direct electron detector. eLife. 2014;3:e01963–e01963. doi: 10.7554/eLife.01963. [DOI] [PMC free article] [PubMed] [Google Scholar]
- 4.Henderson R. The potential and limitations of neutrons, electrons and X-rays for atomic resolution microscopy of unstained biological molecules. Q. Rev. Biophys. 1995;28:171–193. doi: 10.1017/s003358350000305x. [DOI] [PubMed] [Google Scholar]
- 5.Rosenthal PB, Henderson R. Optimal determination of particle orientation, absolute hand, and contrast loss in single-particle electron cryomicroscopy. J. Mol. Biol. 2003;333:721–745. doi: 10.1016/j.jmb.2003.07.013. [DOI] [PubMed] [Google Scholar]
- 6.Henderson R, McMullan G. Problems in obtaining perfect images by single-particle electron cryomicroscopy of biological structures in amorphous ice. Microscopy. 2013;62:43–50. doi: 10.1093/jmicro/dfs094. [DOI] [PMC free article] [PubMed] [Google Scholar]
- 7.Faruqi A, et al. Direct single electron detection with a CMOS detector for electron microscopy. Nucl. Instrum. Methods. 2005;546:170–175. [Google Scholar]
- 8.Henderson R, Glaeser RM. Quantitative analysis of image contrast in electron micrographs of beam-sensitive crystals. Ultramicroscopy. 1985;16:139–150. [Google Scholar]
- 9.Wright ER, Iancu CV, Tivol WF, Jensen GJ. Observations on the behavior of vitreous ice at ≃82 and ≃12K. J. Struct. Biol. 2006;153:241–252. doi: 10.1016/j.jsb.2005.12.003. [DOI] [PubMed] [Google Scholar]
- 10.Glaeser RM, McMullan G, Faruqi AR, Henderson R. Images of paraffin monolayer crystals with perfect contrast: minimization of beam-induced specimen motion. Ultramicroscopy. 2011;111:90–100. doi: 10.1016/j.ultramic.2010.10.010. [DOI] [PMC free article] [PubMed] [Google Scholar]
- 11.Brilot AF, et al. Beam-induced motion of vitrified specimen on holey carbon film. J. Struct. Biol. 2012;177:630–637. doi: 10.1016/j.jsb.2012.02.003. [DOI] [PMC free article] [PubMed] [Google Scholar]
- 12.McMullan G, Chen S, Henderson R, Faruqi AR. Detective quantum efficiency of electron area detectors in electron microscopy. Ultramicroscopy. 2009;109:1126–1143. doi: 10.1016/j.ultramic.2009.04.002. [DOI] [PMC free article] [PubMed] [Google Scholar]
- 13.McMullan G, Faruqi AR, Clare D, Henderson R. Comparison of optimal performance at 300 keV of three direct electron detectors for use in low dose electron microscopy. Ultramicroscopy. 2014;147:156–163. doi: 10.1016/j.ultramic.2014.08.002. [DOI] [PMC free article] [PubMed] [Google Scholar]
- 14.Campbell MG, et al. Movies of ice-embedded particles enhance resolution in electron cryo-microscopy. Structure. 2012;20:1823–1828. doi: 10.1016/j.str.2012.08.026. [DOI] [PMC free article] [PubMed] [Google Scholar]
- 15.Bai X-C, Fernandez IS, McMullan G, Scheres SH. Ribosome structures to near-atomic resolution from thirty thousand cryo-EM particles. eLife. 2013;2:e00461. doi: 10.7554/eLife.00461. [DOI] [PMC free article] [PubMed] [Google Scholar]
- 16.Li X, et al. Electron counting and beam-induced motion correction enable near-atomic-resolution single-particle cryo-EM. Nat. Methods. 2013;10:584–590. doi: 10.1038/nmeth.2472. [DOI] [PMC free article] [PubMed] [Google Scholar]
- 17.Russo CJ, Passmore LA. Controlling protein adsorption on graphene for cryo-EM using low-energy hydrogen plasmas. Nat. Methods. 2014;11:649–652. doi: 10.1038/nmeth.2931. [DOI] [PMC free article] [PubMed] [Google Scholar]
- 18.Rhinow D, Kühlbrandt W. Electron cryo-microscopy of biological specimens on conductive titanium-silicon metal glass films. Ultramicroscopy. 2008;108:698–705. doi: 10.1016/j.ultramic.2007.11.005. [DOI] [PubMed] [Google Scholar]
- 19.Yoshioka C, Carragher B, Potter CS. Cryomesh: a new substrate for cryo-electron microscopy. Microsc. Microanal. 2010;16:43–53. doi: 10.1017/S1431927609991310. [DOI] [PMC free article] [PubMed] [Google Scholar]
- 20.Russo CJ, Passmore LA. Robust evaluation of 3D electron cryomicroscopy data using tilt-pairs. J. Struct. Biol. 2014;187:112–118. doi: 10.1016/j.jsb.2014.06.006. [DOI] [PMC free article] [PubMed] [Google Scholar]
- 21.Banyard SH, Stammers DK, Harrison PM. Electron density map of apoferritin at 2.8 Å resolution. Nature. 1978;271:282–284. doi: 10.1038/271282a0. [DOI] [PubMed] [Google Scholar]
- 22.Crichton RR, Declercq J-P. X-ray structures of ferritins and related proteins. Biochim. Biophys. Acta. 2010;1800:706–718. doi: 10.1016/j.bbagen.2010.03.019. [DOI] [PubMed] [Google Scholar]
- 23.Massover WH. Ultrastructure of ferritin and apoferritin: a review. Micron. 1993;24:389–437. [Google Scholar]
- 24.Scheres SHW. RELION: implementation of a bayesian approach to cryo-EM structure determination. J. Struct. Biol. 2012;180:519–530. doi: 10.1016/j.jsb.2012.09.006. [DOI] [PMC free article] [PubMed] [Google Scholar]
- 25.de Val N, Declercq J-P, Lim CK, Crichton RR. Structural analysis of haemin demetallation by L-chain apoferritins. J. Inorg. Biochem. 2012;112:77–84. doi: 10.1016/j.jinorgbio.2012.02.031. [DOI] [PubMed] [Google Scholar]
- 26.Baumeister W, Hahn M, Seredynski J, Herbertz LM. Radiation damage of proteins in the solid state: changes of amino acid composition in catalase. Ultramicroscopy. 1976;1:377–382. doi: 10.1016/0304-3991(76)90052-8. [DOI] [PubMed] [Google Scholar]
- 27.Stark H, Zemlin F, Boettcher C. Electron radiation damage to protein crystals of bacteriorhodopsin at different temperatures. Ultramicroscopy. 1996;63:75–79. [Google Scholar]
- 28.Hutter JL, Bechhoefer J. Calibration of atomic-force microscope tips. Rev. Sci. Instrum. 1993;64:1868. [Google Scholar]
- 29.Schneider CA, Rasband WS, Eliceiri KW. NIH Image to ImageJ: 25 years of image analysis. Nat. Methods. 2012;9:671–675. doi: 10.1038/nmeth.2089. [DOI] [PMC free article] [PubMed] [Google Scholar]
- 30.Mindell JA, Grigorieff N. Accurate determination of local defocus and specimen tilt in electron microscopy. J. Struct. Biol. 2003;142:334–347. doi: 10.1016/s1047-8477(03)00069-8. [DOI] [PubMed] [Google Scholar]
- 31.Henderson R, et al. Tilt-pair analysis of images from a range of different specimens in single-particle electron cryomicroscopy. J. Mol. Biol. 2011;413:1028–1046. doi: 10.1016/j.jmb.2011.09.008. [DOI] [PMC free article] [PubMed] [Google Scholar]
- 32.Scheres SH. Beam-induced motion correction for sub-megadalton cryo-EM particles. eLife. 2014;3:e03665. doi: 10.7554/eLife.03665. [DOI] [PMC free article] [PubMed] [Google Scholar]
- 33.Granier T, Gallois B, Dautant A, Langlois d’Estaintot B, Précigoux G. Comparison of the structures of the cubic and tetragonal forms of horse-spleen apoferritin. Acta Crystallogr. D. 1997;53:580–587. doi: 10.1107/S0907444997003314. [DOI] [PubMed] [Google Scholar]
- 34.Lu P, et al. Three-dimensional structure of human γ-secretase. Nature. 2014;512:166–170. doi: 10.1038/nature13567. [DOI] [PMC free article] [PubMed] [Google Scholar]
- 35.Marabini R, et al. Xmipp: An image processing package for electron microscopy. J. Struct. Biol. 1996;116:237–240. doi: 10.1006/jsbi.1996.0036. [DOI] [PubMed] [Google Scholar]
- 36.Kucukelbir A, Sigworth FJ, Tagare HD. Quantifying the local resolution of cryo-EM density maps. Nat. Methods. 2014;11:63–65. doi: 10.1038/nmeth.2727. [DOI] [PMC free article] [PubMed] [Google Scholar]
- 37.Vagin A, Teplyakov A. MOLREP: an automated program for molecular replacement. J. Appl. Crystallogr. 1997;30:1022–1025. [Google Scholar]
- 38.Murshudov GN, et al. REFMAC5 for the refinement of macromolecular crystal structures. Acta Crystallogr. D. 2011;67:355–367. doi: 10.1107/S0907444911001314. [DOI] [PMC free article] [PubMed] [Google Scholar]
- 39.Pettersen EF, et al. UCSF chimera–a visualization system for exploratory research and analysis. J. Comput. Chem. 2004;25:1605–1612. doi: 10.1002/jcc.20084. [DOI] [PubMed] [Google Scholar]
- 40.Landau LD, Lifshitz EM. Theory of Elasticity vol. 3 of Course of Theoretical Physics. third edn Butterworth Heinemann; 1986. [Google Scholar]
Associated Data
This section collects any data citations, data availability statements, or supplementary materials included in this article.


