

Abstract
Aims/Introduction
Despite the use of intensive therapies, declining renal function is often observed during the overt nephropathy stage of type 2 diabetes. We aimed at investigating the role of serum uric acid (SUA) levels at the onset of overt nephropathy in the risk of renal function decline in type 2 diabetes patients.
Materials and Methods
The present cohort study included 290 type 2 diabetes patients who were followed from the onset of overt nephropathy. The relationship between SUA and declining renal function was assessed using Cox regression models after adjusting for known risk factors.
Results
Over a median 4.8-year follow-up period, 85 patients (4.9/100 person-years) showed serum creatinine (Cr) doubling with a total cumulative incidence of 71.9% at 20 years of follow up. The highest SUA tertile resulted in significantly a higher incidence (7.7/100 person-years) and cumulative incidence at 20 years (85.7%) than the middle (3.9/100 person-years, 54.2%) and lowest (3.0/100 person-years, 55.5%) tertiles. The univariate Cox hazard model resulted in significant risks for Cr doubling related to female sex, short diabetes duration, smoking and elevated levels of low-density lipoprotein cholesterol (LDL-c), glycated hemoglobin and SUA tertiles. SUA tertiles remained statistically significant in the multivariate model (highest vs lowest hazard ratio 2.68, 95% confidence interval 1.48−5.00, P = 0.0009).
Conclusions
Elevated SUA levels within the normal range (men >6.3 mg/dL, women >5.1) at the onset of overt nephropathy resulted in an increased risk for declining renal function in type 2 diabetes patients.
Keywords: Risk factors, Type 2 diabetic nephropathy, Uric acid
Introduction
Nephropathy related to type 2 diabetes is one of the leading causes of end-stage renal disease (ESRD), and is also associated with an increased risk of cardiovascular morbidity and mortality. Over the past 15 years, it has emerged as the primary reason for initiating dialysis in Japan1. Modifiable factors, such as arterial blood pressure, albuminuria, glycemic control and lipid control, play a role in the progression of diabetic nephropathy2.
In the early microalbuminuria stage, intensive multifactorial therapy that includes glycemic, lipid and blood pressure control, in addition to smoking cessation, has induced remission and improved renal function3,4. There is little evidence of the contribution of these factors in the prevention of the progressive loss of renal function in advanced diabetic nephropathy5. The evidence is limited to the effect of hypertension management and a low-protein diet6. Despite the use of these intensive therapies, the loss of renal function progresses, after the onset of overt nephropathy, to ESRD in the majority of cases. One study reported that various early biomarkers are associated with the development of diabetic nephropathy7.
Recent studies have documented that elevated serum uric acid (SUA) levels are positively associated with the development of type 2 diabetes itself8. SUA is also associated with known risk factors for kidney disease progression9, including hypertension10, cardiovascular disease11–13 and atherosclerosis12. SUA has not been investigated as a risk factor for declining renal function in patients with type 2 diabetes who are at the onset of overt nephropathy, although SUA was previously reported in the early stage of diabetic nephropathy14.
The present study aimed to determine the role of SUA levels at the onset of overt nephropathy in the risk of renal function decline in patients with type 2 diabetes.
Methods
Study Design and Participants
The present study was a retrospective, observational cohort study of patients with type 2 diabetes attending the Institute for Adult Diseases, Asahi Life Foundation, Tokyo, Japan. The protocol was approved by the Committee of Ethics in this institution. Patients gave informed consent.
The inclusion criteria included the following: (i) aged ≥18 years; (ii) attending the hospital outpatient clinic for treatment of type 2 diabetes; (iii) diagnosis of diabetic nephropathy between January 1969 and December 2008.
Diabetic nephropathy was clinically diagnosed using the following criteria15: (i) diabetes duration >10 years; (ii) diabetic retinopathy before the onset of overt proteinuria; and (iii) persistent albuminuria with no evidence of other kidney or urological disease. The onset of overt nephropathy was defined as the data of first urinary albumin/creatinine ratio ≥300 mg/g creatinine (Cr) or positive proteinuria by dipstick analysis examination. The albuminuria or proteinuria was confirmed by repeated testing on a different day, and the follow-up period started. Diabetic retinopathy was diagnosed as retinal bleeding and was confirmed by an ophthalmologist. From these criteria, 313 patients were included.
The exclusion criteria included the following: (i) undefined history of nephropathy onset; (ii) patients with other kidney or urological disease; and (iii) patients with another cause of proteinuria, such as acute infectious disease and heart failure. Patients with hypertension were not excluded if there was no evidence of a causal role of hypertension in proteinuria.
We excluded 23 patients with an undefined history of nephropathy onset. The remaining 290 patients (231 men and 59 women, age 35−94 years, median follow-up period 4.8 years) comprised the sample for the present study, and were followed from the onset of nephropathy until October 2009. The patients were grouped according to changes in serum Cr from the baseline values: the Cr doubling group (doubling of serum Cr) and the non-doubling group.
Clinical Measurements
The following data were collected: age (years), body mass index (BMI; kg/m2), diabetes duration (years), systolic and diastolic blood pressure (mmHg), glycated hemoglobin (HbA1c; %), high-density lipoprotein-cholesterol (HDL-C; mg/dL), low-density lipoprotein-cholesterol (LDL-C; mg/dL), triglycerides (mg/dL), SUA (mg/dL), Cr (mg/dL), estimated glomerular filtration rate (eGFR; mL/[min·1.73 m2]), hemoglobin (g/dL), smoking status (yes/no) and medication usage. HbA1c values were converted as previously described16,17. A turbidimetric immunoassay (Code 468-34691; Wako Pure Chemical Industries, Ltd, Osaka, Japan) was used for the measurement of urinary albumin. The eGFR was calculated using the estimation formula advocated by the Japanese Society of Nephrology18: eGFR (mL/[min·1.73 m2]) = 194 × Cr−1.094 × age−0.287 (×0.739 for female patients). In the case of serum creatinine concentration being measured by Jaffe assay, the enzymatic value was estimated using the following equation: serum creatinine enzyme = 0.977 × serum creatinine Jaffe − 0.199 (given in mg/dL)19. Proteinuria was examined by dipstick analysis, semiquantitatively defined as ‘1+’, which indicated approximately 30 mg/dL, approximately 0.3 g/day urinary protein excretion; ‘2+’ 100 mg/dL, approximately 1 g/day; and ‘3+’ ≥300 mg/dL, approximately 3 g/day, respectively20. All laboratory data were measured under the right conditions (without gout and change of prescription).
Definitions
Decline in renal function was defined as the doubling of serum Cr. Hypertension was defined as a systolic blood pressure ≥130 mmHg and/or a diastolic blood pressure ≥80 mmHg and/or the current use of antihypertensive medication. Dyslipidemia was defined as a LDL-C level ≥120 mg/dL, HDL-C level <40 mg/dL and/or the current use of lipid-lowering medication. Hyperuricemia was defined as a SUA level ≥7.0 mg/dL for men or ≥6.0 mg/dL for women and/or the current use of antihyperuricemic medication.
Coronary heart disease (CHD) was defined as myocardial infarction, and angina pectoris was confirmed by coronary intervention. Stroke was defined as bleeding, and ischemic stroke included lacunae infarctions with symptoms confirmed by brain computed tomography (CT) or magnetic resonance imaging (MRI). Arteriosclerosis obliterans (ASO) was diagnosed using angiography with enhanced CT or MRI and/or an ankle-brachial pressure index (ABI) <0.9. Aortic calcification was confirmed by chest radiography.
Statistical Analysis
The data are expressed as mean ± standard deviation (SD). The differences between the two groups were assessed using unpaired Student's t-tests for continuous variables and chi-squared tests for categorical variables. The relationship between SUA levels and residual renal function (eGFR) was analyzed using Spearman's correlation analysis. SUA levels were stratified into tertiles, which were calculated separately for men (lower tertile: <310 μmol/L [5.2 mg/dL]; middle: 310−380 μmol/L [5.2−6.3 mg/dL]; upper: >380 μmol/L [6.3 mg/dL]) and women (lower tertile: <244 μmol/L [4.1 mg/dL]; middle: 244−303 μmol/L [4.1−5.1 mg/dL]; upper: >303 μmol/L [5.1 mg/dL], respectively), because SUA levels in women tend to be lower than those in men21.
Decline in renal function (doubling of serum Cr) was analyzed using the Kaplan–Meier method, and the significance was calculated using the log–rank test. Cox proportional hazards regression modeling was used to assess the independent risk factors for Cr doubling. The multivariate model accounted for baseline values of age (years), sex (men vs women), diabetes duration (years), smoking status (yes/no), BMI (kg/m2), HbA1c (%), systolic blood pressure (mmHg), LDL-C (mg/dL), use of medical agents (antiplatelet, antihyperuricemic, antihypertensive or lipid lowering medication), eGFR (mL/[min·1.73 m2]), proteinuria (1+, 2+, 3+) and SUA. These results are presented as hazard ratios (HR) with 95% confidence intervals (95% CI). HRs for continuous variables are described against a 1-SD change. Furthermore, P-values <0.05 were considered to be statistically significant. Analyses were carried out using JMP software (version 9.0; SAS Institute, Cary, NC, USA).
Power Calculation
We are planning a study with 96 experimental participants, 96 control participants, an accrual interval of 0 years, and additional follow up of a median of 4.8 years. In a previous study22, the median survival time on the control treatment was 5 years. If the true hazard ratio of control participants relative to experimental participants is 2, we will be able to reject the null hypothesis that the experimental and control survival curves are equal with probability (power) 0.871. The type I error probability associated with this test of the null hypothesis is 0.05.
Results
The demographic and clinical characteristics of the 290 patients at baseline are shown in Table1. The mean age of study participants was 61.9 ± 9.8 years, the mean diabetes duration was 18.0 ± 8.5 years and the mean duration of study follow up was 5.8 ± 4.1 years. The baseline biochemical and clinical characteristics of the patients in their respective groups (Cr doubling or non-doubling) are also shown in Table1. A total of 135 patients were treated with insulin, and 144 patients were treated with diet therapy and oral hypoglycemic drugs at the baseline. As compared with the non-doubling group, the Cr doubling group was significantly younger, with a significantly shorter duration of diabetes; however, the Cr doubling group showed a significantly more severe pathological state (higher HbA1c levels, more overt proteinuria, major angiopathy and higher SUA levels).
Table 1.
Demographics and clinical characteristics of participants at the start of follow up
| Total sample (n = 290) | Cr doubling group (n = 85) | Non-doubling group (n = 205) | P-valuea | |
|---|---|---|---|---|
| Male/female | 231/59 | 58/27 | 173/32 | |
| Age (years) | 61.9 ± 9.8 | 58.4 ± 1.0 | 63.3 ± 0.6 | <0.0001 |
| Diabetes duration (years) | 18.0 ± 8.5 | 14.6 ± 0.8 | 19.5 ± 0.5 | <0.0001 |
| Body mass index (kg/m2) | 23.9 ± 3.4 | 23.5 ± 0.3 | 24.0 ± 0.2 | 0.209 |
| Systolic BP (mmHg) | 139.6 ± 19.2 | 139.4 ± 2.0 | 139.6 ± 1.3 | 0.943 |
| Diastolic BP (mmHg) | 76.6 ± 11.7 | 77.1 ± 1.2 | 76.4 ± 0.8 | 0.659 |
| HbA1c (%) | 8.68 ± 1.85 | 9.6 ± 0.18 | 8.2 ± 0.12 | <0.0001 |
| HDL-C (mg/dL) | 52.1 ± 15.5 | 51.4 ± 1.69 | 52.3 ± 1.09 | 0.642 |
| LDL-C (mg/dL) | 118.7 ± 32.8 | 126.5 ± 3.5 | 115.5 ± 2.2 | 0.0088 |
| Triglycerides (mg/dL) | 162.1 ± 106.0 | 171.0 ± 11.5 | 158.4 ± 7.4 | 0.356 |
| Uric acid (mg/dL) | 5.47 ± 1.37 | 6.02 ± 0.14 | 5.25 ± 0.09 | <0.0001 |
| Creatinine (mg/dL) | 0.87 ± 0.24 | 0.82 ± 0.02 | 0.88 ± 0.01 | 0.062 |
| eGFR (mL/[min·1.73 m2]) | 80.4 ± 24.2 | 84.7 ± 2.6 | 78.7 ± 1.6 | 0.054 |
| Hemoglobin (g/dL) | 14.1 ± 1.5 | 13.9 ± 0.17 | 14.2 ± 0.11 | 0.054 |
| Proteinuria (1+, 2+, 3+) (%) | 41.4, 50.7, 7.9 | 41.1, 41.1, 17.6 | 41.4, 54.6, 3.9 | 0.0003 |
| Smoking status, % (n) | 45.5 (132) | 64.7 (55) | 37.5 (77) | <0.0001 |
| Hypertension, % (n) | 87.5 (254) | 83.5 (71) | 89.2 (183) | 0.177 |
| Dyslipidemia, % (n) | 73.7 (214) | 72.9 (62) | 74.1 (152) | 0.883 |
| Hyperuricemia, % (n) | 25.8 (75) | 44.7 (38) | 18.0 (37) | <0.0001 |
| Antiplatelet agent use, % (n) | 21.7 (63) | 18.8 (16) | 22.9 (47) | 0.532 |
| Antihypertensive agent use, % (n) | 66.5 (193) | 57.6 (49) | 70.2 (144) | 0.041 |
| Renin–angiotensin system inhibitors, % (n) | 46.2 (134) | 34.1 (29) | 51.2 (105) | 0.007 |
| Statin use, % (n) | 29.6 (86) | 20.0 (17) | 33.6 (69) | 0.023 |
| Antihyperuricemia agent use, % (n) | 9.6 (28) | 10.5 (9) | 9.2 (19) | 0.827 |
| CHD, % (n) | 16.8 (49) | 28.2 (24) | 12.2 (25) | 0.0017 |
| Stroke, % (n) | 14.4 (42) | 22.3 (19) | 11.2 (23) | 0.017 |
| ASO, % (n) | 9.3 (27) | 16.4 (14) | 6.3 (13) | 0.012 |
| Aortic calcification, % (n) | 16.2 (47) | 27.0 (23) | 11.71 (24) | 0.0025 |
ASO, arteriosclerosis obliterans; BP, blood pressure; CHD, coronary heart disease; eGFR, estimated glomerular filtration rate; HbA1c, glycated hemoglobin; HDL-C, high-density lipoprotein cholesterol; LDL-C, low-density lipoprotein cholesterol.
The statistical significance was estimated using independent Student's t-tests for continuous variables and chi-squared tests for categorical variables (P < 0.05). Comparisons were made between the creatinine (Cr) doubling group and the non-doubling group. Values are reported as mean ± standard deviation or as % (n), where indicated.
Figure1 shows the results of the Kaplan–Meier survival analysis for the incidence of Cr doubling. A total of 85 (29.3%) of the 290 patients showed Cr doubling during the follow-up period (median 4.8 years, range 0−22 years), resulting in an incidence of 4.9 out of 100 person-years and a total cumulative incidence of 71.9% at 20 years of follow up. Analysis according to the baseline SUA tertiles resulted in an incidence and cumulative incidence of Cr doubling at 20 years of 3.0 out of 100 person-years and 55.5% in the lowest tertile, 3.9 out of 100 person-years and 54.2% in the middle tertile, and 7.7 out of 100 person-years and 85.7% in the highest tertile. Patients in the highest tertile had a significantly higher risk of Cr doubling than those in the lower two tertiles (log–rank test, P = 0.0008).
Figure 1.
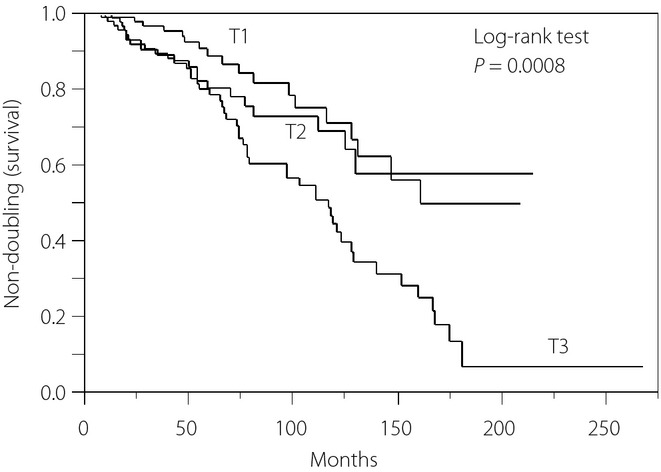
Kaplan–Meier curves for the doubling of serum creatinine (Cr) in 290 patients with type 2 diabetes and overt nephropathy stratified by sex-specific tertiles (T1, T2, T3) of serum uric acid (SUA) levels. Tertiles of SUA levels: T1 (n = 99): SUA <5.2 mg/dL (men), <4.1 mg/dL (women). T2 (n = 98): SUA 5.2−6.3 mg/dL (men), 4.1−5.1 mg/dL (women). T3 (n = 93): SUA >6.3 mg/dL (men), >5.1 mg/dL (women).
The results from the univariate Cox regression analyses are shown in Table2. Cr doubling was significantly associated with sex (women HR 2.28, 95% CI 1.42−3.57, P = 0.0009), diabetes duration (HR 0.95, 95% CI 0.93−0.98, P = 0.004), LDL-C (HR 1.00, 95% CI 1.00−1.01, P = 0.03), smoking status (yes HR 2.17, 95% CI 1.40−3.43, P = 0.0005), HbA1c levels (HR 1.32, 95% CI 1.19−1.46, P < 0.0001), eGFR (HR 1.01, 95% CI 1.00−1.02, P = 0.01) and SUA tertiles (main effect P = 0.001; highest vs middle HR 1.87, 95% CI 1.12−3.23, P = 0.01; middle vs lowest HR 1.35, 95% CI 0.71−2.59, P = 0.34; highest vs lowest HR 2.54, 95% CI 1.50−4.50, P = 0.0004). Of note, the highest tertile for SUA was a strong risk factor for declining renal function, even though 86.2% of the patients in the highest SUA tertile had borderline normal levels (6.3−7.0 mg/dL in men and 5.1−7.0 mg/dL in women). Age, BMI, systolic blood pressure, use of antiplatelet agents, use of antihypertensive agents, use of statin, degree of proteinuria and a previous history of coronary heart diseases were not significant risk factors. Furthermore, a previous history of stroke and ASO, and aortic calcification were not significant (data not shown).
Table 2.
Risk factors of creatinine doubling as assessed by Cox proportional hazards models
| Variable | Univariate |
Multivariate model 1 |
Multivariate model 2 |
|||
|---|---|---|---|---|---|---|
| HR (95% CI) | P | HR (95% CI) | P | HR (95% CI) | P | |
| SUA tertiles | 0.001 | 0.008 | 0.003 | |||
| Highest (T3) vs middle (T2) | 1.87 (1.12–3.23) | 0.01 | 1.70 (0.88–3.31) | 0.11 | 1.70 (0.86–3.40) | 0.12 |
| Middle (T2) vs lowest (T1) | 1.35 (0.71–2.59) | 0.34 | 1.39 (0.81–2.46) | 0.23 | 1.57 (0.88–2.87) | 0.12 |
| Highest (T3) vs lowest (T1) | 2.54 (1.50–4.50) | 0.0004 | 2.37 (1.35–4.30) | 0.002 | 2.68 (1.48–5.00) | 0.0009 |
| Age (years) | 0.97 (0.95–1.00) | 0.12 | 1.01 (0.97–1.05) | 0.46 | ||
| Sex (women) | 2.28 (1.42–3.57) | 0.0009 | 1.65 (0.98–2.71) | 0.05 | 1.64 (0.92–2.86) | 0.08 |
| Diabetes duration (years) | 0.95 (0.93–0.98) | 0.004 | 0.97 (0.94–1.00) | 0.13 | 0.96 (0.93–1.00) | 0.06 |
| Smoking status | 2.17 (1.40–3.43) | 0.0005 | 1.76 (1.12–2.84) | 0.01 | 1.74 (1.07–2.87) | 0.02 |
| Body mass index (kg/m2) | 0.98 (0.90–1.06) | 0.66 | 0.92 (0.84–1.00) | 0.06 | ||
| HbA1c (%) | 1.32 (1.19–1.46) | <0.0001 | 1.21 (1.08–1.36) | 0.001 | 1.25 (1.09–1.43) | 0.001 |
| Systolic blood pressure (mmHg) | 0.99 (0.98–1.00) | 0.39 | 1.00 (0.98–1.01) | 0.69 | ||
| LDL-C (mg/dL) | 1.00 (1.00–1.01) | 0.03 | 1.00 (0.99–1.00) | 0.34 | 1.00 (0.99–1.01) | 0.15 |
| Antiplatelet agents | 0.76 (0.42–1.28) | 0.32 | 0.76 (0.40–1.37) | 0.38 | ||
| Antihyperuricemic agents | 0.97 (0.45–1.84) | 0.94 | 1.54 (0.69–3.04) | 0.26 | ||
| Antihypertensive agents | 0.80 (0.52–1.24) | 0.31 | 1.09 (0.65–1.84) | 0.73 | ||
| Statin | 0.80 (0.45–1.34) | 0.41 | 0.91 (0.50–1.58) | 0.76 | ||
| eGFR (mL/min/1.73 m2) | 1.01 (1.00–1.02) | 0.01 | 1.00 (0.99–1.01) | 0.05 | 1.01 (1.00–1.02) | 0.05 |
| Proteinuria | 1.09 (0.75–1.57) | 0.62 | 0.87 (0.59–1.27) | 0.48 | ||
| CHD | 1.24 (0.77–1.96) | 0.35 | 0.98 (0.59–1.55) | 0.95 | ||
Results are expressed as hazard ratios (95% confidence intervals [CI]). The hazard ratio (HR) for continuous variables was computed for 1 standard deviation change. Cohort size, n = 290 (male : female, 231:59). CHD, coronary heart disease; CI, confidence interval; eGFR, estimated glomerular filtration rate; HbA1c, glycated hemoglobin; LDL-C, low-density lipoprotein cholesterol; SUA, serum uric acid. T1, first tertile; T2, second tertile; T3, third tertile.
In the multivariate Cox regression analysis, model 1 includes parameters only significant in the univariate model and model 2 includes all. In model 1, the risks for Cr doubling included sex, smoking status, HbA1c levels and SUA tertiles (main effect: P = 0.008; highest vs lowest HR 2.37, 95% CI 1.35−4.30, P = 0.002; highest vs middle HR 1.70, 95% CI 0.88−3.31, P = 0.11; middle vs lowest HR 1.39, 95% CI 0.81−2.46, P = 0.23) remained significant. In model 2, the risks for Cr doubling included smoking status (yes HR 1.74, 95% CI 1.07−2.87, P = 0.02), HbA1c levels (HR 1.25, 95% CI 1.09−1.42, P = 0.0009) and SUA tertiles (main effect P = 0.003; highest vs lowest HR 2.68, 95% CI 1.48−5.00, P = 0.0009; highest vs middle HR 1.70, 95% CI 0.88−2.86, P = 0.12; middle vs lowest HR 1.57, 95% CI 0.86−3.40, P = 0.12). The highest SUA remained significant after adjustment for confounding variables.
In the non-doubling group, there was a significant (r = 0.35, P < 0.0001) correlation between eGFR and SUA, but the same relationship was not significant (r = 0.20, P = 0.062) in the doubling group (Figure2a,b).
Figure 2.
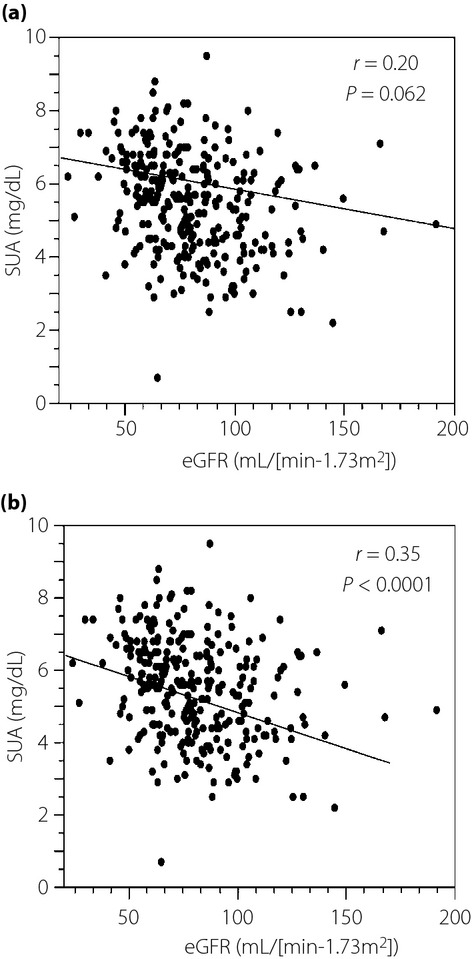
Correlation between estimated glomerular filtration rate (eGFR) and serum uric acid (SUA) levels in the (a) serum creatinine doubling group and (b) serum creatinine non-doubling group.
Discussion
To our knowledge, this is the first report to show SUA levels at the onset of overt nephropathy as a risk factor for declining renal function in patients with type 2 diabetes. An elevated SUA level within the normal range (>380 μmol/L [6.4 mg/dL] in men, >303 μmol/L [5.1 mg/dL] in women) emerged as a strong and independent risk factor for renal function decline. These findings complement those reported previously in type 1 diabetes regarding the significant predictive abilities of UA for the development of diabetic nephropathy23,24.
Renal condition at baseline, measured as the eGFR, is another important predictor of the decline in renal function. Generally, low eGFR is considered a risk factor for the progression of renal dysfunction25. However, in patients with type 2 diabetes, glomerular hyperfiltration and the accompanying increase in eGFR, which is observed in 0–40% of patients with type 2 diabetes26, contributes to loss of renal function and nephropathy27. Similarly, in the current study, increased eGFR at baseline was a significant risk factor for impaired renal function in the univariate analysis, and we hypothesize that the eGFR would continue to increase in the high-risk group, if the follow up continued.
Elevated SUA levels have previously been associated with eGFR, albeit with decreased eGFR28. SUA levels are determined by UA production and excretion, and UA is produced by xanthine oxidoreductase. Oxidoreductase activity also contributes to macrophage foam cell formation and inflammation29, and macrophage activation is thought to be involved in the pathogenesis of overt nephropathy30. Therefore, UA production might be assessed using SUA and eGFR, which could be a diagnostic and monitoring marker for renal injury.
The target SUA value for therapeutic intervention has not been clarified to prevent renal function decline or arteriosclerosis. It is speculated from the present results and previous small size, short-term intervention studies including non-diabetic patients that UA-lowering treatment has a renoprotective effect, and inhibits oxidative stress, atherogenesis, hypertension and vascular endothelial damage31–33. The use of UA-lowering treatment for renoprotection has not been incorporated into existing guidelines; instead, elevated SUA has historically been addressed only as a means to prevent gout attacks34.
The recommended multifactorial management of type 2 diabetic nephropathy is to stop smoking35 and to maintain the following: blood pressure <130/85 mmHg, HbA1c <7.0% and LDL-C < 100 mg/dL36. Of these, poor glycemic control, elevated LDL-C and smoking, but not high blood pressure, were significant risk factors for renal dysfunction in the current study. In addition to these known factors, SUA also probably increased the risk of declining renal function. Further evidence for the use of UA-lowering treatment for renoprotection is required.
The present study had several limitations. First, this was a retrospective observational study carried out in a single institution. A large-scale intervention is required to verify the effectiveness of UA-lowering therapy for renoprotection. Second, the artificial conversion between serum creatinine values obtained in different periods was a limitation. Furthermore, we did not evaluate the available types of antihypertensive agents, which might affect SUA levels. The existence of nephrosclerosis was not fully denied in the present study, because not all patients underwent kidney biopsy.
Despite these limitations, the long-term follow up in the current study provides a certain level of confidence in using the results to refine the therapeutic approaches for overt nephropathy with the aim of preventing the progression to ESRD. Interventions to address elevated SUA levels, even within the normal range, in patients with type 2 diabetes might include appropriate renoprotective therapy.
Acknowledgments
The authors thank Mineko Okayasu for her programming efforts. The authors declare no conflict of interest.
References
- Wakai K, Nakai S, Kikuchi K. Trends in incidence of end-stage renal disease in Japan, 1983–2000: age-adjusted and age-specific rates by gender and cause. Nephrol Dial Transplant. 2004;19:2044–2052. doi: 10.1093/ndt/gfh317. [DOI] [PubMed] [Google Scholar]
- Hovind P, Rossing P, Tarnow L. Progression of diabetic nephropathy. Kidney Int. 2001;59:702–709. doi: 10.1046/j.1523-1755.2001.059002702.x. [DOI] [PubMed] [Google Scholar]
- Intensive blood-glucose control with sulphonylureas or insulin compared with conventional treatment and risk of complications in patients with type 2 diabetes (UKPDS 33). UK Prospective Diabetes Study (UKPDS) Group. Lancet. 1998;352:837–853. [PubMed] [Google Scholar]
- Keech A, Simes RJ, Barter P. Effects of long-term fenofibrate therapy on cardiovascular events in 9795 people with type 2 diabetes mellitus (the FIELD study): randomised controlled trial. Lancet. 2005;366:1849–1861. doi: 10.1016/S0140-6736(05)67667-2. [DOI] [PubMed] [Google Scholar]
- Pistrosch F, Passauer J, Herbrig K. Effect of thiazolidinedione treatment on proteinuria and renal hemodynamic in type 2 diabetic patients with overt nephropathy. Horm Metab Res. 2012;44:914–918. doi: 10.1055/s-0032-1314836. [DOI] [PubMed] [Google Scholar]
- Hansen HP, Tauber-Lassen E, Jensen BR. Effect of dietary protein restriction on prognosis in patients with diabetic nephropathy. Kidney Int. 2002;62:220–228. doi: 10.1046/j.1523-1755.2002.00421.x. [DOI] [PubMed] [Google Scholar]
- Wu J, Ding Y, Zhu C. Urinary TNF-alpha and NGAL are correlated with the progression of nephropathy in patients with type 2 diabetes. Exp Ther Med. 2013;6:1482–1488. doi: 10.3892/etm.2013.1315. [DOI] [PMC free article] [PubMed] [Google Scholar]
- Kodama S, Saito K, Yachi Y. Association between serum uric acid and development of type 2 diabetes. Diabetes Care. 2009;32:1737–1742. doi: 10.2337/dc09-0288. [DOI] [PMC free article] [PubMed] [Google Scholar]
- Merjanian R, Budoff M, Adler S. Coronary artery, aortic wall, and valvular calcification in nondialyzed individuals with type 2 diabetes and renal disease. Kidney Int. 2003;64:263–271. doi: 10.1046/j.1523-1755.2003.00068.x. [DOI] [PubMed] [Google Scholar]
- Krishnan E, Kwoh CK, Schumacher HR. Hyperuricemia and incidence of hypertension among men without metabolic syndrome. Hypertension. 2007;49:298–303. doi: 10.1161/01.HYP.0000254480.64564.b6. [DOI] [PubMed] [Google Scholar]
- Zoppini G, Targher G, Negri C. Elevated serum uric acid concentrations independently predict cardiovascular mortality in type 2 diabetic patients. Diabetes Care. 2009;32:1716–1720. doi: 10.2337/dc09-0625. [DOI] [PMC free article] [PubMed] [Google Scholar]
- Tavil Y, Kaya MG, Oktar SO. Uric acid level and its association with carotid intima-media thickness in patients with hypertension. Atherosclerosis. 2008;197:159–163. doi: 10.1016/j.atherosclerosis.2007.03.008. [DOI] [PubMed] [Google Scholar]
- Tanaka K, Hara S, Kushiyama A. Risk of macrovascular disease stratified by stage of chronic kidney disease in type 2 diabetic patients: critical level of the estimated glomerular filtration rate and the significance of hyperuricemia. Clin Exp Nephrol. 2011;15:391–397. doi: 10.1007/s10157-011-0420-6. [DOI] [PubMed] [Google Scholar]
- Miao Y, Ottenbros SA, Laverman GD. Effect of a reduction in uric acid on renal outcomes during losartan treatment: a post hoc analysis of the reduction of endpoints in non-insulin-dependent diabetes mellitus with the Angiotensin II Antagonist Losartan Trial. Hypertension. 2011;58:2–7. doi: 10.1161/HYPERTENSIONAHA.111.171488. [DOI] [PubMed] [Google Scholar]
- Floege J, Johnson RJ, Feehally J. Comprehensive Clinical Nephrology. 4th edn. Missouri: Mosby; 2010. pp. 359–376. Section 5 diabetic neprology. [Google Scholar]
- Kushiyama A, Yoshida Y, Kikuchi T. Twenty-year trend of increasing obesity in young patients with poorly controlled type 2 diabetes at first diagnosis in urban Japan. J Diabetes Invest. 2011;4:540–545. doi: 10.1111/jdi.12090. [DOI] [PMC free article] [PubMed] [Google Scholar]
- Kashiwagi A, Kasuga M, Araki E. International clinical harmonization of glycated hemoglobin in Japan: from Japan Diabetes Society to National Glycohemoglobin Standardization Program values. J Diabetes Invest. 2012;3:39–40. doi: 10.1111/j.2040-1124.2012.00207.x. [DOI] [PMC free article] [PubMed] [Google Scholar]
- Matsuo S, Imai E, Horio M. Revised equations for estimated GFR from serum creatinine in Japan. Am J Kidney Dis. 2009;53:982–992. doi: 10.1053/j.ajkd.2008.12.034. [DOI] [PubMed] [Google Scholar]
- Horio M, Orita Y. Comparison of Jaffe rate assay and enzymatic method for the measurement of creatinine clearance. Nihon Jinzo Gakkai Shi. 1996;38:296–299. [PubMed] [Google Scholar]
- Meyer NL, Mercer BM, Friedman SA. Urinary dipstick protein: a poor predictor of absent or severe proteinuria. Am J Obstet Gynecol. 1994;170:137–141. doi: 10.1016/s0002-9378(94)70398-1. [DOI] [PubMed] [Google Scholar]
- Akizuki S. Serum uric acid levels among thirty-four thousand people in Japan. Ann Rheum Dis. 1982;41:272–274. doi: 10.1136/ard.41.3.272. [DOI] [PMC free article] [PubMed] [Google Scholar]
- Lewis EJ, Hunsicker LG, Clarke WR. Renoprotective effect of the angiotensin-receptor antagonist irbesartan in patients with nephropathy due to type 2 diabetes. N Engl J Med. 2001;345:851–860. doi: 10.1056/NEJMoa011303. [DOI] [PubMed] [Google Scholar]
- Hovind P, Rossing P, Tarnow L. Serum uric acid as a predictor for development of diabetic nephropathy in type 1 diabetes: an inception cohort study. Diabetes. 2009;58:1668–1671. doi: 10.2337/db09-0014. [DOI] [PMC free article] [PubMed] [Google Scholar]
- Ficociello LH, Rosolowsky ET, Niewczas MA. High-normal serum uric acid increases risk of early progressive renal function loss in type 1 diabetes: results of a 6-year follow-up. Diabetes Care. 2010;33:1337–1343. doi: 10.2337/dc10-0227. [DOI] [PMC free article] [PubMed] [Google Scholar]
- Chang TI, Li S, Chen SC. Risk factors for ESRD in individuals with preserved estimated GFR with and without albuminuria: results from the Kidney Early Evaluation Program (KEEP) Am J Kidney Dis. 2013;61:S4–S11. doi: 10.1053/j.ajkd.2012.12.016. [DOI] [PMC free article] [PubMed] [Google Scholar]
- Jerums G, Premaratne E, Panagiotopoulos S. The clinical significance of hyperfiltration in diabetes. Diabetologia. 2010;53:2093–2104. doi: 10.1007/s00125-010-1794-9. [DOI] [PubMed] [Google Scholar]
- Ruggenenti P, Porrini EL, Gaspari F. Glomerular hyperfiltration and renal disease progression in type 2 diabetes. Diabetes Care. 2012;35:2061–2068. doi: 10.2337/dc11-2189. [DOI] [PMC free article] [PubMed] [Google Scholar]
- Chonchol M, Shlipak MG, Katz R. Relationship of uric acid with progression of kidney disease. Am J Kidney Dis. 2007;50:239–247. doi: 10.1053/j.ajkd.2007.05.013. [DOI] [PubMed] [Google Scholar]
- Kushiyama A, Okubo H, Sakoda H. Xanthine oxidoreductase is involved in macrophage foam cell formation and atherosclerosis development. Arterioscler Thromb Vasc Biol. 2012;32:291–298. doi: 10.1161/ATVBAHA.111.234559. [DOI] [PubMed] [Google Scholar]
- Lan HY, Bacher M, Yang N. The pathogenic role of macrophage migration inhibitory factor in immunologically induced kidney disease in the rat. J Exp Med. 1997;185:1455–1465. doi: 10.1084/jem.185.8.1455. [DOI] [PMC free article] [PubMed] [Google Scholar]
- Sezai A, Soma M, Nakata K. Comparison of febuxostat and allopurinol for hyperuricemia in cardiac surgery patients (NU-FLASH Trial) Circ J. 2013;77:2043–2049. doi: 10.1253/circj.cj-13-0082. [DOI] [PubMed] [Google Scholar]
- Siu YP, Leung KT, Tong MK. Use of allopurinol in slowing the progression of renal disease through its ability to lower serum uric acid level. Am J Kidney Dis. 2006;47:51–59. doi: 10.1053/j.ajkd.2005.10.006. [DOI] [PubMed] [Google Scholar]
- Goicoechea M, de Vinuesa SG, Verdalles U. Effect of allopurinol in chronic kidney disease progression and cardiovascular risk. Clin J Am Soc Nephrol. 2010;5:1388–1393. doi: 10.2215/CJN.01580210. [DOI] [PMC free article] [PubMed] [Google Scholar]
- Khanna D, Fitzgerald JD, Khanna PP. 2012 American College of Rheumatology guidelines for management of gout. Part 1: systematic nonpharmacologic and pharmacologic therapeutic approaches to hyperuricemia. Arthritis Care Res (Hoboken) 2012;64:1431–1446. doi: 10.1002/acr.21772. [DOI] [PMC free article] [PubMed] [Google Scholar]
- Gambaro G, Bax G, Fusaro M. Cigarette smoking is a risk factor for nephropathy and its progression in type 2 diabetes mellitus. Diabetes Nutr Metab. 2001;14:337–342. [PubMed] [Google Scholar]
- Seaquist ER, Ibrahim HN. Approach to the patient with type 2 diabetes and progressive kidney disease. J Clin Endocrinol Metab. 2010;95:3103–3110. doi: 10.1210/jc.2010-0504. [DOI] [PubMed] [Google Scholar]