

Abstract
The aim of the present study was to assess smokers’ level of agreement with smoking-related risks and toxic tobacco constituents relative to inclusion of these topics on health warning labels (HWLs). 1000 adult smokers were interviewed between 2012 and 2013 from online consumer panels of adult smokers from each of the three countries: Australia (AU), Canada (CA) and Mexico (MX). Generalized estimating equation models were estimated to compare agreement with smoking-related risks and toxic tobacco constituents. For disease outcomes described on HWLs across all three countries, there were few statistical differences in agreement with health outcomes (e.g. emphysema and heart attack). By contrast, increases in agreement where the HWLs were revised or introduced on HWLs for the first time (e.g. blindness in AU and CA, bladder cancer in CA). Similarly, samples from countries that have specific health content or toxic constituents on HWLs showed higher agreement for that particular disease or toxin than countries without (e.g. higher agreement for gangrene and blindness in AU, higher agreement for bladder cancer and all toxic constituents except nitrosamines and radioactive polonium in CA). Pictorial HWL content is associated with greater awareness of smoking-related risks and toxic tobacco constituents.
Introduction
Tobacco use is the single most preventable cause of premature death and disability in the world [1]. To increase consumer understanding of tobacco-related harms, the World Health Organization’s Framework Convention on Tobacco Control recommends the use of large pictorial health warning labels (HWLs) on tobacco product packaging [1], a policy that 55 countries had implemented by the end of 2012 [2]. HWLs can be a primary source of information about specific health risks of smoking [3], particularly in countries that do not have resources for extensive media campaigns [4, 5]. HWLs may reduce relapse if they are used by those who are trying to remain quit to remind themselves of their reasons for quitting [6]. Smokers’ knowledge about particular health risks is improved by HWLs that convey the particular risk [3, 7–9], and HWL-specific knowledge has increased with the initial introduction of pictorial HWLs [10–12]. With the great number of countries that have introduced this policy, research is needed to understand the most effective content for introduction of new warnings for subsequent rounds of pictorial HWLs.
Pictorial HWLs on cigarette packaging are necessary because relatively few smokers understand the magnitude and full range of health risks from smoking [5]. Studies have consistently shown that smokers’ knowledge of smoking-related diseases was high with regard to some of the well-known risks such as lung cancer and heart disease but lower knowledge for other smoking-related risks such as stroke, impotence, gangrene and other cancers [3, 9, 13–16]. Smokers’ knowledge of toxic constituents in tobacco smoke is also generally low, except for carbon monoxide [3, 9, 13, 17], which the tobacco industry often lists on packs along with nicotine and tar levels in some countries. Pictorial HWLs that include content on toxic constituents have been shown to increase knowledge of these specific constituents [11, 12, 18]. While informing consumers is an important goal itself, smokers’ knowledge of health risks also predicts quit behavior, including long-term abstinence among former smokers [3, 6, 19–21]. Because attention to and impact of HLWs wear out over time [22], the long-term efficacy of this policy, including changes in knowledge when HWL content is changed, requires a better understanding.
Context
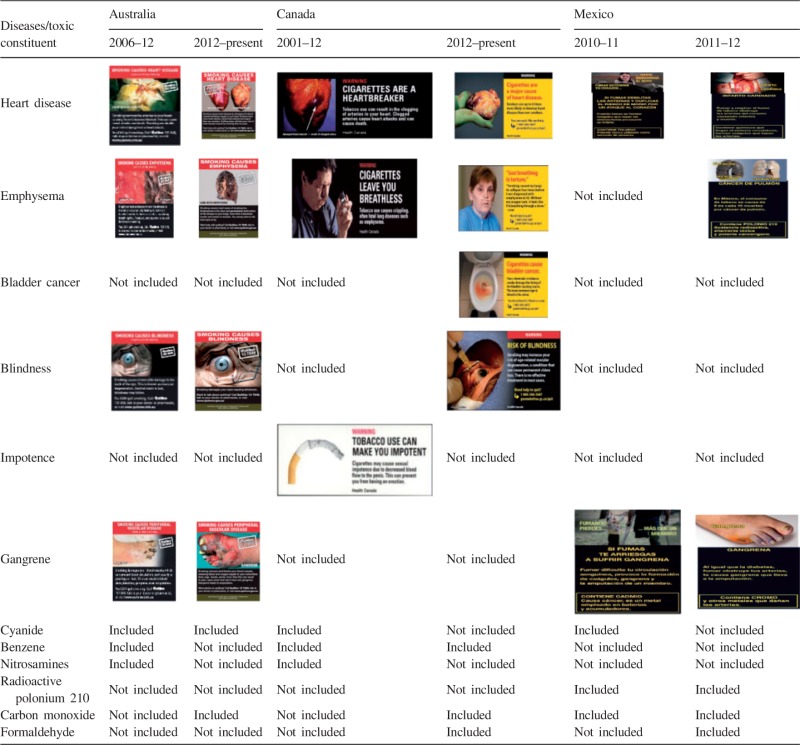
In 2012, Australia (AU), Canada (CA), and Mexico (MX) implemented new pictorial HWL content after prior implementation of pictorial HWLs. Table I presents the HWL content for each of the health outcomes and toxic constituents of interest in this study. Since becoming the first country to implement pictorial HWLs in 2001, CA implemented 16 new HWLs in July 2012, while also increasing HWL size from 50% to 75% of the front and back of the package. AU implemented its first round of pictorial HWLs in 2006, which covered 30% of the front and 90% of the back of the pack. In December 2012, AU increased the size of the HWL to 75% of the front (maintaining 90% of the back), introduced nine new HWLs, and implemented ‘plain’ packaging that standardized the shape, color and size of cigarette packs, including the elimination of brand symbols, logos, colors and font types. MX first implemented pictorial HWLs in September 2010 and has introduced new HWL content every 3–6 months since then; this is the fastest rotation of new HWL content in the world [2]. Introduction of content about less-known smoking-related risks and variation in HWL content across these three countries provides an opportunity to explore the impact of HWLs on smokers’ understandings of smoking-related risks. The results of within- and cross-country comparisons should help regulators develop more effective HWL content.
Table I.
Pictorial HWLs on cigarette packs in Australia, Canada and Mexico by year
 |
The current research aimed to: (1) assess smokers’ level of knowledge about smoking-related risks and toxic tobacco constituents relative to the inclusion of information about these topics in prior and newly introduced HWLs and (2) to examine whether knowledge about any particular topic would increase over time within countries that introduced novel HWL content that addressed this topic. We hypothesized that (1) knowledge of any particular topic would be higher if HWLs included content related to that topic and (2) the knowledge about these topics would increase over time within countries that introduced novel HWL content that addressed a particular topic.
Methods
Study population and methods
The study sample included adult smokers recruited from online consumer panels in AU, CA and MX, which were provided by Global Market Insights [23]. Panels were assembled in different ways in each country, but with participants purposively selected to be representative of target population in each country. Recruitment of new participants in each country involved sending invitations to panel participants who were of eligible age and who were either known smokers or from the general population samples for which smoking status was unknown. Eligible participants were 18–64 years of age, had smoked at least 100 cigarettes in their lifetime and had smoked at least once in the previous month. Wave 1 data were collected from 16 September to 29 September 2012 and included 1000 adult smokers in each country. Wave 2 data collection took place from 15 January to 6 February 2013, and to address attrition and maintain sample sizes of 1000 per country, the samples were replenished with new participants who met study eligibility of being adult smokers.
Measures
Agreement with smoking-related health effects and toxic tobacco constituents
Agreement with smoking-related health effects was measured by asking ‘To the best of your knowledge, indicate which illness, if any, are caused by smoking cigarettes?’ The diseases were presented simultaneously in a table, with the order randomized across participants, and these included: emphysema, heart attacks, bladder cancer, blindness, impotence in male smokers, gangrene and hepatitis. Hepatitis was included as a non-tobacco-related outcome for use as a statistical adjustment for acquiescence bias [24]. Response options included ‘Yes’, ‘No’ and ‘Don’t know’, the last of which was recoded ‘No’ for analyses. Agreement with toxic chemicals in cigarette smoke was measured by asking ‘To the best of your knowledge, indicate which chemicals, if any, are in cigarette smoke?’ The following chemicals were presented in random order in a table: cyanide, benzene, nitrosamines, radioactive polonium 210, carbon monoxide and formaldehyde. Response categories were ‘Yes’, ‘No’ and ‘Don’t know’, with the latter category recoded to ‘No’.
Country and time
Dummy variables were created for country, with AU as the reference group (unless specified otherwise), and for survey wave (0 = wave 1 and 1 = wave 2).
Covariates
The survey included validated measures of smoking behavior, quit intentions and quit behavior [25]. Smoking intensity was determined by asking participants to report daily or non-daily smoking, as well as the average number of cigarettes they smoked on the days that they smoked. Smokers were classified as non-daily smokers (i.e. those that did not smoke every day but at least once in the past 30 days), daily smokers who consumed 10 or fewer cigarettes per day (CPD) and daily smokers who smoked more than 10 CPD. Recent quit history was assessed by asking whether participants had attempted to quit in the 4 months prior to the survey. Quit intentions were assessed by asking whether participants planned to quit in the next month, in the next 6 months, sometime beyond 6 months or not at all, with responses dichotomized to indicate intention to quit in the next 6 months versus not. Age was recoded to five categories: 18–24, 25–34, 35–44, 45–54 and 55–64. Education was categorized as ‘high school or less’, ‘some college or university’ and ‘completed college or university’. Annual income for CA and AU was re-categorized to $29 000 or less, $30 000–59 999 and $60 000 or more. Mexican respondents reported monthly income, as is customary in that country, with categories recoded to $5000 or less, $5001–10 000 or 10 001 or more. Exposure to media campaigns was determined by asking participants how much a media campaign on TV or radio about health risks from smoking led them to think about quitting. Response options were recoded as not at all, a little, moderately, very much and extremely.
Statistical analysis
All analyses were conducted using SAS software, version 9.3. For within-country analyses, only data for that country were analyzed, whereas for cross-country analyses, data were pooled from the three countries. Pooled data were used to conduct χ2 tests to assess differences in wave 1 sample characteristics across countries, and country-stratified data were used to conduct χ2 tests to assess within-country differences from wave 1 to wave 2. Generalized estimating equation (GEE) models with binomial distribution and logit link function were estimated to assess significant within-country changes over time and cross-country differences in agreement with health effects and toxins in tobacco smoke. These models adjusted for the non-independence of repeated observations through estimation of an exchangeable correlation for repeated observations from subjects. Apart from the covariates mentioned above, all GEE models also adjusted for time-in-sample effects (i.e. 1 for observations at wave 2 for which there was a prior observation from the same individual at wave 1; all other observations were coded as 0). To assess changes in agreement over time, data from each country were analyzed separately in fully adjusted models that estimated predicted probabilities for all outcomes at each wave. We hypothesized that agreement with any particular disease would be higher in countries whose HWLs included content related to that topic. Hence, a country that had that specific pictorial HWL content for the longest time was chosen as the comparison country. Finally, a separate set of models with interactions between survey wave and country were tested to assess whether change in agreement over time differed across countries.
Results
Sample characteristics
After combining data from both waves 1 and 2, the overall response rates to invitation emails sent to potential participants were 19% in AU, 15% in CA and 17% in MX. At wave 2, 65% of the Australian sample, 58% of the Canadian sample and 49% of the Mexican sample were re-contacted and completed a second survey. Table II shows the sample characteristics for each of the three countries at both waves. At wave 1, compared with the Australian smokers, Mexican smokers were more likely to be male, younger in age, have higher educational attainment, be ‘lighter’ smokers, and were less likely to have attempted to quit in the prior 4 months. For most characteristics assessed, Canadian smokers were very similar to Australian smokers at wave 1, except that the Canadian sample had significantly lower household income. Compared with the wave 1 samples, wave 2 samples in all the three countries had lower educational attainment. Within both AU and CA, the wave 2 samples consisted of fewer non-daily smokers than their baseline samples. Fewer smokers from the Australian wave 2 sample intended to quit but more had attempted to quit in the prior 4 months compared with the Australian wave 1 sample. The wave 2 sample in MX contained a higher percentage of smokers who intended to quit in the next 6 months but fewer had attempted to quit in the prior 4 months in comparison to the Mexican wave 1 sample.
Table II.
Sociodemographics and smoking behaviors of smokers from AU, CA and MX at wave 1 and wave 2
| Socio-demographics and smoking behavior | AU (n = 1001) |
CA (n = 1001) |
MX (n = 1000) |
|||
|---|---|---|---|---|---|---|
| Wave 1 | Wave 2 | Wave 1 | Wave 2 | Wave 1 | Wave 2 | |
| Age (years) | ||||||
| 18–24 | 12% | 8%* | 14% | 13% | 20%bb | 20% |
| 25–34 | 21% | 22% | 22% | 22% | 30% | 30% |
| 35–44 | 20% | 23% | 22% | 22% | 20% | 20% |
| 45–54 | 24% | 24% | 20% | 21% | 15% | 15% |
| 55–64 | 23% | 23% | 22% | 23% | 15% | 15% |
| Gender | ||||||
| Male | 42% | 42% | 41% | 43% | 55%bb | 55% |
| Female | 58% | 58% | 60% | 57% | 45% | 45% |
| Education | ||||||
| High school or less | 34% | 38%* | 30% | 33%** | 35%bb | 39%** |
| College or some university | 41% | 42% | 44% | 47% | 19% | 22% |
| Completed university or higher | 25% | 20% | 26% | 20% | 46% | 39% |
| Income | ||||||
| 29 999 or les | 23% | 24% | 28%aa | 28% | 20% | 17% |
| $30 000–59 999 | 28% | 25% | 33% | 32% | 27% | 26% |
| $60 000 or more | 49% | 51% | 39% | 40% | 54% | 57% |
| Smoking intensity | ||||||
| Non-daily | 21% | 12%** | 22% | 16%** | 51%bb | 53% |
| Daily, 10 cig or less per day | 22% | 23% | 24% | 29% | 34% | 30% |
| Daily, >10 cig per day | 57% | 65% | 54% | 55% | 15% | 17% |
| Quit intentions in next 6 months | ||||||
| Yes | 45% | 40%* | 47% | 43% | 41% | 48%** |
| No | 55% | 60% | 53% | 57% | 59% | 52% |
| Quit attempts in the past 4 months | ||||||
| Yes | 60% | 66%** | 58% | 60% | 52%bb | 47%* |
| No | 40% | 34% | 42% | 40% | 48% | 53% |
aaP-value < 0.01 for CA w1 versus AU w1. bbP value < 0.01 for MX w1 versus AU w1. *P-value < 0.05 for within-country differences from wave 1 to wave 2; **P-value < 0.01 for within-country differences from wave 1 to wave 2.
Agreement with health effects
Figure 1 presents proportion of agreement with health effects caused by smoking at each country for each time point.
Fig. 1.

Proportion of agreement with health effects caused by smoking among smokers from AU, CA and MX at wave 1 and wave 2. Notes: W warning currently on the pack; P warning previously on the pack; N waning not present on the pack. *P-value < 0.05 for within-country differences from wave I to wave II; **P-value < 0.01 for within-country differences from wave I to wave II. aP-value < 0.05 for CA w1 versus AU w1; aaP-value < 0.01 for CA w1 versus AU w1. bP-value < 0.05 for MX w1 versus AU w1; bbP-value < 0.01 for MX w1 versus AU w1. cP-value < 0.05 for AU w1 versus CA w1; ccP-value < 0.01 for AU w1 versus CA w1. dP-value < 0.05 for MX w1 versus CA w1; ddP-value < 0.01 for MX w1 versus CA w1.
Smoking-related health outcomes present on HWLs at both survey waves
Agreement with the risk of ‘emphysema’ from smoking in AU, CA and MX was high at wave 1 (i.e. 86%, 85% and 95%, respectively) and not significantly different at wave 2 (i.e. 86%, 84% and 94%, respectively). A similar pattern of results was found for perceived risk of ‘heart attack’ from smoking at wave 1 (i.e. 81%, 88% and 88%, respectively) and wave 2 (i.e. 78%, 87% and 85%, respectively). In cross-country comparisons, at baseline, agreement with emphysema was significantly lower in CA than in MX (P < 0.0001) and agreement with heart attack was higher in CA than AU (P < 0.0001). The change in agreement with these health outcomes from wave 1 to wave 2 was not significantly different across countries.
In AU, newly introduced HWLs included content for gangrene and blindness, both of which had been in prior HWLs. Agreement with gangrene was high at wave 1 and was not significantly different at wave 2 (i.e. 76% and 78%, respectively). Agreement with blindness increased significantly from wave 1 to wave 2 (e.g. 59–74%, respectively; P ≤ 0.0001). In MX, two different HWLs about gangrene had circulated between 2011 and 2012, including a second HWL that was circulating at both survey assessments. Agreement with smoking-related gangrene was moderately high at wave 1 and not significantly different at wave 2 (i.e. 50% at wave 1 and 45.5% at wave 2). In CA, HWLs about smoking-related bladder cancer and blindness were introduced for the first time immediately prior to the wave 1 survey, and agreement increased for both outcomes (bladder cancer, 38–51%, P ≤ 0.0001; blindness, 34–46%, P ≤ 0.0001).
Smoking-related health outcomes not present on HWLs at either waves
For disease outcomes that were not listed on the HWLs, agreement with smoking-related risk remained stable at wave 1 and wave 2 (e.g. bladder cancer in AU 29% and 31%, respectively; and in MX 22% and 23%, respectively and blindness in MX 16% and 19%, respectively), except for a significant increase in agreement with gangrene in CA (16% at wave 1 and 21% at wave 2, P = 0.004).
In cross-country comparisons, countries that did not have specific health outcome content on HWLs showed lower agreement with that particular disease than countries that have the specific health outcome on HWLs. For example, at wave 1, the agreement with ‘bladder cancer’ was higher in CA than AU (P < 0.0001) and MX (P < 0.0001) and the increase in this agreement from wave 1 to wave 2 was significantly greater in CA than AU (P = 0.0003) and MX (P = 0.0017). Likewise, at wave 1, the agreement with ‘blindness’ was higher in AU than CA (P < 0.0001) and MX (P < 0.0001). From wave 1 to wave 2, there was a greater increase in agreement with smoking-related blindness in AU than MX (P = 0.0127) but not CA. Similarly, at wave 1, the agreement with ‘gangrene’ was significantly higher in AU than CA (P < 0.0001) and MX (P < 0.0001).
One of the HWLs in CA prior to wave 1 addressed impotence and even though the latest round of HWL in CA does not include content about ‘impotence’, agreement with this outcome remained relatively high and stable (i.e. impotence in CA 78% at wave 1 and 77% at wave 2). Also, at wave 1, agreement with impotence was higher in CA than AU (P < 0.0001) and MX (P < 0.0001), neither of which included impotence-related content on their HWLs in current or previous HWL rounds. There were no significant changes in agreement over time for smoking-related impotence.
Agreement with toxic constituents in tobacco smoke
Figure 2 presents proportion of agreement with toxic constituents in tobacco smoke by country for each time point. In general, agreement with carbon monoxide was higher than any other toxic constituent for the smokers in AU and MX.
Fig. 2.

Proportion of agreement with toxic constituents in cigarette smoke among smokers from AU, CA and MX at wave 1 and wave 2. Notes: W warning currently on the pack; P warning previously on the pack; N waning not present on the pack. *P-value < 0.05 for within-country differences from wave I to wave II; **P-value < 0.01 for within-country differences from wave 1 to wave 2. aP-value < 0.05 for CA w1 versus AU w1; aaP-value < 0.01 for CA w1 versus AU w1. bP-value < 0.05 for MX w1 versus AU w1; bbP-value < 0.01 for MX w1 versus AU w1. cP-value < 0.05 for AU w1 versus CA w1; ccP-value < 0.01 for AU w1 versus CA w1. dP-value < 0.05 for MX w1 versus CA w1; ddP-value < 0.01 for MX w1 versus CA w1. eP-value < 0.05 for AU w1 versus MX w1; eeP-value < 0.01 for AU w1 versus MX w1. fP-value < 0.05 for CA w1 versus MX w1; ffP-value < 0.01 for CA w1 versus MX w1.
For toxic constituents that were included in prior HWL rounds as well as in the HWLs that were in effect during survey period, agreement with the specific toxic constituent was high at wave 1 and it remained high or increased significantly at wave 2: benzene in CA (55% at wave 1 and 60% at wave 2, P = 0.005), cyanide in AU (35% at wave 1 and 43% at wave 2, P < 0.0001), radioactive polonium and carbon monoxide in MX (17% and 24%, P < 0.0001 and 70% and 72%, respectively).
For toxic constituents that were listed on prior HWLs but were not rotated or revised in the newly introduced HWLs, agreement with the specific toxic constituent was similarly prevalent or increased significantly from wave 1 to wave 2: a significant increase in agreement was observed for cyanide in CA (64% at wave 1 and 69% at wave 2, P = 0.011), nitrosamines in AU (19% at wave 1 and 23% at wave 2, P = 0.017) and in CA (20% at wave 1 and 25% at wave 2, P = 0.008) and formaldehyde in CA (60% at wave 1 and 65% at wave 2, P = 0.003). The agreement with toxic constituents remained similar for cyanide in MX (45% at wave 1 and 47% at wave 2), carbon monoxide in AU (64% at wave 1 and 67% at wave 2) and CA (79% at wave 1 and 78% at wave 2). For toxic constituents included in newly introduced HWLs, agreement with specific constituent increased significantly over time (i.e. benzene in AU, 35–42%; P < 0.0001).
In cross-country comparisons, agreement with specific toxic constituents was higher in countries that had included the content on HWLs for the longest period of time than countries that had it for shorter periods of time or that did not include it. For example, at wave 1, the agreement with radioactive polonium was higher in MX (17%) than AU (10%; P = 0.0001) and CA (8%, P < 0.0001). For all the remaining toxic constituents of interest in this study except for nitrosamines, agreement was higher in CA than AU and MX. No interaction term between survey and country was significant suggesting that the changes in agreement with toxic constituent from wave 1 to wave 2 were not significantly different between AU, CA and MX.
Discussion
This longitudinal study provides evidence for the specific influence of HWL content on adult smokers’ knowledge of health effects and toxic constituents of tobacco smoke, even as new HWL content is included after populations are exposed to prominent pictorial HWLs for a number of years. Smokers from countries where HWLs contained information about specific tobacco-related diseases or toxins showed higher knowledge about those topics than smokers from countries where HWLs do not include that specific content. This was most evident for blindness in AU, gangrene in AU and MX, benzene in CA and radioactive polonium in MX. Furthermore, the introduction of new HWL content was associated with increases in knowledge of the corresponding health outcome (i.e. blindness and bladder cancer in CA and benzene in AU), which is consistent with previous literature [3, 6, 7, 10, 12]. Indeed, information novelty promotes attention to and processing of health messages and governments should consider inclusion of novel content.
The study results also show that knowledge about smoking-related risk for diseases that are relatively well-known and which have been included in prior HWL rounds (i.e. emphysema, heart attack) was high and did not change across all the three countries. This may indicate a ceiling effect for these outcomes that has been found for other communication interventions [4, 26, 27]. We also found a higher prevalence of this knowledge in MX than CA and AU, which may be due to the relatively higher educational attainment of the Mexican study sample. The higher prevalence in CA than AU may be due to the longer period of time over which warnings on these topics have been included in HWL in CA. Future research should determine how much reiterating and revising messages about well-known smoking-related risks, such as including testimonial text or changing design elements, can spur cessation behavior, above and beyond knowledge, perhaps by enhancing the relevance of this information. Indeed, some research suggests that testimonial text on HWLs, independent of type of pictorial content, is more effective than didactic text [8], although its increased efficacy may work best among less educated groups [28]. Furthermore, messages about well-known smoking-related outcomes may still be necessary to educate the next generation of smokers. The findings suggest that revision of content used in prior rounds may be particularly effective if knowledge about that content is not particularly high (i.e. gangrene and blindness in AU), perhaps because it generates a new wave of attention to that warning, or that it is memorable to a different sub-set of smokers. There is also no clear explanation for results around increases in knowledge of impotence and blindness in MX or gangrene knowledge increase in CA. This could reflect a general tendency for new content to enhance perceptions of the range of smoking risks.
Study results also showed no indication of decay in knowledge over time in CA even after the content for a specific disease or toxic constituent was removed from the HWL (i.e. impotence, cyanide, nitrosamine, carbon monoxide and formaldehyde). The 11 year period of time over which this content appeared on pictorial HWLs, and the relatively short period (months) since it was dropped, likely accounts for this stability. If awareness does not wear out, more frequent rotation provides an opportunity to communicate different health effects or to change the design/message of warnings for the same health effect over time. However, research should aim to determine the optimal periodicity with which content should be changed, if indeed there is an optimum.
Strengths and weaknesses of the study
This study has several limitations. Health knowledge can be assessed in various ways. The agreement with a health effect as measured in the current study is a low threshold for risk perception, and it does not include any assessment of the personalization of that risk. Unprompted recall of health effects would have been an alternative. However, while it reflects a deeper level of knowledge, it is more subjective to smoker’s educational status. Future research should examine the extent to which warnings influence personal risk perceptions and the influence of these on quit behavior.
There is a potential for acquiescence bias, also known as ‘Yeah Saying’ [24]—a result of participants thinking that anything mentioned is plausible so they tend to say yes to all. This could explain the higher knowledge of impotence in MX and knowledge of gangrene in CA. In order to control for ‘Yeah saying’, we analyzed all the knowledge of health outcomes and knowledge of toxins controlling for bogus health outcome, i.e. hepatitis. The belief that smoking is related to hepatitis in AU, CA and MX was 9%, 11% and 11% respectively, thus any reports at or below this level may represent guessing.
The study results could be influenced by non-response and attrition biases. However, the retention rates in our study were moderate, about 50%. Also, as shown in Table II, the wave 2 sample was significantly different from wave 1 sample on some sociodemographic and smoking-related variables. To adjust for measured differences in sample characteristics, we calculated the predicted probabilities of outcomes. Also, at wave 2, smokers who were followed-up showed higher agreement with most of the smoking-related risks than smokers who participated in only wave 2 (results not shown in tables). In multivariate analysis, all the prevalence estimates were adjusted for this time in sample effect.
The between-country differences in knowledge of health effects may also partly reflect concomitant efforts by government to inform the public about health risks of smoking through other sources such as media campaigns. During the period of data collection in AU, at least two television ads were aired in parts of the country: one on regret smokers feel for not quitting earlier aired in September 2012, and the other on a gangrene leg amputation ran in January–February 2013. The analysis adjusted for exposure to anti-smoking ads on TV and/or radio. However, this adjustment might not account for exposure to other campaigns or other sources of information about risks of smoking.
Finally, this study used online consumer panels with no clearly defined sampling frame. Although the consumer panel sample is assembled to be comparable to the general populations, the generalizability of the results to the broader population is uncertain. People who participate in these panels may be substantially different in beliefs and attitudes from general, population-based samples. However, Internet penetration rates are high in AU (90%) and CA (82%) [23]. In MX, however, Internet penetration rate is substantially lower (37% according to 2013 estimates [23]) and our sample included consumers with higher than average income and education; indeed, the Mexican sample was more highly educated than the Australian and Canadian samples. This may account for the generally high prevalence of knowledge about smoking-related risks in the Mexican sample, for which educational attainment has been shown to be positively associated. Nevertheless, smoking and socioeconomic status are generally unassociated in MX, so this is not as significant of a problem as it might be in countries where smoking is concentrated in lower socioeconomic groups [29, 30]. Of critical importance, the sampling strategy was constant across countries, and our primary aim was to assess the relationship between HWL content and respondent agreement with health risks represented in that content over time. We can think of no plausible mechanism by which the sample characteristics could have produced any of the key results, except for the relatively higher overall level of agreement among the more educated sample in MX. Studies like ours are least biased when assessing changes within country, and cross-country differences in these changes may be meaningfully compared. However, comparison of prevalence between countries is less likely to be valid due to concerns about their limited generalizability, especially in relation to MX, where the sample appeared least representative of the broader population.
Conclusions
Our study results suggest that HWLs increase smoker’s knowledge of a range of health effects caused by smoking and of the toxic constituents in cigarette smoke. How pack warnings might complement other sources of health risks information such as mass media campaigns is an area that needs more attention.
Funding
This work was supported by a grant from the National Cancer Institute (R01 CA167067).
Conflict of interest statement
None declared.
References
- 1.WHO. WHO Report on the Global Tobacco Epidemic, 2008: The MPOWER package. Geneva: World Health Organization; 2008. [Google Scholar]
- 2.Society CC. Cigarette Package Health Warnings: International Status Report. October 2012. [Google Scholar]
- 3.Hammond D, Fong GT, McNeill A, et al. Effectiveness of cigarette warning labels in informing smokers about the risks of smoking: findings from the International Tobacco Control (ITC) Four Country Survey. Tob Control. 2006;15(Suppl. 3):iii19–25. doi: 10.1136/tc.2005.012294. [DOI] [PMC free article] [PubMed] [Google Scholar]
- 4.Thrasher JF, Niederdeppe J, Farrelly MC, et al. The impact of anti-tobacco industry prevention messages in tobacco producing regions: evidence from the US truth campaign. Tob Control. 2004;13:283–8. doi: 10.1136/tc.2003.006403. [DOI] [PMC free article] [PubMed] [Google Scholar]
- 5.WHO. Guidelines for implementation of Article 12 of the WHO Framework Convention on Tobacco Control—Education, Communication, Training and Public Awareness. Geneva: World Health Organization, November 2010. [Google Scholar]
- 6.Partos TR, Borland R, Yong HH, et al. Cigarette packet warning labels can prevent relapse: findings from the International Tobacco Control 4-Country policy evaluation cohort study. Tob Control. 2013;22:e43–50. doi: 10.1136/tobaccocontrol-2011-050254. [DOI] [PMC free article] [PubMed] [Google Scholar]
- 7.Borland R, Hill D. Initial impact of the new Australian tobacco health warnings on knowledge and beliefs. Tob Control. 1997;6:317–25. doi: 10.1136/tc.6.4.317. [DOI] [PMC free article] [PubMed] [Google Scholar]
- 8.Hammond D, Thrasher J, Reid JL, et al. Perceived effectiveness of pictorial health warnings among Mexican youth and adults: a population-level intervention with potential to reduce tobacco-related inequities. Cancer Causes Control. 2012;23(Suppl. 1):57–67. doi: 10.1007/s10552-012-9902-4. [DOI] [PMC free article] [PubMed] [Google Scholar]
- 9.Siahpush M, McNeill A, Hammond D, et al. Socioeconomic and country variations in knowledge of health risks of tobacco smoking and toxic constituents of smoke: results from the 2002 International Tobacco Control (ITC) Four Country Survey. Tob Control. 2006;15(Suppl. 3):iii65–70. doi: 10.1136/tc.2005.013276. [DOI] [PMC free article] [PubMed] [Google Scholar]
- 10.Kennedy RD, Spafford MM, Behm I, et al. Positive impact of Australian ‘blindness’ tobacco warning labels: findings from the ITC four country survey. Clin Exp Optom. 2012;95:590–8. doi: 10.1111/j.1444-0938.2012.00789.x. [DOI] [PMC free article] [PubMed] [Google Scholar]
- 11.Thrasher JF, Pérez-Hernández R, Arillo-Santillán E, et al. [Towards informed tobacco consumption in Mexico: effects of pictorial warning labels among smokers] Salud Pública de México. 2012;54:242–53. [PMC free article] [PubMed] [Google Scholar]
- 12.Thrasher JF, Pérez-Hernández R, Arillo-Santillán E, et al. [Impact of pictorial warning labels on cigarette packs in Mexico: results from a survey of smokers in Mexico] Salud Pública de México. 2012;54:254–63. [PubMed] [Google Scholar]
- 13.Frank E, Denniston M, Pederson L. Declines in smokers’ understanding of tobacco’s hazards between 1986 and 1998: a report from north Georgia. Southern Med J. 2002;95:675–80. [PubMed] [Google Scholar]
- 14.Oncken C, McKee S, Krishnan-Sarin S, et al. Knowledge and perceived risk of smoking-related conditions: a survey of cigarette smokers. Prev Med. 2005;40:779–84. doi: 10.1016/j.ypmed.2004.09.024. [DOI] [PubMed] [Google Scholar]
- 15.Schoenbaum M. Do smokers understand the mortality effects of smoking? Evidence from the Health and Retirement Survey. Am J Public Health. 1997;87:755–9. doi: 10.2105/ajph.87.5.755. [DOI] [PMC free article] [PubMed] [Google Scholar]
- 16.Santillan EA. Impacto de politicas publicas en contra del tabaquismo en una cohorte de fumadores adultos Mexicanos. Mexico: Instituto Nacional de Salud Pública; 2012. [Google Scholar]
- 17.Stockwell TR, Rutley R, Clark K. Pesticides and other chemicals in cigarette tobacco. Med J Aust. 1992;157:68. doi: 10.5694/j.1326-5377.1992.tb121624.x. [DOI] [PubMed] [Google Scholar]
- 18.Thrasher JF, Murukutla N, Pérez-Hernández R, et al. Linking mass media campaigns to pictorial warning labels on cigarette packages: a cross-sectional study to evaluate impacts among Mexican smokers. Tob Control . 2013;22:e57–e65. doi: 10.1136/tobaccocontrol-2011-050282. [DOI] [PubMed] [Google Scholar]
- 19.Costello MJ, Logel C, Fong GT, et al. Perceived risk and quitting behaviors: results from the ITC 4-country survey. Am J Health Behav. 2012;36:681–92. doi: 10.5993/AJHB.36.5.10. [DOI] [PMC free article] [PubMed] [Google Scholar]
- 20.Hyland A, Li Q, Bauer JE, et al. Predictors of cessation in a cohort of current and former smokers followed over 13 years. Nicotine Tob Res. 2004;6(Suppl. 3):S363–9. doi: 10.1080/14622200412331320761. [DOI] [PubMed] [Google Scholar]
- 21.Borland R, Yong HH, Wilson N, et al. How reactions to cigarette packet health warnings influence quitting: findings from the ITC Four-Country survey. Addiction. 2009;104:669–75. doi: 10.1111/j.1360-0443.2009.02508.x. [DOI] [PMC free article] [PubMed] [Google Scholar]
- 22.Borland R, Wilson N, Fong GT, et al. Impact of graphic and text warnings on cigarette packs: findings from four countries over five years. Tob Control. 2009;18:358–64. doi: 10.1136/tc.2008.028043. [DOI] [PMC free article] [PubMed] [Google Scholar]
- 23.GMI. GMI Global Panel Book. Bellevue, WA: Global Market Insight, Inc; 2013. [Google Scholar]
- 24.Watson D. Correcting for Acquiescent Response Bias in the Absence of a Balanced Scale: An Application to Class Consciousness Sociological Methods Research Sociological Methods and Research. 1992;21:52–88. [Google Scholar]
- 25.IARC. IARC Handbooks of Cancer Prevention, Tobacco Control. Vol. 12: Methods for Evaluating Tobacco Control Policies. Lyon: France: International Agency for Research on Cancer; 2008. [Google Scholar]
- 26.Farrelly MC, Davis KC, Duke J, et al. Sustaining ‘truth’: changes in youth tobacco attitudes and smoking intentions after 3 years of a national antismoking campaign. Health Educ Res. 2009;24:42–8. doi: 10.1093/her/cym087. [DOI] [PubMed] [Google Scholar]
- 27.Sussman S, Levy D, Lich KH, et al. Comparing effects of tobacco use prevention modalities: need for complex system models. Tob Induc Dis. 2013;11:2. doi: 10.1186/1617-9625-11-2. [DOI] [PMC free article] [PubMed] [Google Scholar]
- 28.Thrasher JF, Arillo-Santillan E, Villalobos V, et al. Can pictorial warning labels on cigarette packages address smoking-related health disparities? Field experiments in Mexico to assess pictorial warning label content. Cancer Causes Control. 2012;23(Suppl. 1):69–80. doi: 10.1007/s10552-012-9899-8. [DOI] [PMC free article] [PubMed] [Google Scholar]
- 29.Waters H, Sáenz de Miera B, Ross H, et al. The Economics of Tobacco and Tobacco Taxation in Mexico. Paris: International Union Against Tuberculosis and Lung Disease; 2010. [Google Scholar]
- 30.Hosseinpoor AR, Parker LA, Tursan d'Espaignet E, et al. Socioeconomic inequality in smoking in low-income and middle-income countries: results from the World Health Survey. PLoS One. 2012;7:e42843. doi: 10.1371/journal.pone.0042843. [DOI] [PMC free article] [PubMed] [Google Scholar]